

Abstract
Purpose
The aim of the study was to evaluate the effects of imageless computer-assisted surgery (CAS) on the accuracy of positioning of the femoral component and on the short-term clinical outcome in hip resurfacing (HR) using a randomised prospective design.
Methods
A total of 75 consecutive patients undergoing HR were randomly allocated to CAS and conventional implantation, respectively. Preoperatively and six months post-operatively standardised pelvic anteroposterior X-ray images, the total Western Ontario and McMaster Universities Osteoarthritis Index, the Harris Hip Score and the EQ-5D utility index were evaluated in a blinded manner. The primary end point of the study was a post-operative femoral component malpositioning in five degrees or more either varus or valgus absolute deviation from the planned stem shaft angle.
Results
Patient demographics and algofunctional scores did not differ between the CAS and conventional implantation samples. Using CAS fewer femoral components were positioned in five or more degrees absolute deviation (4/37 vs 12/38, Fisher’s exact p = 0.047; 95 % confidence interval for the primary end point’s incidence difference: +3 %; +39 %); the respective incidences of five or more degrees of varus deviation were 0/37 vs 5/38. One conversion to a stemmed prosthesis (CAS group) was performed for periprosthetic femoral neck fracture. Radiological signs of superolateral femoral neck/implant impingement were observed in two cases (one CAS-based and one conventional implantation).
Conclusions
The accuracy of femoral HR component positioning was significantly improved using CAS. However, one major complication necessitated early revision in the CAS group at six months of observation. Apart from that adverse event no inter-group differences were observed for the short-term clinical outcome. Future studies need to address the clinical long-term relevance of CAS in HR.
Introduction
Hip resurfacing (HR) represents a femoral bone-conserving total joint replacement option with evidence of an encouraging midterm outcome in adequately selected patients [1–3]. Major short-term risks include periprosthetic femoral neck fracture and early aseptic loosening of the femoral component [4, 5]. In this context, non-optimal positioning of the prosthesis and femoral neck notching are critical [6–11]. Furthermore, inadequate implant orientation is associated with a higher risk of bone/implant impingement and complications related to increased metal wear [12, 13]. However, correct alignment of the femoral component as a crucial prerequisite for successful long-term outcome in HR, is technically demanding and implies a substantial learning curve.
The use of computer-assisted surgery (CAS) has been shown to improve the accuracy of implant positioning in total knee [14] and conventional total hip [15, 16] arthroplasty (THA). Recently, preclinical and clinical studies have provided evidence of an improved positioning of the femoral component in HR using CAS.
The aim of this study was to evaluate, for the first time, the effects of imageless CAS on the accuracy of femoral component positioning and on the short-term clinical outcome in HR using a randomised prospective design.
Materials and methods
Study design and sample size justification
This investigation proposed 1:1 randomisation into CAS and conventional implantation, where block randomisation was applied without stratification. The randomisation list was generated by means of SAS® software (release 6.10 for Windows®) and hosted by the trial’s principal investigator. The investigation was implemented in an investigator-masked manner, i.e. X-ray-based assessment of the primary end point was performed by a clinical rater, who acted independently of the previous randomisation information and the actual implantation technique; furthermore, blinded pre- and post-operative functional and questionnaire assessments were implemented by introduction of an independent study nurse.
The primary end point was defined as the occurrence of an absolute deviation of five degrees or more between the post-operative and the planned stem shaft angle (SSA). According to the literature an incidence of this end point of less than ten percent was assumed for the CAS implantation and of less than 40 % for the conventional method, respectively [17]. To detect the resulting clinically relevant incidence difference of 30 % in the primary end point by means of a two-sided Fisher’s exact test at the five percent significance under minimum power of 80 %, the evaluation of 2 × 38 patients was found necessary. Allowing for a dropout rate of ten percent during the interval between inclusion and post-operative examination, the study was designed to include a total of 2 × 44 = 84 patients. The sample size calculation was performed by means of the nQuery Advisor® software (release 5.0 for Windows®). The study design was fully approved by the local Independent Ethics Committee (protocol no. EK108052008).
Patient recruitment and follow-up
Exclusion criteria comprised age older than 65 years, inadequate femoral and/or acetabular bone stock due to osteoporosis, osteomalacia and/or radiation, presence of tumour disease, septic hip arthritis, dislocated dysplastic hip joint (> Eftekhar grade B), non-compliance, drug abuse and ongoing pregnancy.
As illustrated in the CONSORT flow diagram (Fig. 1), of a total of 120 consecutive patients who were scheduled for HR between October 2008 and February 2010 at the trial site, 36 patients were primarily excluded: among those, ten refused to participate in the study, seven met one or more of the exclusion criteria and 19 patients could not be recruited for other, predominantly logistical reasons (e.g. participation in another study, non-availability of the study surgeons, preoperative decision for a different type of implant). The remaining 84 patients (= 84 hips) were then randomly allocated to the CAS and conventional implantation samples, respectively. Another nine patients (11 %) had to be excluded from the study after randomisation for logistical reasons (e.g. unexpected non-availability of the study surgeons or intra-operative decision to perform HR with a different type of implant or conventional THA due to morphological changes of the femoral head).
Fig. 1.

CONSORT flow diagram displaying the progress of all participants through each stage of the trial
All remaining 75 patients (37 CAS and 38 conventional implantations) were followed up prospectively. Preoperatively and at six months post-operatively, the total Western Ontario and McMaster Universities (WOMAC) Osteoarthritis Index (%, 100 % indicating best possibly reported well-being), the total Harris Hip Score (HHS) (points, 100 points indicating best possible function) and the EQ-5D utility index (%, 100 % indicating best possibly reported well-being) were documented by means of written interviews (if required, partially assisted by a study nurse); furthermore, standardised pelvic anteroposterior (AP) X-ray images were evaluated in a blinded manner.
Preoperative planning
The planned AP projected SSA was aimed to be set approximately five degrees valgus compared to the native centre-collum-diaphysis (CCD) angle. Generally, this was achieved by choosing a planned stem axis intersecting the lateral femoral cortex at the level of the centre of the lesser trochanter. If necessary, minor modifications of this axis were made in order to prevent superolateral notching and varus orientation. The smallest possible femoral component size was chosen in order to prevent unnecessary acetabular bone resection.
Operative procedure
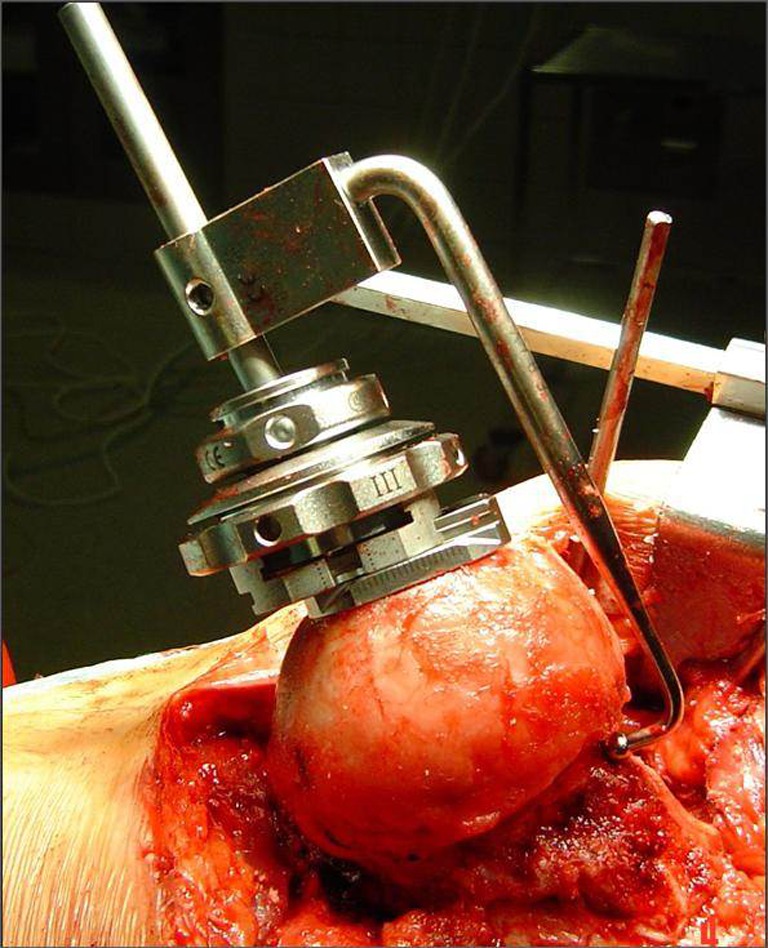
The Durom™ Hip Resurfacing (Zimmer, Warsaw, IN, USA) prosthesis, consisting of a press-fit acetabular and a cemented femoral component, was used in all cases. Imageless computer-assisted navigation of the femoral component (CAS group) was performed using the Navitrack® system (ORTHOsoft Inc., Montreal, Canada, Fig. 2), whereas the conventional free-hand Durom™ K-wire positioning jig (Fig. 3) served as control, both used according to the manufacturer’s recommendations. Surgery was performed between October 2008 and February 2010 by two surgeons experienced in both HR and CAS using the posterolateral approach. All patients received 1.5 g cefuroxime immediately prior to surgery. Low molecular weight heparin was used for antithrombotic prophylaxis and all patients were allowed pain-adapted full weight-bearing immediately after surgery.
Fig. 2.

Surgical field (a) and screenshot from the navigation software (b) during imageless computer-assisted K-wire navigation
Fig. 3.
The conventional free-hand Durom™ K-wire positioning jig was used as control
Radiological evaluation
Standardised X-ray pelvic AP and unilateral axial frog-leg views were obtained preoperatively, post-operatively during the hospital stay after completion of full weight-bearing mobilisation and at 6 months post-operatively and analysed in a blinded manner by one of the authors (J.G.) using mediCAD® software (HECTEC GmbH, Niederviehbach, Germany). Individualised footprint mats were used to control femoral rotation (Fig. 4).
Fig. 4.

Individual footprint mats were used to control femoral rotation during positioning for X-ray
SSA was defined as the angle between the stem of the femoral HR component and the axis of the femoral diaphysis in the AP projection. Non-optimal femoral component positioning as the primary end point of the study was defined as five degrees or more absolute, e.g. either relative varus or valgus, deviation from the planned SSA as illustrated in Fig. 5. Additionally, relative varus deviation from the planned SSA, superolateral head/neck offset, femoral offset, femoral length, mediolateral femoral neck diameter, cup inclination, heterotopic ossifications classified according to Brooker et al. [18] and radiological signs of femoral neck notching and bone/implant impingement were assessed on post-operative and six month AP films, respectively.
Fig. 5.

Planned SSA (a) and post-operative SSA (b) as determined on a standardised AP projection
Evaluation of clinical outcome
The validated German version [19] of the WOMAC Osteoarthritis Index, a multidimensional, self-administered health status instrument for the evaluation of the health-related quality of life in patients with osteoarthritis of the hip and knee joints [20], was filled out by the participants preoperatively and six months post-operatively. Comprising the categories “pain”, “stiffness” and “physical function”, the WOMAC Osteoarthritis Index represents an internationally well-accepted disease-specific outcome measure instrument [21–23] and has been widely used in longitudinal studies detecting clinically relevant changes in outcome after THR [24, 25]. Additionally, the HHS [26] and the EuroQol-5D (EQ) utility index were registered prior to surgery and six months post-operatively. In addition the patients’ physical condition was assessed preoperatively using the American Society of Anaesthesiologists (ASA) score [27].
Statistical analysis
According to the choice of the binary primary end point “absolute deviation between planned and achieved SSA of five degrees or more (yes/no)”, the confirmatory analysis of the investigation was based on an exact two-sided Fisher’s test at the five percent level; the result of this test was summarised by a p value. Furthermore, an exact 95 % confidence interval for the primary end point’s incidence difference between the CAS and the conventional implantation sample was estimated; if “0” is not contained in this interval, a significant difference in incidences is established. The confirmatory analysis of the trial was based on the intent-to-treat principle.
To take into account the impact of the five degree cut point introduced into the definition of the primary end point, a sensitivity analysis of the confirmatory analysis was implemented by means of varying this cut point between three and ten degrees; the results of this sensitivity analysis were summarised in terms of the respective incidence differences and the corresponding Fisher’s test p values.
An exploratory analysis of the primary end point was then based on multiple logistic regression modelling, where the end point’s incidence pattern between the CAS and the conventional implantation samples was related to several cofactors such as preoperative sample differences in radiological and functional characteristics. The results of this multiple logistic regression modelling was summarised in terms of likelihood ratio (LR) test p values at the local five percent significance level; modelling was performed via backward selection.
Exploratory analysis of secondary end points was implemented according to the end points’ scale level: categorical end points were described by means of absolute and relative frequencies; significance comparisons within and between subsamples were performed by means of McNemar’s and Fisher’s tests, respectively. Continuous end points were described by means of medians and quartiles (graphically by means of non-parametric box plots); significance comparisons within and between subsamples were performed by means of sign and Wilcoxon tests, respectively. The results of significance comparison were summarised in terms of p values and interpreted as indicators of local significance in case of p values < 0.05.
Numerical and graphical evaluation was performed by means of the SAS® software (release 6.10 for Windows®) and the SPSS® software (release 18.0 for Windows®) according to the investigation’s trial protocol and its statistical analysis plan.
Results
Preoperative patient demographics and perioperative details
Sex, age at surgery, body mass index, preoperative total ASA and Charnley scores, percentages of patients with no or only mild co-morbidities (preoperative ASA 1–2) and Charnley score A (affected hip joint only reason for functional deficit), type of decisive diagnosis, duration of preoperative symptoms, percentages of contralateral osteoarthritis and status post contralateral THR, diameter of implanted femoral component, incision length and the frequency of blood transfusions needed did not differ between CAS and conventional groups (Table 1). The use of navigation increased the total operative time (median 100 vs 94 min, respectively) and decreased the rate of blood transfusions needed (11 vs 18 %); however, these differences were not locally significant. Table 1 summarises the samples’ demographic and perioperative characteristics.
Table 1.
Patient demographics and perioperative details
| CAS | Conventional | p value | |
|---|---|---|---|
| Women | 10/37 (27 %) | 8/38 (21 %) | 0.597 |
| Age at surgery (years) | 51 (45–55) | 50 (44–55) | 0.574 |
| BMI (kg/m2) | 27.4 (25.0–30.4) | 26.4 (24.7–29.7) | 0.870 |
| Percentage preoperative ASA score 1–2 | 0/37 (0 %) | 1/38 (3 %) | 1.000 |
| Preoperative Charnley A | 17/30 (57 %) | 19/33 (58 %) | 1.000 |
| Diagnosis | |||
| Idiopathic osteoarthritis | 32/34 (94 %) | 34/36 (94 %) | |
| Dysplasia | 2/34 (6 %) | 1/36 (3 %) | |
| Post-traumatic | 0/34 (0 %) | 1/36 (3 %) | |
| Duration of preoperative symptoms (years) | 4 (2–8) | 4.5 (3–9) | 0.633 |
| Contralateral osteoarthritisa if not status post contralateral THR | 12/29 (41 %) | 10/33 (30 %) | 0.430 |
| Status post contralateral total hip replacement | 8/37 (22 %) | 5/38 (13 %) | 0.375 |
| Diameter of implanted cap femoral component (mm) | 48 (46–50) | 50 (46–52) | 0.120 |
| Scar length (cm) | 21 (19–25) | 22 (20–23) | 0.735 |
| Operative time (min) | 99 (92–111) | 94 (85–106) | 0.052 |
| Cases with blood transfusions | 5/38 (13 %) | 6/37 (16 %) | 0.754 |
Values are presented as median (interquartile range), and p values indicate levels of local significance for exploratory inter-group comparison (derived from two-sample Wilcoxon tests in case of continuous variables and from Fisher’s exact tests in case of binary variables)
ASA American Society of Anaesthesiologists, BMI body mass index, THR total hip replacement
aCases with status post contralateral THR excluded
Preoperative planning
The overall mean native CCD angle was 139° ranging from 120.1 to 144.8° and the overall mean planned SSA was 138° ranging from 128.8 to 150.0°. This resulted in a mean overall difference between the planned SSA and the CCD of 6.2° relative valgus (Table 2). In order to prevent notching of the femoral cortex, for cases with native CCD angles exceeding 134.9° (n = 29) the frontal projections of the planned SSA were set from 6.0° varus to 8.3° valgus in relation to the respective CCD angles resulting in a mean relative valgus deviation of only 1.8° as compared to 8.9° for the remaining 46 cases with CCD angles below 135° with no case of relative varus-orientated planned SSA in this subgroup (Table 2).
Table 2.
Radiological outcome 6 months after HR with (CAS) and without (control) navigated femoral component positioning
| CAS | Conventional | p value | |
|---|---|---|---|
| Native CCD angle (°) | 131.4 (126.0–137.2) | 131.4 (125.0–136.7) | 0.535 |
| Planned SSA (°) | 138.3 (136.5–141.3) | 138.1 (135.2–139.7) | 0.138 |
| Difference planned SSA minus native CCD angle (°) | 6.7 (2.3–9.5) | 7.5 (1.4–10.8) | 0.992 |
| Difference planned SSA minus native CCD angle (°) if CCD < 135° | 8.7 (7.0–12.1) | 8.9 (6.3–11.9) | 0.817 |
| Difference planned SSA minus native CCD angle (°) if CCD ≥ 135° | 2.1 (0.2–3.6) | 1.3 (−1.7 to 2.9) | 0.302 |
| Post-operative SSA (°) | 140.8 (138.5–143.8) | 140.1 (134.1–143.4) | 0.330 |
| Difference post-operative SSA minus native CCD angle (°) | 7.3 (4.1–11.9) | 7.7 (3.8–13.0) | 0.987 |
| Difference post-operative minus planned SSA (°) | 1.3 (−1.1 to 4.2) | 2.4 (−1.3 to 3.9) | 0.916 |
| Absolute difference post-operative minus planned SSA (°) | 2.7 (1.2–4.3) | 3.3 (1.7–6.2) | 0.138 |
| Cap femoral component positioning in ≥ 5.0° varus or valgus deviation | 4/37 (11 %) | 12/38 (32 %) | 0.047 |
| Cap femoral component positioning in ≥ 5.0° varus deviation | 0/37 (0 %) | 5/38 (13 %) | 0.054 |
| Cup inclination (°) | 44.0 (41.2–49.5) | 48.3 (41.6–51.6) | 0.242 |
| Mild heterotopic ossifications (Brooker 1) at 6 months post-operatively | 3/36 (8.3 %) | 6/38 (15.8 %) | 0.479 |
| Femoral neck notching | 0 | 0 | |
| Bone/implant impingement at 6 months post-operatively | 1 | 1 | |
| Femoral neck fracture | 1a | 0 |
Values are presented as median (interquartile range) and p values indicate levels of local significance for exploratory inter-group comparison (derived from two-sample Wilcoxon tests in case of continuous variables and from Fisher’s exact tests in case of binary variables)
CCD centre-collum-diaphysis
aA case with revision at 6 weeks post-operatively
Radiological outcome
Table 2 summarises the radiological analysis. No sample difference was observed for the post-operative SSA (140.0°), for the difference between post-operative SSA and CCD angle (8.2° valgus) or for the difference and the deviation—with the latter being expressed as the absolute difference—between post-operative and planned SSA (median 3 and 3°, respectively). However, using CAS fewer femoral components were positioned both in five or more degrees absolute (including relative varus and valgus) deviation (4/37 vs 12/38, Fisher’s p = 0.047; 95 % confidence interval for the primary end point’s incidence difference +3 %; +39 %) and in five or more degrees relative varus deviation (0/37 vs 5/38). Notably, none of the navigated femoral components were implanted non-optimally in varus position. Figure 6 depicts the deviations of the post-operative from the planned SSA stratified for conventional versus CAS implantation and for post-operative angles ≤140° versus >140°.
Fig. 6.

Non-parametric box plots for the distributions of deviation between planned and achieved SSA (°), stratified for conventional versus CAS implantation and for post-operative angles ≤140° versus >140°. Circles indicate statistical outliers with a deviation of at least 1.5 times the interquartile range from the respective quartile, and asterisks indicate extreme values with a corresponding minimum deviation of at least 2.0 times
Superolateral head/neck offset, femoral offset, femoral length, mediolateral femoral neck diameter and cup inclination angle did not differ significantly between CAS and control groups. Mild heterotopic ossifications (Brooker 1) were observed in 12 % of all patients (eight and 16 % for conventional and CAS samples, respectively) and no radiological signs of femoral neck notching were found six months post-operatively.
Functional outcome
Table 3 summarises the groups’ results of functional assessments and questionnaire interviews before and six months after surgery. After CAS-based HR a median increase of 28 % in the total WOMAC Osteoarthritis Index was observed (interquartile range 21–38 %) versus a median increase of 23 % (13–33 %) after conventional implantation (Wilcoxon p = 0.106); this gradual sample difference in six-month WOMAC Osteoarthritis Index increases corresponds to a slightly lower preoperative median WOMAC Osteoarthritis Index in the CAS group. The total HHS increases were 38 points (27–47 points) after CAS versus 33 points (27–41 points) after conventional implantation (Wilcoxon p = 0.330); for the EuroQol-related utility index median increases of 19 % (10–21 %) versus 11 % (10–21 %, Wilcoxon p = 0.569) were observed, respectively, again corresponding to a gradual preoperative sample difference (Fig. 7).
Table 3.
Clinical outcome 6 months after HR with (CAS) and without (control) navigated femoral component positioning
| CAS | Conventional | p value | |
|---|---|---|---|
| WOMAC preoperative (%) | 55 (44–68) | 64 (54–76) | 0.034 |
| WOMAC 6 months post-operative (%) | 89 (78–95) | 91 (82–98) | 0.321 |
| Difference WOMAC post-preoperative (%) | 28 (21–38) | 23 (13–33) | 0.106 |
| HHS preoperative (points) | 51 (45–65) | 58 (50–66) | 0.143 |
| HHS 6 months post-operative (points) | 91 (87–99) | 95 (90–97) | 0.505 |
| Difference HHS post-preoperative (points) | 38 (27–47) | 33 (27–41) | 0.396 |
| EuroQol preoperative (%) | 79 (53–79) | 79 (79–89) | 0.176 |
| EuroQol 6 months post-operative (%) | 89 (89–100) | 89 (79–100) | 0.790 |
| Difference EuroQol post-preoperative (%) | 19 (10–21) | 11 (10–21) | 0.384 |
Values are presented as median (interquartile range) and p values indicate levels of local significance for exploratory inter-group comparison (derived from two-sample Wilcoxon tests in case of continuous variables and from Fisher’s exact tests in case of binary variables)
WOMAC Western Ontario and McMaster University Osteoarthritis Index
Fig. 7.

Non-parametric box plots for the distributions of total WOMAC Osteoarthritis Index (0–100 %) and total HHS (0–100 points) before and 6 months after surgery, respectively, stratified for conventional versus CAS implantation. Circles indicate statistical outliers with a deviation of at least 1.5 times the interquartile range from the respective quartile, and asterisks indicate extreme values with a corresponding minimum deviation of at least 2.0 times
Multivariate analysis
Logistic regression modelling of the primary end point strictly confirmed the above univariate findings by a locally significant association with the choice of implantation method (LR test p = 0.023), but no locally significant association with the cofactors under consideration (LR test p = 0.053 for body mass index, p = 0.071 for age at surgery, p = 0.133 for gender and p = 0.082 for the total WOMAC Osteoarthritis Index before surgery).
Complications
Six weeks post-operatively one conversion to a stemmed prosthesis had to be performed in a 54-year-old male patient after navigated HR for periprosthetic femoral neck fracture (Fig. 8). The size of the implanted femoral component in this patient was 50 mm, the native CCD angle 124.7°, the planned SSA 139.5° and the deviation of the post-operative from the planned SSA was 0.0°.
Fig. 8.

Periprosthetic femoral neck fracture necessitated conversion to a stemmed prosthesis in a 54-year-old male patient 6 weeks after navigated HR. Preoperative (a, b), 1 week (c, d), 6 weeks (e, f) post-operative as well as 1 week post revision (g, h) AP and Lauenstein views
Radiological signs of superolateral femoral neck/implant impingement were observed in two cases at the six-month follow-up. One of these patients was a 47-year-old man who received a navigated, 44-mm diameter femoral HR component with a cup inclination of 42.0°, a native CCD angle of 142.2°, a planned SSA of 142.0° and a deviation of the post-operative from the planned SSA of 4.8° valgus. The other case with radiological signs of neck/implant impingement was a 60-year-old man who had a conventionally implanted 50-mm femoral component with a corresponding cup inclination of 41.7°. The preoperative CCD angle of this patient was 120.9°; the planned SSA 129.0° and the difference between the post-operative and the planned SSA was 4.9° valgus.
Discussion
Non-optimal alignment of the femoral component denotes a major reason for early failure in modern HR arthroplasty [4, 8, 10, 28, 29]. Varus orientation of the HR femoral component is associated with an increased rate of femoral neck fracture and aseptic implant loosening. Excessive valgus placement, on the other hand, necessitates the use of a larger size component [30] and increases the risk of femoral neck notching, which in turn may lead to weakened periprosthetic bone. Furthermore, notching is associated with an impaired vascular supply of the remaining femoral bone stock, thereby predisposing to avascular necrosis.Thus excessive varus and valgus orientation increases the risk of short-term implant failure [29, 31, 32]. It is therefore generally accepted that optimal HR femoral component positioning should comprise slight valgus orientation in relation to the preoperative CCD angle, while avoiding superolateral neck notching, in order to minimise tension in the adjacent periprosthetic femoral bone [4, 9, 30, 33–35].
This study sought to evaluate in a prospective randomised manner whether (1) the use of imageless CAS can reduce the rate of non-optimal femoral component orientations and (2) whether CAS has an effect on the short-term clinical outcome in HR. The primary end point of the study was a post-operative femoral component positioning in five or more degrees either varus or valgus deviation from the planned SSA.
Methodological aspects
There are some relevant limitations of the study. Complying with national radiation protection regulations the radiological evaluation was performed using native digital X-ray images. In this context cross-sectional, e.g. computer tomographic, imaging allowing for a more precise correction for rotational positioning errors would have been beneficial. Moreover, a more sophisticated method for the analysis of native radiographs, e.g. Einzelbild-Röntgenanalyse (EBRA), was not available. However, unlike other authors evaluating SSA using native X-ray images [36], we allowed for intra-individual differences in femoral rotation and pelvic orientation by using individualised footprint mats applied during X-ray examination. As it was not possible to thoroughly ensure patient positioning on these footprint mats for logistical and staff-related variations during the trial, only 57 of the 75 trial participants were correctly positioned in terms of the trial protocol; however, this did not change the confirmatory result tendency of the investigation: whereas total primary end point incidences of 33 versus 11 % SSA deviations of 5° or more were observed in the total samples, an incidence difference of 33 versus seven percent was found in the subsamples of patients with protocol-adherent mat positioning.
Furthermore, we did not include a radiological analysis of femoral component antetorsion due to limitations concerning the intra- and inter-individual standardisation of rotation using frog-leg views, being a prerequisite for a reproducible assessment.
With a double-blinded design obviously not being possible in this kind of clinical trial, a pseudo double-blinded study design would have been favourable. However, for logistical reasons, e.g. warranting access to patient-related information during hospital stay, this was not possible, leaving a study design with at least all observers (i.e. the study nurse and the clinical and radiological observers) being blinded to the randomised implantation method.
A further limitation with respect to the evaluation of the clinical outcome is the rather short observation period. We believe, however, that the chosen observation period of six months is sufficient for the assessment of early implant failure. To address the long-term clinical outcome, we will subsequently include a longer follow-up period of this cohort.
The type of the manual alignment jig applied in the control group is crucial as it determines the reference in positioning accuracy. Therefore, another limitation of the study is the fact that we only used the conventional head-planing jig and we were therefore unable to assess any potential effects of alternative, e.g. femoral neck centring, types of jigs on femoral component orientation. This issue has to be addressed in future studies.
The major finding of this prospective randomised study is the reduction of non-optimally placed femoral components in the CAS group. The majority of femoral components implanted in more than five degrees of absolute deviation compared with the preoperative plan, i.e. 12/38 (32 %) in the conventional group and 4/37 (11 %) in the CAS group, were placed in relative valgus position with a maximum valgus deviation of 24.4 and 14.9° in the conventional and CAS groups, respectively. Since we did not observe any radiological signs of femoral neck notching in the whole study cohort, we conclude that relative valgus orientation may not be associated with inferior short-term clinical radiological and clinical outcome. On the other hand, varus malpositioning of the femoral component resulting in potentially higher strain loading of the proximal femur can be regarded as clinically more relevant. We believe that CAS is a useful method to prevent critical varus alignment of the femoral component in HR as we observed 5/38 (13 %) cases with a varus deviation exceeding five degrees (maximum 10.3°) in the conventional group as compared to none in the CAS group.
Note that the confirmatory result of this investigation is due to a somewhat arbitrary choice of the five degree cut off point contained in the primary end point’s definition: Table 4 displays the results of a corresponding sensitivity analysis varying this cut off point from three to ten degrees, where none of the other cut off points implied a locally significant incidence difference. For example, the incidences of an absolute deviation of ten degrees or more were found in three percent after CAS versus eight percent after conventional implantation (Fisher p = 0.615) also demonstrating the confirmatory result’s dependence on the cut off point in terms of the resulting absolute end off point incidences. As a consequence the observed confirmatory results must be readdressed not only concerning the rigid concentration on absolute deviations rather than varus and valgus differentiation, but also concerning the underlying primary end point’s definition by means of the five degree tolerance for deviations between planned and achieved SSAs. On the other hand, it must be emphasised that the five degree cut off point was chosen strictly according to the available literature, when the trial design was constituted in 2007; as a consequence its evidence-based a priori definition confirms its result.
Table 4.
Relative frequencies for the primary end point’s incidence “absolute deviation of at least 5° between planned and post-operative SSA”: variation of incidences for different cut points (3, 5, 7 and 10°) in this primary end point definition as well as respective two-sided Fisher’s exact test p values
| Absolute deviation (°) between post-operative and planned SSA | ≥3 | <3 | |
| Conventional (n = 38) | 55 % | 45 % | |
| CAS (n = 37) | 41 % | 60 % | p (Fisher) = 0.251 |
| Absolute deviation (°) between post-operative and planned SSA | ≥5 | <5 | |
| Conventional (n = 38) | 32 % | 68 % | |
| CAS (n = 37) | 11 % | 89 % | p (Fisher) = 0.047 |
| Absolute deviation (°) between post-operative and planned SSA | ≥7 | <7 | |
| Conventional (n = 38) | 21 % | 79 % | |
| CAS (n = 37) | 8 % | 92 % | p (Fisher) = 0.191 |
| Absolute deviation (°) between post-operative and planned SSA | ≥10 | <10 | |
| Conventional (n = 38) | 8 % | 92 % | |
| CAS (n = 37) | 3 % | 97 % | p (Fisher) = 0.615 |
Systematic review results
As summarised in Table 5, in accordance with our findings other authors have observed optimised alignment of the femoral component in HR using CAS as compared to the conventional mechanical jig technique. Gallart et al. in a retrospective study using the ASR™ hip replacement inserted through a modified Hardinge lateral approach and the Brainlab® imageless navigation system observed that significantly less femoral components (3/16 vs 7/16, p < 0.05) in the CAS group were placed in more than five degrees varus or valgus deviation [37]. In a prospective randomised trial also using the ASR™ prosthesis and the Brainlab® navigation software, Hart et al. found 0/30 versus 9/30 outliers using CAS and conventional technique, respectively. However, the authors obviously did not aim at a relative valgus orientation of the femoral component and accordingly defined outliers as over five degrees varus or valgus deviation of the SSA as compared to the native CCD angle. Furthermore, a statistical analysis addressing the inter-group differences in the frequency of outliers is not provided [38].
Table 5.
Recent clinical trials investigating the effect of CAS on the rate of non-optimally positioned femoral HR components evaluated using AP radiographs
| First author | Year | Study type (n) | Implant/CAS system | Outlier rate reduction by CAS | Limitations |
|---|---|---|---|---|---|
| Stiehler | 2012 | Randomised prospective (n = 75) | Durom™/Navitrack® | 4/37 vs 12/38 (p = 0.047) | |
| Gallart [37] | 2010 | Retrospective (n = 32) | ASR™/Brainlab® | 3/16 vs 7/16 (p < 0.05) | |
| Schnurr [39] | 2010 | Retrospective (n = 72) | ASR™/Brainlab® | 1/40 vs 9/32 (p < 0.001) | Complex outlier definition |
| Resubal [50] | 2009 | Retrospective (n = 176) | BHR/Brainlab® | 0/45 vs 31/141 (p < 0.001) | Potential learning curve bias (historical control group) |
| Krüger [40] | 2009 | Prospective matched pairs (n = 18) | BHR/CT-based | No inter-group difference in femoral component position | Outlier rate not stated, statistics |
| Ganapathi [7] | 2009 | Retrospective (n = 139) | Durom™/Navitrack® | 0/51 vs 33/131 (p < 0.0001) | |
| Hart [13] | 2008 | Randomised prospective (n = 60) | ASR™/Brainlab® | 0/30 vs 9/30 | Statistics, target SSA = CCD angle |
Resubal and co-workers in a retrospective study including 45 navigated and 131 conventionally implanted BHR prostheses using the Brainlab® imageless CAS system observed that over five degrees relative varus or valgus deviation occurred in 0/45 of navigated as opposed to 31/141 (23.8 %) of conventionally implanted femoral components (p < 0.001) including a high proportion (26/141, 20.0 %) of varus outliers. Schnurr and co-workers in a retrospective study of 72 patients using the ASR™ system combined with the Brainlab® navigation tool defined outliers as the presence of one or the combination of more of the following conditions: relative varus position and/or implantation of an increased size of the femoral component compared to the preoperative plan, SSA <130°, notching and/or uncovered reamed cancellous bone of the femoral neck. The authors observed a statistically significant decreased rate of outliers (1/40, 2.5 vs 9/32, 28.1 %, p < 0.001) using CAS [39]. Krüger et al. included 18 patients in a prospective matched pairs study using the BHR prosthesis implanted through a posterolateral approach in combination with a CT-based system for both acetabular and femoral component navigation. Without commenting on the rate of radiological outliers, the authors found no inter-group differences in terms of femoral component position and femoral notching on either AP or lateral radiographs. However, it was not stated which SSA orientation in the frontal projection was aimed at, but with the reported overall mean difference between native CCD angle and post-operative SSA being less than one degree the plan was presumably the preservation of the preoperative CCD angle [40].
In a previous series retrospectively comparing 51 vs 88 consecutive HRs performed with and without navigation, respectively, using the same surgical approach, type of prosthesis and CAS system as used in this study, Ganapathi et al. did not observe any inter-group differences in the mean native CCD angles, planned or post-operative SSAs. However, in accordance with the findings of our study, deviations between planned and post-operative SSAs of greater than five degrees were found in 33 patients (38 %) in the conventional group in contrast to none in the CAS group [17]. Taking this body of evidence from the current literature together with the results of our prospectively randomised study, we conclude that the use of CAS can prevent non-optimal femoral component placement in HR.
The observed significant preventive effect of CAS for varus deviation with no influence of valgus deviation on short-term clinical and radiological outcome suggest a more limited effect of CAS for HR in the hands of experienced surgeons as would have been expected. Notably, this critical conclusion based on prospectively randomised data is in disagreement with other authors’ views.
In addition to the optimisation of femoral component orientation, however, the positioning of the acetabular component is crucial and must be considered, too, to avoid e.g. bone/implant and implant/implant impingement, aseptic loosening together with systemic and local adverse reactions to metal debris as a consequence of non-optimal cup alignment [5, 41–44]. In this context, combined femoral and acetabular component navigation represents an appealing concept to further optimise implant orientation potentially improving the clinical outcome in HR. However, there is a need to overcome limitations associated with acetabular component navigation with regard to accuracy and practicability of landmark registration [45].
Despite optimal post-operative alignment of the femoral component and absence of radiological signs of femoral neck notching, one case of early periprosthetic fracture necessitated revision in the CAS group. Even if the overall failure rate is not statistically significant between the groups (p = 0.493) and no further adverse events occurred up to an observation period of six months, this major incident of early failure clearly indicates that early implant failure is not based on component misalignment alone, but is multifactorial. In addition to suboptimal femoral component positioning and femoral neck notching, other factors, e.g. female gender, short stature, obesity, poor bone quality, large cystic defects, excessive removal of the soft tissue surrounding the femoral neck and application of excessive torque during preparation of the femoral head, have been reported to be associated with inferior outcome in HR and must be addressed by the surgeon for every individual case [8, 28, 29, 46].
A potential disadvantage of CAS may be the additional time required for navigation during surgery [47]. In our study, we observed a non-significant median additional operative time of five minutes in the CAS group. However, the range in operative time was even higher for the conventional (67–162 minutes) than for the CAS group (79–145 min). The same trend—a six minute increase and less variation in operative time for the CAS group—was observed by Ganapathi et al. in the above-mentioned retrospective study with one of the surgeons being the same as in this study [17]. We therefore conclude that navigation of the femoral HR component in the hands of experienced surgeons is not associated with a relevant increase in operative time.
To the authors’ best knowledge, in contrast to other recent trials comparing the radiological outcome of navigated versus manually positioned femoral HR components [36, 37, 47–50], we were the first to investigate the effect of CAS on the clinical outcome. Regarding gain in function and quality of life at the six-month follow-up, WOMAC Osteoarthritis Index, EQ-5D and HHS levels did not differ statistically between the CAS and control groups. In line with this finding, convincing evidence for a favourable effect of navigation on patient-related outcome measures has not been reported in the literature so far. As pointed out above, these short-term data should therefore be confirmed by mid- to long-term observations including a large cohort to draw more reliable conclusions on the effect of femoral component navigation on the algofunctional outcome after HR.
Acknowledgments
This study was partly supported by Zimmer GmbH, Winterthur, Switzerland; grants were provided for staff resources in data management and statistical evaluation. The authors declare no further conflicts of interest. We are grateful to Stephan Kirschner, M.D. for surgical contribution and critical interpretation of the results and to Heike Voigt and Brit Brethfeld for assistance in data management and in coordination of the study (all of them Department of Orthopaedics, University Hospital Dresden). We furthermore thank Katharina Schaper (Institute of Medical Biometry and Epidemiology, Witten/Herdecke) for assistance in data clearing and statistical analysis implementation.
References
- 1.Prosser GH, Yates PJ, Wood DJ, Graves SE, de Steiger RN, Miller LN. Outcome of primary resurfacing hip replacement: evaluation of risk factors for early revision. Acta Orthop. 2010;81(1):66–71. doi: 10.3109/17453671003685434. [DOI] [PMC free article] [PubMed] [Google Scholar]
- 2.Corten K, MacDonald SJ. Hip resurfacing data from national joint registries: what do they tell us? What do they not tell us? Clin Orthop Relat Res. 2010;468(2):351–357. doi: 10.1007/s11999-009-1157-3. [DOI] [PMC free article] [PubMed] [Google Scholar]
- 3.Amstutz HC, Le Duff MJ, Campbell PA, Gruen TA, Wisk LE. Clinical and radiographic results of metal-on-metal hip resurfacing with a minimum ten-year follow-up. J Bone Joint Surg Am. 2010;92(16):2663–2671. doi: 10.2106/JBJS.I.01715. [DOI] [PubMed] [Google Scholar]
- 4.Amstutz HC, Campbell PA, Le Duff MJ. Fracture of the neck of the femur after surface arthroplasty of the hip. J Bone Joint Surg Am. 2004;86-A(9):1874–1877. doi: 10.2106/00004623-200409000-00003. [DOI] [PubMed] [Google Scholar]
- 5.Kim PR, Beaulé PE, Laflamme GY, Dunbar M. Causes of early failure in a multicenter clinical trial of hip resurfacing. J Arthroplasty. 2008;23(6 Suppl 1):44–49. doi: 10.1016/j.arth.2008.05.022. [DOI] [PubMed] [Google Scholar]
- 6.Vail TP, Glisson RR, Dominguez DE, Kitaoka K, Ottaviano D. Position of hip resurfacing component affects strain and resistance to fracture in the femoral neck. J Bone Joint Surg Am. 2008;90(9):1951–1960. doi: 10.2106/JBJS.F.00788. [DOI] [PubMed] [Google Scholar]
- 7.Ganapathi M, Evans S, Roberts P. Strain pattern following surface replacement of the hip. Proc Inst Mech Eng H. 2008;222(1):13–18. doi: 10.1243/09544119JEIM322. [DOI] [PubMed] [Google Scholar]
- 8.Shimmin AJ, Back D. Femoral neck fractures following Birmingham hip resurfacing: a national review of 50 cases. J Bone Joint Surg Br. 2005;87(4):463–464. doi: 10.1302/0301-620X.87B4.15498. [DOI] [PubMed] [Google Scholar]
- 9.Freeman MA (1978) Some anatomical and mechanical considerations relevant to the surface replacement of the femoral head. Clin Orthop Relat Res (134):19–24 [PubMed]
- 10.Beaulé PE, Lee JL, Le Duff MJ, Amstutz HC, Ebramzadeh E. Orientation of the femoral component in surface arthroplasty of the hip. A biomechanical and clinical analysis. J Bone Joint Surg Am. 2004;86-A(9):2015–2021. doi: 10.2106/00004623-200409000-00021. [DOI] [PubMed] [Google Scholar]
- 11.Little CP, Ruiz AL, Harding IJ, McLardy-Smith P, Gundle R, Murray DW, et al. Osteonecrosis in retrieved femoral heads after failed resurfacing arthroplasty of the hip. J Bone Joint Surg Br. 2005;87(3):320–323. doi: 10.1302/0301-620X.87B3.15330. [DOI] [PubMed] [Google Scholar]
- 12.Langton DJ, Joyce TJ, Jameson SS, Lord J, Van Orsouw M, Holland JP, et al. Adverse reaction to metal debris following hip resurfacing: the influence of component type, orientation and volumetric wear. J Bone Joint Surg Br. 2011;93(2):164–171. doi: 10.1302/0301-620X.93B2.25099. [DOI] [PubMed] [Google Scholar]
- 13.Hart AJ, Skinner JA, Henckel J, Sampson B, Gordon F. Insufficient acetabular version increases blood metal ion levels after metal-on-metal hip resurfacing. Clin Orthop Relat Res. 2011;469(9):2590–2597. doi: 10.1007/s11999-011-1930-y. [DOI] [PMC free article] [PubMed] [Google Scholar]
- 14.Brin YS, Nikolaou VS, Joseph L, Zukor DJ, Antoniou J. Imageless computer assisted versus conventional total knee replacement. A Bayesian meta-analysis of 23 comparative studies. Int Orthop. 2011;35(3):331–339. doi: 10.1007/s00264-010-1008-6. [DOI] [PMC free article] [PubMed] [Google Scholar]
- 15.Leenders T, Vandevelde D, Mahieu G, Nuyts R. Reduction in variability of acetabular cup abduction using computer assisted surgery: a prospective and randomized study. Comput Aided Surg. 2002;7(2):99–106. doi: 10.3109/10929080209146021. [DOI] [PubMed] [Google Scholar]
- 16.Ulrich SD, Bonutti PM, Seyler TM, Marker DR, Jones LC, Mont MA. Outcomes-based evaluations supporting computer-assisted surgery and minimally invasive surgery for total hip arthroplasty. Expert Rev Med Devices. 2007;4(6):873–883. doi: 10.1586/17434440.4.6.873. [DOI] [PubMed] [Google Scholar]
- 17.Ganapathi M, Vendittoli PA, Lavigne M, Günther KP. Femoral component positioning in hip resurfacing with and without navigation. Clin Orthop Relat Res. 2009;467(5):1341–1347. doi: 10.1007/s11999-008-0299-z. [DOI] [PMC free article] [PubMed] [Google Scholar]
- 18.Brooker AF, Bowerman JW, Robinson RA, Riley LH., Jr Ectopic ossification following total hip replacement. Incidence and a method of classification. J Bone Joint Surg Am. 1973;55(8):1629–1632. [PubMed] [Google Scholar]
- 19.Stucki G, Meier D, Stucki S, Michel BA, Tyndall AG, Dick W, et al. Evaluation of a German version of WOMAC (Western Ontario and McMaster Universities) Arthrosis Index. Z Rheumatol. 1996;55(1):40–49. [PubMed] [Google Scholar]
- 20.Bellamy N, Buchanan WW, Goldsmith CH, Campbell J, Stitt LW. Validation study of WOMAC: a health status instrument for measuring clinically important patient relevant outcomes to antirheumatic drug therapy in patients with osteoarthritis of the hip or knee. J Rheumatol. 1988;15(12):1833–1840. [PubMed] [Google Scholar]
- 21.Beaton DE, Schemitsch E (2003) Measures of health-related quality of life and physical function. Clin Orthop Relat Res (413):90–105 [DOI] [PubMed]
- 22.Ethgen O, Bruyère O, Richy F, Dardennes C, Reginster JY. Health-related quality of life in total hip and total knee arthroplasty. A qualitative and systematic review of the literature. J Bone Joint Surg Am. 2004;86-A(5):963–974. doi: 10.2106/00004623-200405000-00012. [DOI] [PubMed] [Google Scholar]
- 23.Sun Y, Stürmer T, Günther KP, Brenner H. Reliability and validity of clinical outcome measurements of osteoarthritis of the hip and knee–a review of the literature. Clin Rheumatol. 1997;16(2):185–198. doi: 10.1007/BF02247849. [DOI] [PubMed] [Google Scholar]
- 24.March L, Cross M, Tribe K, Lapsley H, Courtenay B, Brooks P. Cost of joint replacement surgery for osteoarthritis: the patients’ perspective. J Rheumatol. 2002;29(5):1006–1014. [PubMed] [Google Scholar]
- 25.Bachmeier CJ, March LM, Cross MJ, Lapsley HM, Tribe KL, Courtenay BG, et al. A comparison of outcomes in osteoarthritis patients undergoing total hip and knee replacement surgery. Osteoarthritis Cartilage. 2001;9(2):137–146. doi: 10.1053/joca.2000.0369. [DOI] [PubMed] [Google Scholar]
- 26.Harris WH. Traumatic arthritis of the hip after dislocation and acetabular fractures: treatment by mold arthroplasty. An end-result study using a new method of result evaluation. J Bone Joint Surg Am. 1969;51(4):737–755. [PubMed] [Google Scholar]
- 27.Saklad M. Grading of patients for surgical procedures. Anesthesiology. 1941;2:281–284. doi: 10.1097/00000542-194105000-00004. [DOI] [Google Scholar]
- 28.Amstutz HC, Beaulé PE, Dorey FJ, Le Duff MJ, Campbell PA, Gruen TA. Metal-on-metal hybrid surface arthroplasty: two to six-year follow-up study. J Bone Joint Surg Am. 2004;86-A(1):28–39. [PubMed] [Google Scholar]
- 29.Beaulé PE, Dorey FJ, LeDuff M, Gruen T, Amstutz HC (2004) Risk factors affecting outcome of metal-on-metal surface arthroplasty of the hip. Clin Orthop Relat Res (418):87–93 [PubMed]
- 30.Anglin C, Masri BA, Tonetti J, Hodgson AJ, Greidanus NV. Hip resurfacing femoral neck fracture influenced by valgus placement. Clin Orthop Relat Res. 2007;465:71–79. doi: 10.1097/BLO.0b013e318137a13f. [DOI] [PubMed] [Google Scholar]
- 31.Gautier E, Ganz K, Krügel N, Gill T, Ganz R. Anatomy of the medial femoral circumflex artery and its surgical implications. J Bone Joint Surg Br. 2000;82(5):679–683. doi: 10.1302/0301-620X.82B5.10426. [DOI] [PubMed] [Google Scholar]
- 32.Beaulé PE, Campbell PA, Hoke R, Dorey F. Notching of the femoral neck during resurfacing arthroplasty of the hip: a vascular study. J Bone Joint Surg Br. 2006;88(1):35–39. doi: 10.1302/0301-620X.88B1.16682. [DOI] [PubMed] [Google Scholar]
- 33.Beaulé PE, Amstutz HC. Orientation of the femoral component in surface arthroplasty of the hip. J Bone Joint Surg Am. 2005;87(5):1162. doi: 10.2106/00004623-200505000-00033. [DOI] [PubMed] [Google Scholar]
- 34.McMinn D, Daniel J. History and modern concepts in surface replacement. Proc Inst Mech Eng H. 2006;220(2):239–251. doi: 10.1243/095441105X68944. [DOI] [PubMed] [Google Scholar]
- 35.Davis ET, Olsen M, Zdero R, Waddell JP, Schemitsch EH. Femoral neck fracture following hip resurfacing: the effect of alignment of the femoral component. J Bone Joint Surg Br. 2008;90(11):1522–1527. doi: 10.1302/0301-620X.90B11.20068. [DOI] [PubMed] [Google Scholar]
- 36.Seyler TM, Lai LP, Sprinkle DI, Ward WG, Jinnah RH. Does computer-assisted surgery improve accuracy and decrease the learning curve in hip resurfacing? A radiographic analysis. J Bone Joint Surg Am. 2008;90(Suppl 3):71–80. doi: 10.2106/JBJS.H.00697. [DOI] [PubMed] [Google Scholar]
- 37.Gallart X, Fernández-Valencia JA, Riba J, Bori G, García S, Carrillo S. Alignment guided by computer navigation of the femoral component in hip resurfacing. Hip Int. 2010;20(Suppl 7 S7):43–47. doi: 10.1177/11207000100200s708. [DOI] [PubMed] [Google Scholar]
- 38.Hart R, Sváb P, Filan P. Intraoperative navigation in hip surface arthroplasty: a radiographic comparative analysis study. Arch Orthop Trauma Surg. 2008;128(4):429–434. doi: 10.1007/s00402-007-0540-3. [DOI] [PubMed] [Google Scholar]
- 39.Schnurr C, Nessler J, Koebke J, Michael JW, Eysel P, König DP. Imageless computer navigation of hip resurfacing arthroplasty. Oper Orthop Traumatol. 2010;22(3):307–316. doi: 10.1007/s00064-010-9023-8. [DOI] [PubMed] [Google Scholar]
- 40.Krüger S, Zambelli PY, Leyvraz PF, Jolles BM. Computer-assisted placement technique in hip resurfacing arthroplasty: improvement in accuracy? Int Orthop. 2009;33(1):27–33. doi: 10.1007/s00264-007-0440-8. [DOI] [PMC free article] [PubMed] [Google Scholar]
- 41.Langton DJ, Jameson SS, Joyce TJ, Hallab NJ, Natu S, Nargol AV. Early failure of metal-on-metal bearings in hip resurfacing and large-diameter total hip replacement: a consequence of excess wear. J Bone Joint Surg Br. 2010;92(1):38–46. doi: 10.1302/0301-620X.92B1.22770. [DOI] [PubMed] [Google Scholar]
- 42.Hartmann A, Lützner J, Kirschner S, Witzleb WC, Günther KP (2012) Do survival rate and serum ion concentrations 10 years after metal-on-metal hip resurfacing provide evidence for continued use? Clin Orthop Relat Res 470:3118–3126 [DOI] [PMC free article] [PubMed]
- 43.Leslie IJ, Williams S, Isaac G, Ingham E, Fisher J. High cup angle and microseparation increase the wear of hip surface replacements. Clin Orthop Relat Res. 2009;467(9):2259–2265. doi: 10.1007/s11999-009-0830-x. [DOI] [PMC free article] [PubMed] [Google Scholar]
- 44.De Haan R, Pattyn C, Gill HS, Murray DW, Campbell PA, De Smet K. Correlation between inclination of the acetabular component and metal ion levels in metal-on-metal hip resurfacing replacement. J Bone Joint Surg Br. 2008;90(10):1291–1297. doi: 10.1302/0301-620X.90B10.20533. [DOI] [PubMed] [Google Scholar]
- 45.Ybinger T, Kumpan W, Hoffart HE, Muschalik B, Bullmann W, Zweymüller K. Accuracy of navigation-assisted acetabular component positioning studied by computed tomography measurements: methods and results. J Arthroplasty. 2007;22(6):812–817. doi: 10.1016/j.arth.2006.10.001. [DOI] [PubMed] [Google Scholar]
- 46.Marker DR, Seyler TM, Jinnah RH, Delanois RE, Ulrich SD, Mont MA. Femoral neck fractures after metal-on-metal total hip resurfacing: a prospective cohort study. J Arthroplasty. 2007;22(7 Suppl 3):66–71. doi: 10.1016/j.arth.2007.05.017. [DOI] [PubMed] [Google Scholar]
- 47.Schnurr C, Michael JW, Eysel P, König DP. Imageless navigation of hip resurfacing arthroplasty increases the implant accuracy. Int Orthop. 2009;33(2):365–372. doi: 10.1007/s00264-007-0494-7. [DOI] [PMC free article] [PubMed] [Google Scholar]
- 48.Schnurr C, Münnich U, Eysel P, König DP. Computer-assisted joint replacement surgery. Versicherungsmedizin. 2010;62(1):16–19. [PubMed] [Google Scholar]
- 49.Olsen M, Schemitsch EH (2011) Avoiding short-term femoral neck fracture with imageless computer navigation for hip resurfacing. Clin Orthop Relat Res 469:1621–1626 [DOI] [PMC free article] [PubMed]
- 50.Resubal JR, Morgan DA. Computer-assisted vs conventional mechanical jig technique in hip resurfacing arthroplasty. J Arthroplasty. 2009;24(3):341–350. doi: 10.1016/j.arth.2007.12.013. [DOI] [PubMed] [Google Scholar]