Abstract
The overexpression of milligram quantities of protein remains a key bottleneck in membrane protein structural biology. A challenge of particular difficulty has been the overproduction of eukaryotic membrane proteins. In order to cope with the frequently poor expression levels associated with these challenging proteins, it is often necessary to screen a large number of homologues to find a well expressing clone. To facilitate this process using the heterologous, eukaryotic expression host Pichia pastoris, we have developed a simple fluorescent induction plate-screening assay that allows for the rapid detection of well expressing clones of eukaryotic membrane proteins that have been fused to GFP. Using a eukaryotic membrane protein known to express well in P. pastoris (human aquaporin 4) and homologues of the ER associated membrane protein phosphatidylethanolamine N-methyltransferase (PEMT), we demonstrate that when a large number of clones are screened, a small number of highly expressing “jackpot” clones can be isolated. A jackpot PEMT clone resulted in 5 mg/L yield after purification. The method allows for the facile simultaneous screening of hundreds of clones providing an alternate to in-culture screening and will greatly accelerate the search for overexpressing eukaryotic membrane proteins.
Keywords: membrane protein expression, GFP, structural genomics, Pichia pastoris
Introduction
Membrane proteins play vital roles in a wide variety of cellular processes, with an estimated 20–30% of prokaryotic and eukaryotic genomes coding for membrane proteins.1 In addition to the important physiological roles these proteins play in cellular biology, they also make an enormous impact in the area of human health, with disease arising from abnormalities in their function. Membrane proteins have thus become a critical target for pharmaceutical development with an estimated 50% of all current drugs being targeted to membrane proteins.2 Despite the obvious importance of these proteins for both biology and disease, relatively few X-ray crystals structures have been determined. In particular, there is a clear deficiency in the number of eukaryotic membrane protein structures available. There are many challenges and bottlenecks associated with membrane protein crystallography, and one of the greatest challenges is obtaining sufficient quantities of the protein for structural studies.3
Recombinant membrane proteins are frequently poorly expressed; for example, examination of the expression of over a hundred membrane proteins from Mycobacterium tuberculosis revealed that only 25% of the proteins tested were overexpressed, and that only 1/3 of these were properly inserted into the membrane.4 In order to bypass the high degree of failure associated with membrane protein overexpression, numerous groups have taken the approach of screening a large number of homologues in order to maximize the probability of obtaining sufficient protein for structural studies.5–10 One recent tool developed to facilitate screening of homologues for expression and stability, is addition of GFP to the C-terminus of the target protein.11 This technique has numerous advantages for expression screening, as it allows direct measurement of membrane protein expression by measuring in cell fluorescence; protein stability in detergents can be assessed using fluorescent size exclusion chromatography (FSEC), and correct protein localization using confocal microscopy.12,13 The technique of using GFP fusions for expression screening was initially developed for use in E. coli, but has since been adapted for use in eukaryotic expression systems, like that of the yeast Saccharomyces cerevisiae.14 The use of GFP fusions for expression screening has greatly accelerated the process of target selection for membrane protein structural biology and has already paid dividends in terms of novel membrane protein structures.15–17
The in vitro study of eukaryotic membrane proteins has been especially problematic, with the frequent requirement for a eukaryotic heterologous host for overexpression, including Sf9 insect cells, HEK cells, CHO cells, and yeasts such as Pichia pastoris and Saccharomyces cerevisiae. The yeast expression system Pichia pastoris has been successfully used to produce many eukaryotic membrane proteins for structural studies including; G-protein coupled receptors,18,19 ion channels,20,21 aquaporins22,23 and ABC transporters.24Pichia pastoris is an attractive system for membrane protein expression as it maintains many of the advantages associated with prokaryotic protein expression, including inexpensive media components; a simple drug based selection system (Zeocin), a strong inducible promoter (AOX1), simple genetics, high cell density and rapid growth.
Herein we report a simple method to identify well expressing eukaryotic membrane proteins in P. pastoris using a fluorescent-based induction plate assay. Human aquaporin 4 (AQP4) is known to express to high levels in P. pastoris (∼20 mg/L)23 and was thus used a positive control to demonstrate the validity of the plate screening assay for the identification of well expressing clones. The method was also applied to identify well expressing clones of three homologues of the membrane protein phosphatidylethanolamine N-methyltrasferase (PEMT). PEMT is predicted to have four transmembrane helices and localizes to the ER (Fig. 1). This enzyme plays an important role in the biosynthesis of phosphotidylcholine and is involved in lipid homeostasis.26 PEMT deficient mice are deficient in diet-induced obesity and atherosclerosis, suggesting PEMT is a crucial target for structural studies to facilitate inhibitor design.27,28
Figure 1.
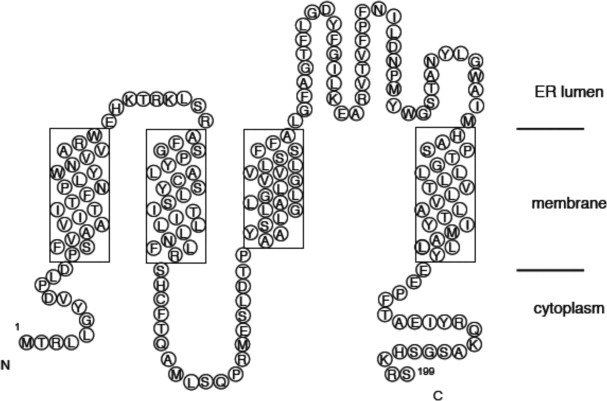
Membrane topology of the ER membrane protein phosphatidylethanolamine-N-methyltransferase (PEMT). Transmembrane helices were predicted using the TMHMM server.25
Human AQP4 and the PEMT homologues from human, mouse and yeast Saccharomyces cerevisiae were cloned as C-terminal GFP fusions. Making use of a simple fluorescent induction plate method, we demonstrate that the measured fluorescence on the induction plate correlates with protein expression, thus facilitating the rapid identification of high expressing clones. A well expressing clone of mouse PEMT was further targeted for large scale expression yielding ∼5 mg/L of fusion protein after purification.
Results
Induction plate based expression screening of human aquaporin 4 and PEMTs
Human AQP4 and PEMT homologues from mouse, human and yeast (Saccharomyces cerevisiae) were cloned as in-frame C-terminal GFP fusions to facilitate expression screening. The constructs were preceded by a Kozak consensus sequence (ACCATGG) and a FLAG tag epitope. The PEMT genes were linked to GFP-His8 by a tobacco etch virus (TEV) protease cut site, with a small peptide linker (GGGS). The constructs were then transformed into electrocompetent P. pastoris GS115, and the initial selection for genomic integration of the constructs was performed on YPDS plates containing the antibiotic Zeocin. Human AQP4 is known to express well in P. pastoris23 and was thus used a proof of principal that the method could be used to identify a well expressing clone. For AQP4, total of 50 clones of the transformation was chosen along with two untransformed GS115 negative controls and plated onto BMMY in order to induce protein expression directly on the plate. For the PEMT homologues, 48 clones were plates, along with two negative GS115 controls and two well expressing AQP4 clones as positive controls. The plates were imaged under blue light (Fig. 2), and the imaged plates clearly revealed a distribution of fluorescence related to protein expression, ranging from low (background level) to high. In order to quantify the observed expression distribution, the colony fluorescence was quantified using Mean Gray Values (MGV) (Fig. 3). Given that several clones gave essentially background expression (Figs. 2 and 3), the presence of genomic integration of the constructs was confirmed for each of the clones using a colony PCR (Supporting Information Fig. SI1).
Figure 2.
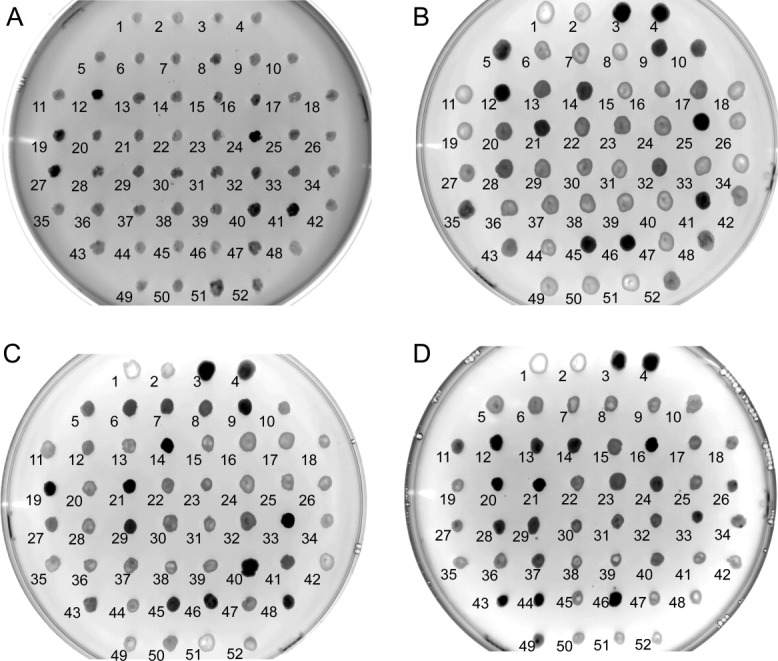
Induction plate expression screening. (A) AQP4, (B) human PEMT, (C) mouse PEMT, and (D) yeast PEMT (OPI3). Clones were spotted onto BMMY plates and incubated for 24 h at 30°C. P. pastoris GS115 was spotted onto position 1 and 2 as a negative control. Well expressing clones of AQP4 (clones 25, 42) were included as positive controls in positions 3 and 4 on plates B–D. Plates were imaged under blue light using an ImageQuant LAS 4000 with a 1/8th of a second exposure.
Figure 3.
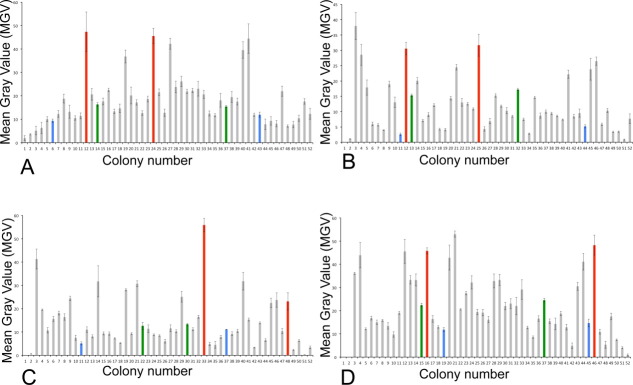
Quantification of plate screening by mean gray value (MGV). (A) AQP4, (B) human PEMT, (C) mouse PEMT, and (D) yeast PEMT (OPI3). Mean gray value was determined using ImageJ.29 Colored bars represent clones chosen for further characterization. Blue bars represent low expressing clones, green bars represent medium expressing clones, red bars represent high expressing clones.
Correlation of plate expression with liquid culture expression
In order to evaluate the reproducibility of the expression on the plate with that in liquid culture, two clones each of weak expressers, medium expressers and high expressers (Fig. 3) were chosen to be cultured in liquid media. The fluorescence was measured 24 hours post induction with methanol (Fig. 4), and small-scale lysis of the cultures was carried out for visualization of the total fusion protein through in-gel fluorescence (Fig. 5).
Figure 4.
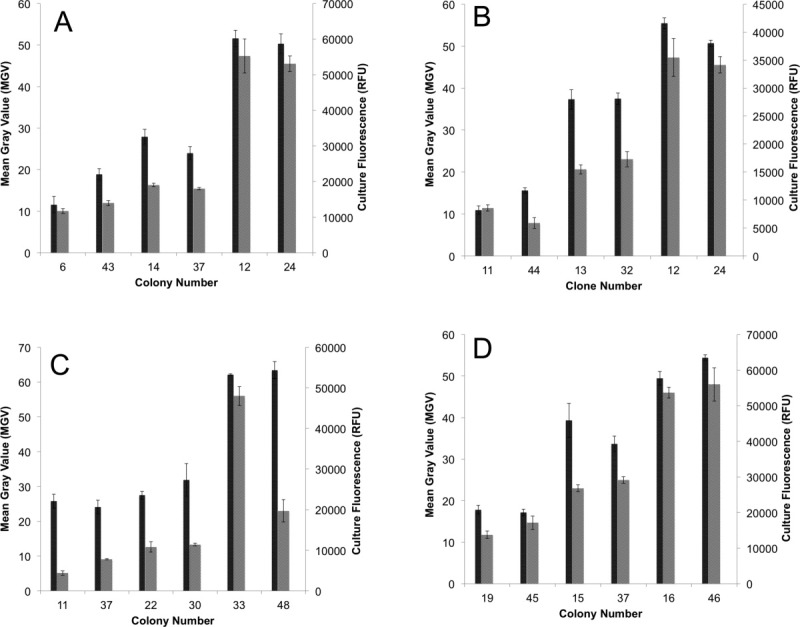
Correlation of expression measured from plate (MGV) with expression measured (right axis, gray bars) in liquid culture (right axis, black bars). (A) AQP4, (B) human PEMT, (C) mouse PEMT, and (D) yeast PEMT (OPI3). Error bars represent the standard error of the mean from three separate experiments.
Figure 5.
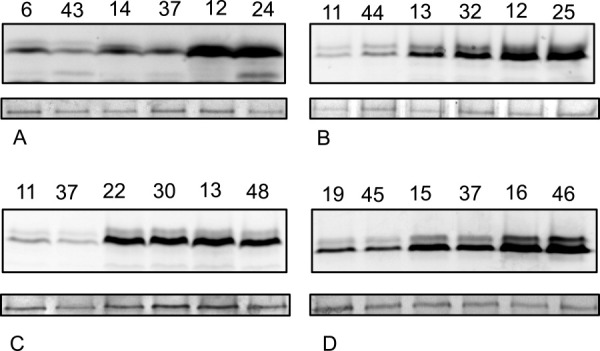
In gel fluorescence of PEMT lysates showing variable protein expression in different clones. (A) AQP4, (B) human PEMT, (C) mouse PEMT, and (D) yeast PEMT (OPI3). Equal amounts of protein were loaded; dihydroxy acetone kinase (DHK) was used as a loading control (bottom).
Both liquid culture fluorescence and total protein analysis shows a clear distribution of low, medium, and highly expressing clones (Figs. 2–4). This distribution correlates well with the MGV measurements of the initial induction plate colonies, validating this method as a rapid means of testing initial expression of GFP tagged membrane proteins in Pichia pastoris.
Expression and purification of mouse PEMT
In order to demonstrate that a clone identified by the plate screening method can be used to purify milligram quantities of a eukaryotic membrane protein, clone 48 of mouse PEMT (mPEMT) was selected for large-scale purification. The fusion protein was purified using Ni2+ affinity chromatography [Fig. 6(A)]. The fusion protein was cleaved using the TEV protease and further purified using FLAG tag resin [Fig. 6(B)]. The final protein purified mPEMT was ∼90% pure, the final yield of mPEMT-GFP fusion protein was ∼5 mg of per L of culture, and the yield of purified mPEMT after removal of the GFP tag was 2 mg per L of culture. The final purified protein eluted as a single monodisperse peak from gel filtration chromatography (Supporting Information Fig. SI2), an indication that the protein was not aggregated and is suitable for future crystallization trials.
Figure 6.
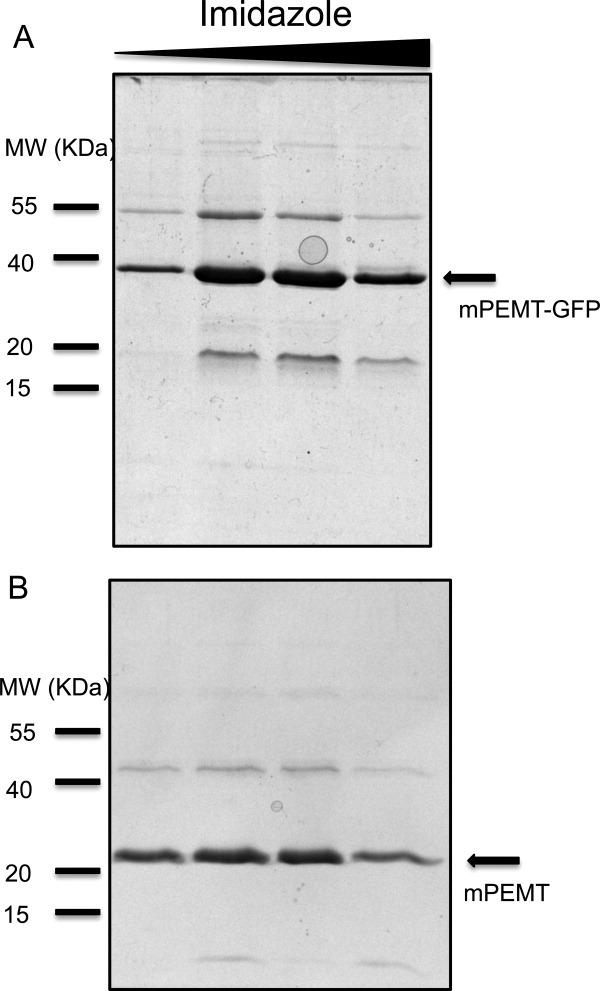
Coomassie stained SDS-PAGE of purified mPEMT. (A) Ni2+ affinity chromatography of mPEMT-GFP fusion protein, protein was eluted in a step imidazole gradient. (B) M2 FLAG resin affinity chromatography of mPEMT after TEV cleavage of the fusion protein. Protein eluted in pH 3.5 glycine buffer.
Discussion
Protein induction on a plate is indicative of overall expression levels
For the induction plate screening to be used for large-scale expression screening, it is important that the fluorescent measurements taken from the plate correlate well with protein expression in liquid culture. For both the control AQP4 and the PEMT homologues there is good correlation with the low, medium, and high expressers in both liquid culture fluorescence and the intensity of the PEMT-GFP fusion protein band on SDS-PAGE (Figs. 4 and 5). Interestingly, mouse PEMT deviates slightly from this observed correlation, with the medium expressers chosen giving relatively high expression in liquid culture [Clones 22 and 30, Fig. 4(b)]. This trend indicates that the plate screen is most effective at distinguishing between very high and very poor expressers, while the medium expressions could give inconsistent results in liquid culture growth. Thus, the screen is of greatest utility for rapidly identifying the highest expressing clones, while care must be taken in cases where highly variable expression on the plate is not observed.
Colony blot based screening procedures have been used successfully to find well expressing bacterial membrane proteins in E. coli,30 as well as soluble protein expression in E. coli31 permitting high throughput expression screening in bacteria. Despite the utility of such methods for protein expression screening, this is the first time such a method has been applied to expression screening of eukaryotic membrane proteins in a eukaryotic host.
Variable protein expression in Pichia pastoris
The typical strategy when expressing proteins in P. pastoris is to choose several clones (typically 5–10) to screen for expression, owing to variable expression of clones in P. pastoris. Examination of the plate expression data for the control AQP4 and the three homologues of PEMT (Fig. 3) indicates a wide variety of expression, ranging from essentially background expression to highly expressing clones (Fig. 3). An examination of the distribution of expression of the three PEMT homologues shows that only a small fraction of the clones express to relatively high levels, while a handful of clones (5–10 per plate) give essentially no protein expression (Fig. 3). Thus using conventional liquid culture-based screening approaches it may be necessary to screen 50–100 clones to find the best expressing clone, or if insufficient clones are chosen for screening, no well-expressing clone may be found. Given this highly variable protein expression observed in the Pichia clones, the induction plate based screening method is a highly efficient way of screening a very large number of clones for expression.
Interestingly, all of the clones tested for expression had successful genomic integration of the expression cassette (Fig. S1), thus differences in protein expression must be the result of other factors. During the integration of the expression cassette into the Pichia genome, there exists the possibility of multi-copy integration that occurs at a rate of 1–10%. It has been suggested that a general strategy for increasing protein expression in Pichia is to increase the gene dosage,32 although the effects of increasing gene dose are not always completely successful at increasing protein yields.33 There has been only a single systematic study examining the effect of gene dose in membrane protein expression, where the effect of increasing gene dose increased the expression recombinant aquaporins.34 In addition to the possible expression variation owing to multi-copy genomic integration of different clones, it has also been suggested that differences in the unfolded protein response (UPR) may contribute to increased protein expression in both P. pastoris and S. cerevisiae.35
Induction plate screening permits rapid assessment of expression
A critical variable for success in membrane protein structural biology is the generation of a sufficient quantity of protein for structural studies.3 There have been numerous strategies suggested to maximize the possibility of obtaining highly expressing clones. For example, screening of homologues for high level expression and crystallizability has been successful in many examples.5–10 Given the variable protein expression between clones, homologue screening in Pichia would become a very laborious process, requiring perhaps hundreds of individual clones to be screened for expression. In addition to homologue screening, other approaches including truncations, codon optimization, coexpression with chaperones, and gene dosage could all be assessed in a rapid and efficient manner using the method established here. Given that AQP4, a protein known to express well in P. pastoris and the very different class of PEMT protein exhibit identical trends in the plate screening assay it could be generally applied for the identification of well expression membrane proteins of a variety of types. Furthermore the correlation between plate fluorescence, liquid culture fluorescence and protein expression suggests that the plate screen can be used without further testing in liquid culture to identify potential clones for high-level expression. We have used this simple screen to identify express and purify to milligram quantities a PEMT homologue. Rapid plate based expression screening has the potential to simplify and accelerate the search for well expressing eukaryotic membrane proteins.
Materials and Methods
Construction of GFP fusion vector and cloning of PEMTs
A red shifted variant of enhanced GFP containing the mutations F64L and S65T (eGFP) was amplified from pEGFP-N1 (Clontech). To the C-terminus an 8x His-tag was added, and to the N-terminus a tobacco etch virus protease (TEV) cut site and a four amino acid linker sequence was added. The PCR product was then ligated into pPICZ-A (Invitrogen). Genes (cDNA) for human, and mouse PEMT were a kind gift of Dennis Vance (University of Alberta) and Saccharomyces cerevisiae PEMT (OPI3) were obtained from the Protein Structure Initiative materials repository.36 The genes were amplified using PCR and cloned into pPICZA-GFP.
Transformation of Pichia pastoris
Plasmids containing the PEMT gene were purified using maxi-prep kits (Qiagen), and 20 μg of DNA was linearized overnight at 37°C with SacI (Fermentas, USA). Electrocompetent P. pastoris GS115 were prepared following the protocol outlined in the Pichia EasySelect™ Expression kit (Invitrogen, USA). Linearized plasmid DNA was incubated with 80 μL of electrocompetent GS115 on ice and electroporated using a BioRad Gene Pulser at 2.5 KV, 25 μF, 100 Ω. Cells were plated on YPDS (1% yeast extract, 2% peptone, 2% dextrose, 1M sorbitol) media containing 100 μg/mL zeocin, and incubated at 30°C until colonies appeared (approximately 2 days).
PCR screening for insert
To confirm genomic integration of the expression cassettes, individual colonies were picked into 10 μL of sterile water. To lyse the cells, 5 μL of 5 U/μL of lyticase (SIGMA, USA) was added and the cells were incubated at 30°C for 10 min, followed by freeze-thaw from −80°C to RT. A hot start PCR was set up using TopTaq (Qiagen, USA). Briefly, 50 μL PCR reactions contained 5 μL 10 X TopTaq buffer, 2.5 μL 10 mM dNTPs, 0.5 μL 25 mM Mg2+, 1 μL of 10 mM forward and reverse primers 5 μL of cell lysate, and 30 μL of sterile water. PCR samples were mixed thoroughly and placed in Eppendorf thermocycler at 95°C for 5 min before 5 μL of 0.16 U/μL TopTaq polymerase was added. PCR cycled 30 X with a 1 min 95°C denaturation, 1 min 54°C annealing stage and 1 min 72°C elongation. Samples were run on a 1% agarose gel with 1% ethidium bromide.
Induction plating and imaging of PEMTs
Following the appearance of colonies on YPDS-zeocin plates, a total of 50 colonies from each transformation were picked onto BMMY plates (1% yeast extract, 2% peptone 100 mM potassium phosphate buffer pH 6.0, 1.34% YNB (yeast nitrogen base) 4 × 10⁻⁵M biotin, 0.5% methanol) using a grid. As a negative control, two colonies of untransformed GS115 were also picked. Plates were incubated at 30°C for 24 h and imaged using an ImageQuant LAS4000 imager equipped with blue light (GE healthcare, USA). All exposures were taken at 1/8th of a second. In order to quantify the intensity of the colonies, the mean gray value was determined using ImageJ software.29
Culture fluorescence, small scale lysis and protein expression
Colonies were inoculated into 5 mL of BMGY (1% yeast extract, 2% peptone 100 mM potassium phosphate buffer pH 6.0, 1.34% YNB 4 × 10⁻⁵M biotin, 1% glycerol) and grown overnight at 30°C at 300 RPM. Cultures were sub-inoculated into 25 mL of BMGY with a starting OD600 of 0.02 and grown for 24 h at 30°C at 300 RPM. When the cells had reached at OD600 of ∼7, they were spun down (1500g, 5 min) and induced by resuspension of the cell pellet in 25 mL of BMMY media and incubated for 24 h at 24°C at 300 RPM. In order to measure cell fluorescence, 5 mL of the cells were spun down (1500g, 5 min) and resuspended in 200 μL of PBS in a 96-well plate (Costar, USA). Fluorescence was measured using a FluoroSTAR fluorescent plate reader using an excitation wavelength of 488 nm and emission wavelength of 509 nm with a gain of 800.
To correlate fluorescent measurements with protein expression, the remaining 20 mL of culture were harvested by centrifugation (1500g, 5 min) and resuspended in 50 mM KPO4 Buffer, 0.3M NaCl, 10% glycerol, pH 8.0 so that the final OD600 was 150. About 100 μL aliquots were taken from the resuspended cells and lyticase was added to a final concentration of 2 U/μL and incubated for 30 min at 30°C. The cells were then flash frozen in liquid nitrogen for 2 min, followed by heat shocking at 30°C, the freeze thaw was repeated twice more, and insoluble material and unbroken cells were removed by centrifugation. The lysate was run on a 14% SDS PAGE gel and imaged using blue light on an ImageQuant LAS4000 (GE healthcare, USA).
Expression and purification of mPEMT
Clone 48 of mPEMT was grown overnight (30°C, 300 RPM) in 100 mL of BMGY media to a OD600 of 7. A total of 6 L of culture was sub-inoculated into BMGY and grown for 24 h (30°C, 300 RPM) to a OD600 of 10. The cells was harvested by centrifugation (1500g, 10 min) and resuspended in an equal volume of BMMY induction media. The cultures were grown for 48 h (25°C, 300 RPM), adding fresh methanol at 24 h (0.5%). The cells were harvested by centrifugation (1500g, 10 min) and resuspended in 300 mL of 50 mM Tris pH8.0, 0.15M NaCl, 5% glycerol and lysed by passage through a Constant Systems cell disruptor at 40,000 PSI. Cell debris was pelleted by centrifugation (3000g, 10 min) and membranes were isolated by ultracentrifugation (100,000g, 2 h). Membranes were homogenized in 50 mM Tris pH 8.0, 0.15 M NaCl, 5% glycerol, and solubilized in 1% Fos-choline-12. Insoluble material was pelleted (100,000g, 30 min) and the supernatant batch bound to Ni-NTA agarose (Qiagen) for 2 h at 4°C and washed and eluted using a step imidazole gradient in 0.1% Fos-choline-12. The purified fusion protein was digested using TEV protease with a 1:1 w/w ratio. mPEMT was purified from GFP and TEV using M2 FLAG tag resin (Sigma) according to the manufacturer's instructions. The final purified protein was injected onto a Superdex 200 16/60 column equilibrated in 20 mM Tris pH 8.0, 0.15 M NaCl, 5% glycerol, 0.15% FC-12 to ensure that the protein was not aggregated (Supporting Information Fig. SI2).
Acknowledgments
We thank Dr. Dennis Vance for his kind gift of the human and mouse PEMT genes. We also thank all members of the Lemieux lab as well as Teresa and Penny Brooks for advice and reading the manuscript. This work has been supported by the Canadian Institute for Health Research (CIHR) and Alberta Innovates Health Solutions (AIHS). Infrastructure used in this work was funded by Canadian Foundation for Innovation. CLB is supported by CIHR and AIHS fellowships. M. Joanne Lemieux acknowledges support from the Canada Research Chairs Program, AIHS Scholar program and Parkinson's Society Canada New Investigator.
Supplementary material
Additional Supporting Information may be found in the online version of this article.
Supporting Information Figure 1. PCR screen to ensure genomic integration of expression cassette for human PEMT (A), mouse PEMT (B) and yeast PEMT (OPI3) (C). Lane numbers refer to colony number picked from plates in Fig 2. Positions 1 and 2 are negative controls (untransformed GS115).
Supporting Information Figure 2. Size exclusion chromatography of purified mPEMT injected onto a Superdex 200 16/160 column equilibrated in 20 mM Tris pH 8.0, 0.15M NaCl, 5% glycerol, 0.15% FC-12. The protein eluted as a single monodisperse peak with minimal aggregation. Elution for standard proteins: 1. Thyroglobulin 50.7ml (MW, 670kDa; Stokes radius 85 Å); 2. γ-globulin 66.8ml (MW 158kDa; Stokes radius 52.9 Å); 3. Ovalbumin 66.8ml (MW 44kDa; Stokes radius 30.5 Å); 4. myoglobin 93.4ml (MW 17kDa, Stokes radius 20.7 Å); 5. vitamin B12 100.7ml (MW 1.3kDa, Stokes radius 1.6 Å).
REFERENCES
- 1.Liu J, Rost B. Comparing function and structure between entire proteomes. Protein Sci. 2001;10:1970–1979. doi: 10.1110/ps.10101. [DOI] [PMC free article] [PubMed] [Google Scholar]
- 2.Sanders CR, Myers JK. Disease-related misassembly of membrane proteins. Annu Rev Biophys Biomol Struct. 2004;33:25–51. doi: 10.1146/annurev.biophys.33.110502.140348. [DOI] [PubMed] [Google Scholar]
- 3.Bill RM, Henderson PJ, Iwata S, Kunji ER, Michel H, Neutze R, Newstead S, Poolman B, Tate CG, Vogel H. Overcoming barriers to membrane protein structure determination. Nat Biotechnol. 2011;29:335–340. doi: 10.1038/nbt.1833. [DOI] [PubMed] [Google Scholar]
- 4.Korepanova A, Gao FP, Hua Y, Qin H, Nakamoto RK, Cross TA. Cloning and expression of multiple integral membrane proteins from Mycobacterium tuberculosis in Escherichia coli. Protein Sci. 2005;14:148–158. doi: 10.1110/ps.041022305. [DOI] [PMC free article] [PubMed] [Google Scholar]
- 5.Kawate T, Michel JC, Birdsong WT, Gouaux E. Crystal structure of the ATP-gated P2X(4) ion channel in the closed state. Nature. 2009;460:592–598. doi: 10.1038/nature08198. [DOI] [PMC free article] [PubMed] [Google Scholar]
- 6.Chen YH, Hu L, Punta M, Bruni R, Hillerich B, Kloss B, Rost B, Love J, Siegelbaum SA, Hendrickson WA. Homologue structure of the SLAC1 anion channel for closing stomata in leaves. Nature. 2010;467:1074–1080. doi: 10.1038/nature09487. [DOI] [PMC free article] [PubMed] [Google Scholar]
- 7.Hu J, Xue Y, Lee S, Ha Y. The crystal structure of GXGD membrane protease FlaK. Nature. 2011;475:528–531. doi: 10.1038/nature10218. [DOI] [PMC free article] [PubMed] [Google Scholar]
- 8.Cao Y, Jin X, Huang H, Derebe MG, Levin EJ, Kabaleeswaran V, Pan Y, Punta M, Love J, Weng J, Quick M, Ye S, Kloss B, Bruni R, Martinez-Hackert E, Hendrickson WA, Rost B, Javitch JA, Rajashankar KR, Jiang Y, Zhou M. Crystal structure of a potassium ion transporter, TrkH. Nature. 2011;471:336–340. doi: 10.1038/nature09731. [DOI] [PMC free article] [PubMed] [Google Scholar]
- 9.Hu J, Xue Y, Lee S, Ha Y. The crystal structure of GXGD membrane protease FlaK. Nature. 2011;475:528–U130. doi: 10.1038/nature10218. [DOI] [PMC free article] [PubMed] [Google Scholar]
- 10.Chang G, Spencer RH, Lee AT, Barclay MT, Rees DC. Structure of the MscL homolog from Mycobacterium tuberculosis: a gated mechanosensitive ion channel. Science. 1998;282:2220–2226. doi: 10.1126/science.282.5397.2220. [DOI] [PubMed] [Google Scholar]
- 11.Drew DE, von Heijne G, Nordlund P, de Gier JWL. Green fluorescent protein as an indicator to monitor membrane protein overexpression in Escherichia coli. FEBS Lett. 2001;507:220–224. doi: 10.1016/s0014-5793(01)02980-5. [DOI] [PubMed] [Google Scholar]
- 12.Drew D, Slotboom DJ, Friso G, Reda T, Genevaux P, Rapp M, Meindl-Beinker NM, Lambert W, Lerch M, Daley DO, Van Wijk KJ, Hirst J, Kunji E, De Gier JW. A scalable, GFP-based pipeline for membrane protein overexpression screening and purification. Protein Sci. 2005;14:2011–2017. doi: 10.1110/ps.051466205. [DOI] [PMC free article] [PubMed] [Google Scholar]
- 13.Kawate T, Gouaux E. Fluorescence-detection size-exclusion chromatography for precrystallization screening of integral membrane proteins. Structure. 2006;14:673–681. doi: 10.1016/j.str.2006.01.013. [DOI] [PubMed] [Google Scholar]
- 14.Drew D, Newstead S, Sonoda Y, Kim H, von Heijne G, Iwata S. GFP-based optimization scheme for the overexpression and purification of eukaryotic membrane proteins in Saccharomyces cerevisiae. Nat Protoc. 2008;3:784–798. doi: 10.1038/nprot.2008.44. [DOI] [PMC free article] [PubMed] [Google Scholar]
- 15.Solcan N, Kwok J, Fowler PW, Cameron AD, Drew D, Iwata S, Newstead S. Alternating access mechanism in the POT family of oligopeptide transporters. EMBO J. 2012;31:3411–3421. doi: 10.1038/emboj.2012.157. [DOI] [PMC free article] [PubMed] [Google Scholar]
- 16.Hu NJ, Iwata S, Cameron AD, Drew D. Crystal structure of a bacterial homologue of the bile acid sodium symporter ASBT. Nature. 2011;478:408–411. doi: 10.1038/nature10450. [DOI] [PMC free article] [PubMed] [Google Scholar]
- 17.Newstead S, Drew D, Cameron AD, Postis VL, Xia X, Fowler PW, Ingram JC, Carpenter EP, Sansom MS, McPherson MJ, Baldwin SA, Iwata S. Crystal structure of a prokaryotic homologue of the mammalian oligopeptide-proton symporters, PepT1 and PepT2. EMBO J. 2011;30:417–426. doi: 10.1038/emboj.2010.309. [DOI] [PMC free article] [PubMed] [Google Scholar]
- 18.Hino T, Arakawa T, Iwanari H, Yurugi-Kobayashi T, Ikeda-Suno C, Nakada-Nakura Y, Kusano-Arai O, Weyand S, Shimamura T, Nomura N, Cameron AD, Kobayashi T, Hamakubo T, Iwata S, Murata T. G-protein-coupled receptor inactivation by an allosteric inverse-agonist antibody. Nature. 2012;482:237–240. doi: 10.1038/nature10750. [DOI] [PMC free article] [PubMed] [Google Scholar]
- 19.Shimamura T, Shiroishi M, Weyand S, Tsujimoto H, Winter G, Katritch V, Abagyan R, Cherezov V, Liu W, Han GW, Kobayashi T, Stevens RC, Iwata S. Structure of the human histamine H1 receptor complex with doxepin. Nature. 2011;475:65–70. doi: 10.1038/nature10236. [DOI] [PMC free article] [PubMed] [Google Scholar]
- 20.Miller AN, Long SB. Crystal structure of the human two-pore domain potassium channel K2P1. Science. 2012;335:432–436. doi: 10.1126/science.1213274. [DOI] [PubMed] [Google Scholar]
- 21.Long SB, Campbell EB, Mackinnon R. Crystal structure of a mammalian voltage-dependent Shaker family K+ channel. Science. 2005;309:897–903. doi: 10.1126/science.1116269. [DOI] [PubMed] [Google Scholar]
- 22.Tornroth-Horsefield S, Wang Y, Hedfalk K, Johanson U, Karlsson M, Tajkhorshid E, Neutze R, Kjellbom P. Structural mechanism of plant aquaporin gating. Nature. 2006;439:688–694. doi: 10.1038/nature04316. [DOI] [PubMed] [Google Scholar]
- 23.Ho JD, Yeh R, Sandstrom A, Chorny I, Harries WE, Robbins RA, Miercke LJ, Stroud RM. Crystal structure of human aquaporin 4 at 1.8 A and its mechanism of conductance. Proc Natl Acad Sci USA. 2009;106:7437–7442. doi: 10.1073/pnas.0902725106. [DOI] [PMC free article] [PubMed] [Google Scholar]
- 24.Aller SG, Yu J, Ward A, Weng Y, Chittaboina S, Zhuo R, Harrell PM, Trinh YT, Zhang Q, Urbatsch IL, Chang G. Structure of P-glycoprotein reveals a molecular basis for poly-specific drug binding. Science. 2009;323:1718–1722. doi: 10.1126/science.1168750. [DOI] [PMC free article] [PubMed] [Google Scholar]
- 25.Krogh A, Larsson B, von Heijne G, Sonnhammer ELL. Predicting transmembrane protein topology with a hidden Markov model: application to complete genomes. J Mol Biol. 2001;305:567–580. doi: 10.1006/jmbi.2000.4315. [DOI] [PubMed] [Google Scholar]
- 26.Li Z, Vance DE. Phosphatidylcholine and choline homeostasis. J Lipid Res. 2008;49:1187–1194. doi: 10.1194/jlr.R700019-JLR200. [DOI] [PubMed] [Google Scholar]
- 27.Jacobs RL, Zhao Y, Koonen DP, Sletten T, Su B, Lingrell S, Cao G, Peake DA, Kuo MS, Proctor SD, Kennedy BP, Dyck JR, Vance DE. Impaired de novo choline synthesis explains why phosphatidylethanolamine N-methyltransferase-deficient mice are protected from diet-induced obesity. J Biol Chem. 2010;285:22403–22413. doi: 10.1074/jbc.M110.108514. [DOI] [PMC free article] [PubMed] [Google Scholar]
- 28.Cole LK, Dolinsky VW, Dyck JR, Vance DE. Impaired phosphatidylcholine biosynthesis reduces atherosclerosis and prevents lipotoxic cardiac dysfunction in ApoE-/- mice. Circ Res. 2011;108:686–694. doi: 10.1161/CIRCRESAHA.110.238691. [DOI] [PubMed] [Google Scholar]
- 29.Abramoff MD, Magalhaes PJ, Ram SJ. Image processing with ImageJ. Biophoton Intl. 2004;11:36–42. [Google Scholar]
- 30.Lemieux MJ, Song J, Kim MJ, Huang Y, Villa A, Auer M, Li XD, Wang DN. Three-dimensional crystallization of the Escherichia coli glycerol-3-phosphate transporter: a member of the major facilitator superfamily. Protein Sci. 2003;12:2748–2756. doi: 10.1110/ps.03276603. [DOI] [PMC free article] [PubMed] [Google Scholar]
- 31.Cornvik T, Dahlroth SL, Magnusdottir A, Herman MD, Knaust R, Ekberg M, Nordlund P. Colony filtration blot: a new screening method for soluble protein expression in Escherichia coli. Nat Methods. 2005;2:507–509. doi: 10.1038/nmeth767. [DOI] [PubMed] [Google Scholar]
- 32.Clare JJ, Rayment FB, Ballantine SP, Sreekrishna K, Romanos MA. High-level expression of tetanus toxin fragment C in Pichia pastoris strains containing multiple tandem integrations of the gene. Biotechnology. 1991;9:455–460. doi: 10.1038/nbt0591-455. [DOI] [PubMed] [Google Scholar]
- 33.Hohenblum H, Gasser B, Maurer M, Borth N, Mattanovich D. Effects of gene dosage, promoters, and substrates on unfolded protein stress of recombinant Pichia pastoris. Biotechnol Bioeng. 2004;85:367–375. doi: 10.1002/bit.10904. [DOI] [PubMed] [Google Scholar]
- 34.Norden K, Agemark M, Danielson JA, Alexandersson E, Kjellbom P, Johanson U. Increasing gene dosage greatly enhances recombinant expression of aquaporins in Pichia pastoris. BMC Biotechnol. 2011;11:47. doi: 10.1186/1472-6750-11-47. [DOI] [PMC free article] [PubMed] [Google Scholar]
- 35.Guerfal M, Ryckaert S, Jacobs PP, Ameloot P, Van Craenenbroeck K, Derycke R, Callewaert N. The HAC1 gene from Pichia pastoris: characterization and effect of its overexpression on the production of secreted, surface displayed and membrane proteins. Microb Cell Fact. 2010;9:49. doi: 10.1186/1475-2859-9-49. [DOI] [PMC free article] [PubMed] [Google Scholar]
- 36.Cormier CY, Mohr SE, Zuo D, Hu Y, Rolfs A, Kramer J, Taycher E, Kelley F, Fiacco M, Turnbull G, LaBaer J. Protein structure initiative material repository: an open shared public resource of structural genomics plasmids for the biological community. Nucleic Acids Res. 2010;38:D743–D749. doi: 10.1093/nar/gkp999. [DOI] [PMC free article] [PubMed] [Google Scholar]
Associated Data
This section collects any data citations, data availability statements, or supplementary materials included in this article.


