Abstract
Objectives
Insecticides reduce vector-borne pathogen transmission but also pose health risks. In August 2005, Sacramento County, California, underwent emergency aerial ultralow-volume (ULV) application of pyrethrin insecticide to reduce the population of West Nile virus (WNV)-infected mosquitoes and thereby interrupt enzootic and tangential transmission. We assessed the association between aerially applied pyrethrin insecticide and patterns of emergency department (ED) visit diagnoses.
Methods
We used geographic information systems software to determine ZIP Code-level exposure to pyrethrin. We used logistic regression models to examine the relationship between exposure status and three-digit International Classification of Diseases, Ninth Edition, Clinical Modification (ICD-9-CM) codes (785 in total) for all ED visits (n=253,648) within Sacramento County in 2005 and for specific diagnostic clusters (e.g., respiratory, gastrointestinal, skin, eye, and neurologic). All models were adjusted for age, gender, race/ethnicity (individual level), median income, ozone, and temperature (ZIP Code level).
Results
Exposure to aerially applied insecticide was not associated with clusters of respiratory, gastrointestinal, skin, eye, and neurologic complaints in adjusted models but was inversely associated with ICD-9-CM code 799 (“other ill-defined morbidity and mortality”), with adjusted odds ratios (AORs) ranging from 0.31 to 0.36 for 0–3 lag days (95% confidence interval 0.17, 0.68). Spraying was also directly associated with ICD-9-CM code 553 (“other abdominal hernia”), with AORs ranging from 2.34 to 2.96 for 2–3 lag days.
Conclusions
The observed significant ICD-9-CM code associations likely represented chance findings. Aerial ULV pyrethrin applications were not associated with ED visits for specific diagnoses or clusters of diagnoses.
Insecticides play an important role in public health protection as part of a sustainable integrated mosquito management system. Integrated mosquito management programs begin with surveillance of mosquito activity and mosquito-borne disease activity and include strategies such as reducing breeding sites, conducting community outreach and public education programs, and employing chemical control of juvenile (larvae) and adult mosquitoes.1,2 Adulticiding programs (i.e., killing adult mosquitoes) have become the method of choice when mosquito populations are extreme or when outbreaks of serious diseases, such as West Nile virus (WNV), occur.1 Using public health insecticides safely has long been important to control programs on the international (e.g., World Health Organization), national (e.g., Centers for Disease Control and Prevention and Environmental Protection Agency), and local (e.g., departments of public health and mosquito abatement agencies) public health agency levels. With the 1999 arrival of WNV in the United States and increased efforts to control vector mosquitoes, insecticide safety questions were expressed by the public3,4 that incited debates about the risk-to-benefit ratio for aerial insecticide applications vs. preventing WNV infection and disease.5
The benefits derived from aerial pyrethrin insecticide applications for WNV include a quick and widespread reduction in the mosquito population,6 leading to an interruption of transmission by infected mosquitoes within the enzootic avian-mosquito cycle and a decrease in the number of new human cases of WNV, a potentially fatal illness.7 Pyrethrin insecticides, however, are known to pose risks to human health ranging from skin and eye irritation to respiratory and gastrointestinal (GI) disturbances, as well as more vague systemic complaints such as lethargy, fatigue, and dizziness.8,9 Studies performed in New York City at the start of the WNV epidemic found no evidence of asthma exacerbation after insecticide spraying,10,11 but the studies did not examine other potential health effects. In addition, these studies were relatively small, focused on ground-level rather than aerial spraying, and analyzed pyrethroid spraying, a synthetic insecticide related to pyrethrin that is more stable in sunlight.12
In August 2005, Sacramento County, California, had the greatest number of human cases of WNV in the U.S.13,14 In response, the Sacramento-Yolo Mosquito and Vector Control District (SYMVCD) applied an ultralow-volume (ULV) formulation of pyrethrin insecticide (Evergreen EC 60-6: 6% pyrethrin insecticide, 60% piperonylbutoxide; MGK, Minneapolis, Minnesota) at 0.003 kilogram/hectare (0.0025 pound/acre) over 218 square kilometers (km2) in north Sacramento on August 8, 9, and 10, 2005, and 243.5 km2 in south Sacramento on August 11, 20, 21, and 22, 2005, as previously described.5 These emergency measures were taken to quickly reduce the infected mosquito population for the duration of the viremia period in infected birds and, thereby, interrupt both enzootic and tangential transmission. This aerial application of insecticides over a large urban area led to objections by residents, activist groups, and politicians15 in California because of the concern for potential health problems resulting from the insecticide exposure.
In this study, we addressed the question of acute or short-term “risk” (reflected in increased emergency department [ED] visits) to human health when pyrethrin insecticides are sprayed aerially for WNV mosquito control. We examined whether specific diagnostic codes (e.g., respiratory, GI, skin, eye, and neurologic) were more likely in sprayed areas on spray days and lag days (i.e., the number of days between insecticide exposure and visiting an ED) than in those same areas on non-spray days and in non-spray areas on both spray and non-spray days. Because the known and possible effects of pyrethrin insecticides are diverse, we also evaluated other potential acute adverse effects as evidenced by any association between ED visits for 785 diagnostic categories and spray exposure.
METHODS
Patient data
We obtained 2005 ED visit data for Sacramento County from the Office of Statewide Health Planning and Development (OSHPD). Since January 2005, the California Health and Safety Code §12873616 has required emergency care data records to be reported to OSHPD, resulting in virtually complete data for nongovernmental (i.e., excluding Veterans Hospitals) ED visits. This restricted-use database contains each patient's ZIP Code of residence as the smallest available spatial variable.
Insecticide exposure estimation
We used ArcGIS® version 9.3.117 geographic information systems (GIS) software to determine aerial pyrethrin insecticide exposure status for all Sacramento County citizens by their residential ZIP Code. The SYMVCD provided georeferenced data documenting the times and locations of the aerial spray swaths over Sacramento County.
We assumed that most county residents were in their homes during the spray periods because (1) there was significant publicity about the mosquito-adulticiding program requesting that residents stay indoors and (2) the flights were scheduled from 8 p.m. to 12 a.m., a period when the mosquito vectors species (Culex [Cx.] pipiens and Cx. tarsalis) are most active18,19 and when most people are indoors at home.
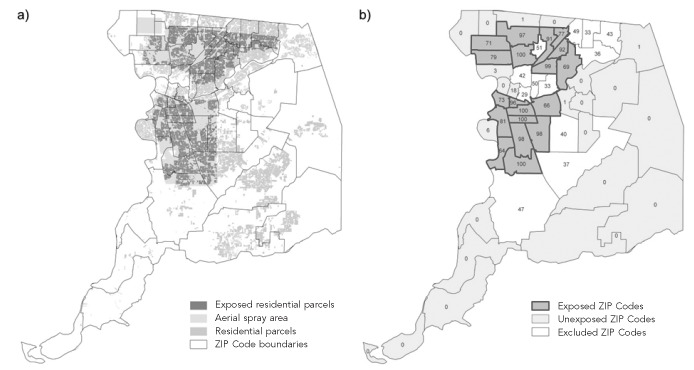
We employed dasymetric modeling to calculate pyrethrin insecticide exposure. Dasymetric modeling is a spatial technique used to separate aggregated data to account for the lack of homogeneity in the spatial distribution of those data.20 Because population density varies within ZIP Codes, dasymetric mapping allowed us to adjust for the uneven distribution of exposed populations within ZIP Codes by overlaying ZIP Codes with residential parcel data (Sacramento County GIS Data Library21) to account for only the populated areas. Redistributing the population in this way improved the estimation of exposure to aerially sprayed insecticides by deriving a percentage of a ZIP Code's residential areas that were exposed (Figure, map “a”). We created a dichotomous exposure variable based on both natural breaks in the data and expert opinions of the authors (Figure, map “b”), whereby if 64%–100% of the population in a ZIP Code was included in a sprayed area, that ZIP Code would be considered “exposed,” and if 0%–18% of the population in a ZIP Code was included in a sprayed area, that ZIP Code would be considered “unexposed.” Our analyses excluded ZIP Codes with an intermediate proportion of residences exposed (19%–63%) to maximize the distinction between exposed and unexposed areas. Of the 52 Sacramento County ZIP Codes that existed in 2005, 12 ZIP Codes (23%) were excluded (comprising 78,574 or 23.7% of ED visits).
Figure.
Sacramento County, California, aerial pyrethrin insecticide exposure during the August 2005 West Nile virus outbreaka
aMap “a” shows the aerial spray area (light gray) overlaid on Sacramento County ZIP Codes. Medium gray areas show the residential parcels in the county and dark gray areas indicate those residential parcels within the aerial spray zone. Map “b” indicates the final determination of the dichotomous exposure variable by Sacramento County ZIP Code. The numbers inside the ZIP Codes are the percentage of residential areas within the ZIP Code that were exposed to aerially sprayed pyrethrin insecticide.
In addition to the exposure variable, we also created several lag-day variables. We theorized that some people who may have experienced a health effect related to the spraying event may have delayed seeking immediate emergency care, waiting a few days to be seen. It is also possible that the insecticide exposure had a cumulative and/or delayed effect. Finally, although the pyrethrin insecticides are unstable in sunlight and evaporate quickly,22 some evidence notes that there is a longer-lasting residue from the product in certain environments, such as wetlands.23,24 To account for these issues, we developed models for zero (day of exposure), one, two, and three lag days for each date of application.
Other environmental exposure variables
Because some diagnoses may be related to ambient temperature,25–27 we created a variable for daily 24-hour average temperature by ZIP Code in Sacramento County. In addition, to control for potential confounding by ozone (most notably in summer months), we created ZIP Code-level estimates for ozone (daily one-hour maximum). For these environmental variables, daily data were obtained from the California Air Resources Board. Then, within the GIS, we performed interpolation of daily values during the study area. We used the simple Kriging method, using the 12 nearest monitors for temperature interpolation, because this method has been shown to produce superior results compared with other interpolation techniques for daily temperature estimation.28 To avoid error in interpolation around the edges of Sacramento County, we included the entire state of California in the interpolation. We used an inverse distance-squared weighting method to interpolate the statewide ozone. Inverse distance-squared weighting calculates diminishing contributions of observations (from the nearest 12 monitors) depending on their distance from the point to be interpolated. We then applied zonal analysis to the interpolated values as a method of aggregation at the ZIP Code level. The interpolation process was repeated for each day during the study period (January 1–December 31, 2005).
Other independent variables
We derived age, gender, and race/ethnicity (black, white, Asian, Hispanic, or other, where Hispanic ethnicity took categorical precedence over any race) from the OSHPD data. We obtained median household income per ZIP Code from 2008 U.S. Census estimates provided by GeoLytics, Inc.29 and matched them to each patient's record based on the patient's ZIP Code of residence.
Statistical analysis
We examined the adjusted relationships between potential insecticide exposure and short-term risk of ED visits for specific diagnoses and for all causes of ED visits based on three-digit International Classification of Diseases, Ninth Revision, Clinical Modification (ICD-9-CM) codes.30 Within the ED dataset, an encounter may have up to 24 coded diagnosis fields (ICD-9-CM codes). Analyses showed that 91% of all unique diagnoses were included in the first three diagnostic fields. Therefore, we included, as separate observations, each of an individual's first three diagnoses in the regression. The primary analyses employed logistic regression models using the generalized estimating equations approach to account for the nesting of patient diagnoses within a patient and of patients within ZIP Codes. All analyses were adjusted for age, gender, race/ethnicity, median income, and non-insecticide environmental exposures (temperature and ozone).
Specific diagnosis cluster analyses.
Based on previously documented human health risks associated with the related pyrethroid insecticides,31,32 we examined whether ED visits due to specific clusters of respiratory, GI, skin, eye, and neurologic diagnoses were associated with insecticide application. Using the first three diagnoses existing in the ED database, two clinicians (Geraghty and Franks) independently reviewed and assigned each diagnosis to one of the aforementioned groups where appropriate. Disagreements were resolved through discussion and literature search. We also created a reference ICD-9-CM category to represent a group of diagnoses that were unlikely to be related to insecticide exposure (i.e., codes 800–848 encompassing orthopedic fractures and dislocations). Logistic regression analyses employed each specific diagnostic cluster (i.e., respiratory, GI, skin, eye, or neurologic vs. reference category) as the dependent variable and insecticide exposure status (yes or no at zero, one, two, or three lag days) as the key independent variable.
All diagnosis cluster analyses.
In exploratory analyses, because much less is known about the risks of pyrethrin insecticide exposure, we sought to identify previously unreported effects of aerial applications of pyrethrins. We evaluated other potential short-term adverse effects as evidenced by any association between ED visits for 785 diagnostic categories and spray exposure. The dependent variable in each regression was considered to be whether or not the ED visit occurred in a patient from an exposed ZIP Code on an application date (or lagged [one, two, or three] exposure days). The key independent variable was the three-digit ICD-9-CM code, using the aforementioned reference category (fractures and dislocations). To reduce the risk of identifying spurious associations, the dataset was randomly split into two equal halves and the analysis was repeated for each set. An ICD-9-CM category was considered significantly associated with exposure status at p<0.05 in both datasets, with the effect direction consistent in both analyses.
Sensitivity analyses.
In sensitivity analyses, we restricted the analytic datasets, both for specific diagnosis clusters and for all diagnosis clusters, to the summer months including July 5–September 30, 2005.
We conducted all logistic regression analyses using Stata®/MP version 11.2.33 Statistical tests were two-sided and p<0.05 was considered statistically significant.
RESULTS
Sacramento County had 52 ZIP Codes in 2005. In our exposure analysis, we focused on ZIP Codes with residential areas that were either considered fully exposed (n=19) or fully unexposed (n=21) to aerial ULV insecticide applications on the spray days. These analyses assumed downwind drift was minimal due to aerial onboard spray modeling equipment and selection of spray days with wind conditions generally <10 miles per hour.
During 2005, 332,222 unique Sacramento County ED visits were documented, and 253,648 (76.3%) ED visits were in fully exposed or fully unexposed areas. There were 78,574 (23.7%) ED visits among individuals living in partially exposed areas that were not included in the analysis. Among the ED visits that composed our analytic sample, there were 471,312 diagnoses altogether, 428,258 (91%) of which were within the first three diagnosis fields; of these observations, 408,233 (95.3%) had no missing variables and formed our analytic dataset. Characteristics by ZIP Code exposure status for those visiting the ED and the ZIP Code population are shown in Table 1. Those living in exposed ZIP Codes, and those visiting the ED from exposed ZIP Codes, were more likely than their counterparts from unexposed ZIP Codes to be nonwhite and have lower incomes (p<0.001, data not shown).
Table 1.
Sociodemographic characteristics of the total and ED user population of Sacramento County, California, by ZIP Code exposure status in a study of pyrethrin spraying against West Nile virus-carrying mosquitoes, 2005
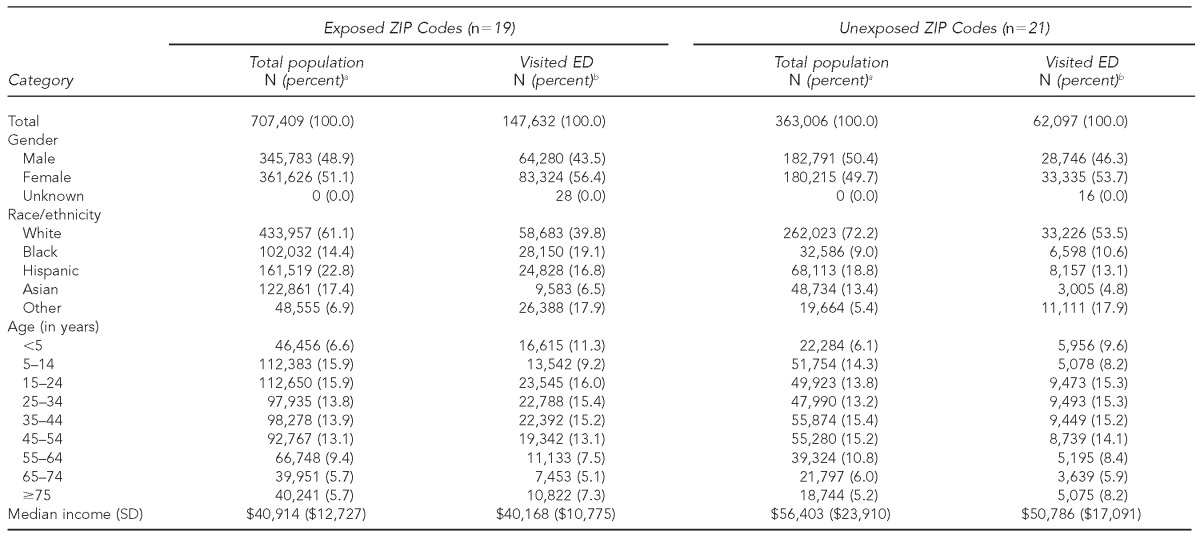
aRepresents the percentage of the total population within exposed vs. unexposed ZIP Codes. Population data culled from GeoLytics, Inc. (East Brunswick, New Jersey). Not all percentages total 100% due to rounding.
bRepresents the percentage of unique patients visiting an ED during the study period. Not all percentages total 100% due to rounding.
ED = emergency department
SD = standard deviation
The frequency of the top 20 most common diagnostic codes in spray areas on spray and/or lag days was similar to the top 20 diagnostic codes in spray areas on non-spray and lag days and in non-spray areas on all days (Table 2).
Table 2.
The top 20 ICD-9-CM codes in the 2005 Sacramento County, California, OSHPD ED dataset by exposure status during spraying of pyrethrin insecticide against West Nile virus-carrying mosquitoes
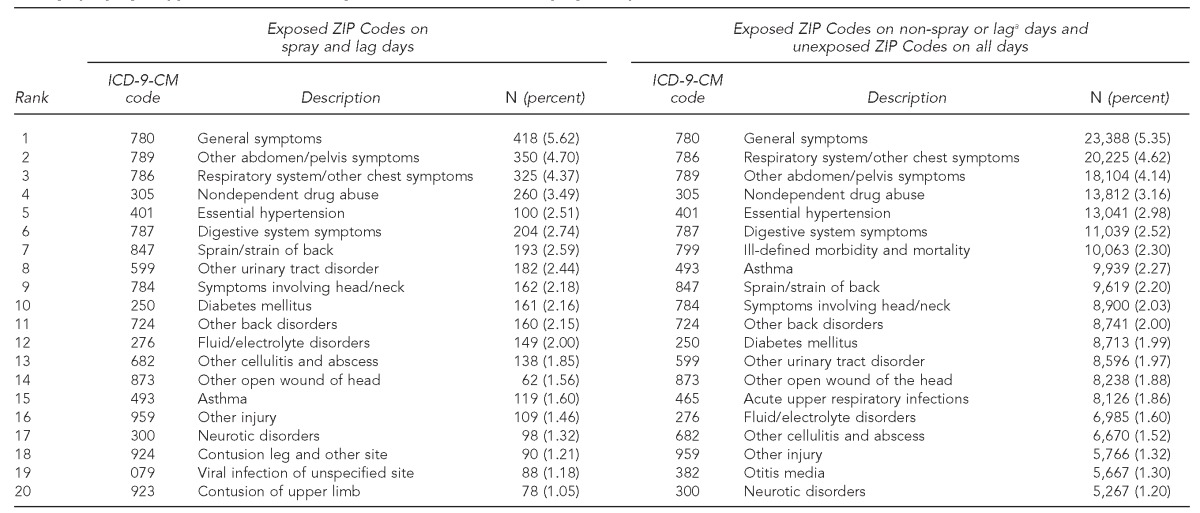
aLag days refers to the number of days between insecticide exposure and visiting an ED.
ICD-9-CM = International Classification of Diseases, Ninth Revision, Clinical Modification
OSHPD = Office of Statewide Health Planning and Development
ED = emergency department
Specific diagnosis clusters
In unadjusted models, we found that there was a significant (p<0.021) association between the GI diagnostic cluster and insecticide exposure plus three lag days (odds ratio [OR] = 1.14, 95% confidence interval [CI] 1.02, 1.28). In fully adjusted models, this effect became nonsignificant. There were no statistically significant associations between diagnostic clusters for respiratory, skin, eye, or neurologic causes and exposure to aerial insecticide spraying in either adjusted or unadjusted models (Table 3).
Table 3.
Logistic regression results for specific diagnostic clusters (respiratory, gastrointestinal, skin, eye, and neurologic) in the 2005 Sacramento County, California, OSHPD ED dataset on pyrethrin insecticide exposure days and up to three lag daysa
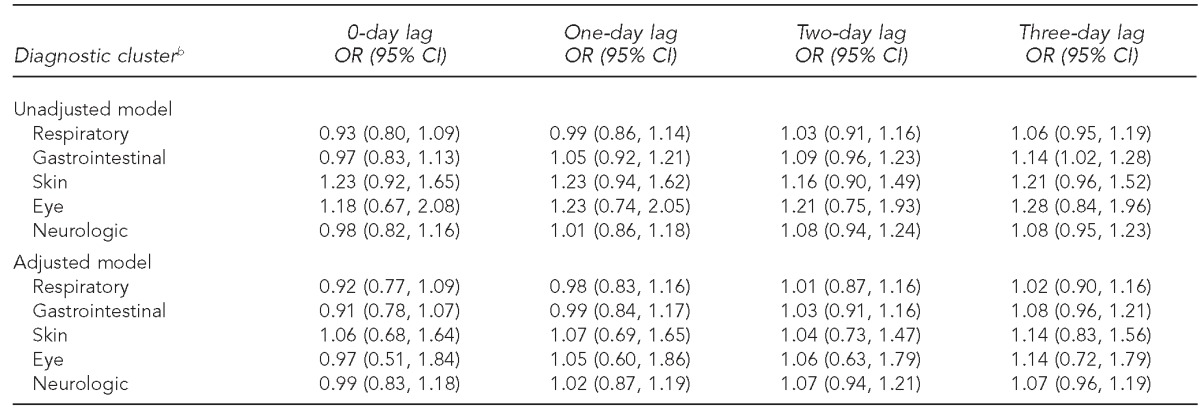
aLag days refers to the number of days between insecticide exposure and visiting an ED.
bDiagnostic clusters were treated as dependent variables in this analysis.
OSHPD = Office of Statewide Health Planning and Development
ED = emergency department
OR = odds ratio
CI = confidence interval
Results for all diagnoses
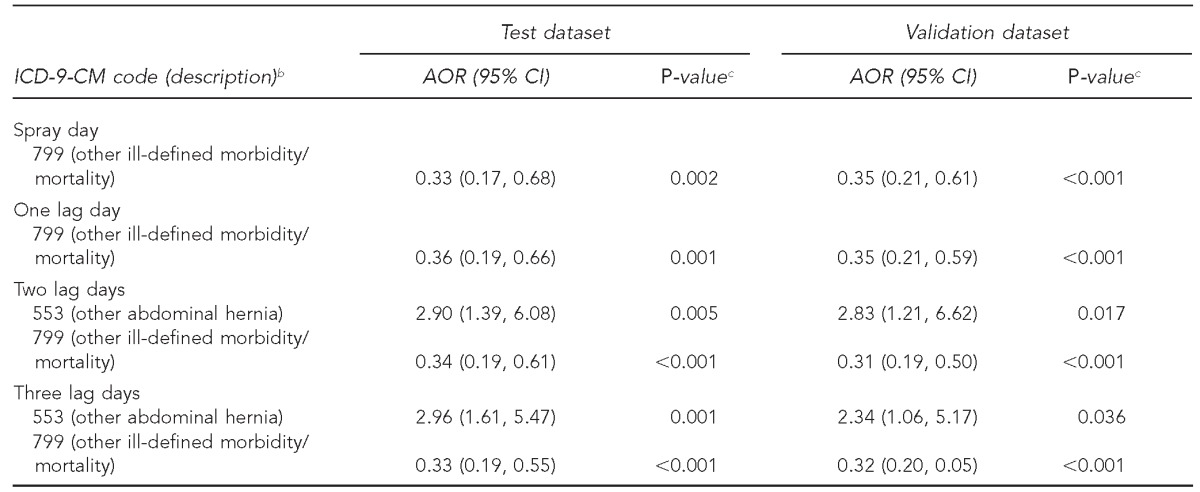
Significant associations from the four pairs (i.e., the test and validation datasets) of logistic regressions for 0–3 lag days are shown in Table 4. Pyrethrin applications were associated with a lower adjusted risk of ICD-9-CM code 799 (“other ill-defined morbidity and mortality;” adjusted odds ratios [AORs] ranged from 0.31 to 0.36 for 0–3 lag days in all regressions, p<0.001) and a higher adjusted risk of ICD-9-CM code 553 (“other abdominal hernia;” AORs ranged from 2.34 to 2.96 for two and three lag days in four regressions, p<0.05).
Table 4.
Logistic regression results for all diagnoses in the 2005 Sacramento County, California, OSHPD ED dataset on pyrethrin insecticide exposure days and up to three lag daysa
aLag days refers to the number of days between insecticide exposure and visiting an ED.
bDiagnostic codes were treated as independent variables in this analysis.
cOnly diagnoses showing statistical significance in both the test dataset and the validation dataset are shown.
OSHPD = Office of Statewide Health Planning and Development
ED = emergency department
ICD-9-CM = International Classification of Diseases, Ninth Revision, Clinical Modification
AOR = adjusted odds ratio
CI = confidence interval
Results for analysis of summer months only
Analyses for both specific diagnosis clusters and for all diagnoses restricted to the summer months revealed no statistically significant associations between pyrethrin exposure and ED visit diagnoses (data not shown).
DISCUSSION
Aerial ULV applications of pyrethrin insecticide for WNV intervention were not associated with any of the known types of diagnoses for which exposure to these insecticides has been implicated. When we analyzed all possible ED diagnoses, insecticide exposure was associated with two three-digit ICD-9-CM codes, with a lower risk of ICD-9-CM code 799 (“other ill-defined morbidity and mortality”) and an elevated risk of code 553 (“other abdominal hernia”). Given that neither outcome is biologically plausible, these outcomes are likely chance observations. In a regression analysis with 785 diagnostic codes, with the dataset split into two, chance would likely produce two diagnostic codes that are significantly associated with spraying in both datasets (785 diagnoses × 0.05 × 0.05 = 1.96).
“Other abdominal hernia” is not an acute illness causally related to aerial insecticide exposure. The 799 code, however, includes a number of subcategories that are reasonably associated with insecticide exposure, such as asphyxia and hypoxemia, hypoxemia, respiratory arrest, and nervousness. Of the 10,122 observations in this category (799 code), only 179 observations (1.7%) were related to these subcategories. The majority of observations with the 799 code were categorized as “other unknown and unspecified cause: undiagnosed disease, not specified as to site or system involved.” Furthermore, the effect direction was toward a protective rather than harmful effect of spraying. It is possible that susceptible individuals in exposed ZIP Codes may have responded to health education messages (i.e., to remain indoors), thereby protecting themselves from insecticide and other environmental exposures.
Insecticide exposure was determined using a dasymetric modeling technique to improve the precision of ZIP Code-level exposure assignment, which allowed determination of the proportion of the population within a ZIP Code exposed (high and low proportions as well as intermediate proportion and, thus, potentially allowing study of a dose-response effect). Given that our logistic models revealed little evidence of an effect on fully exposed vs. unexposed populations in a ZIP Code, further analysis was not considered necessary.
Limitations
This study was subject to several limitations. For one, debate exists in the literature regarding the optimal methods for temperature and pollutant interpolation.34 Some research suggests, for example, that Kriging (i.e., an interpolation method based on the semivariogram) may be more optimal than inverse distance-weighting schemes for ozone modeling.35 Because no effect of aerial insecticide spraying was found in our adjusted models, we considered it improbable that an effect of aerial insecticide spraying would emerge if we had used an alternate interpolation method.
Our study suggests that the short duration of pyrethrin insecticides (pyrethrin + piperonyl butoxide) exposure during emergency intervention in response to WNV, as was done in Sacramento in 2005, did not incur additional negative health consequences as measured by ED visits. However, in other areas, mosquito populations are subject to aerial spraying at regular intervals throughout the year. The potential health impact of repeated exposures to these insecticides requires further investigation. Our study also did not address the potential latent effects of insecticide exposure.
CONCLUSIONS
The large database of ED records allowed for a detailed and sensitive evaluation of potential negative health effects associated with wide-scale aerial insecticide spraying. The emergency application of aerial pyrethrin insecticides to control WNV transmission in Sacramento County was not associated with increased ED visits reflecting specific or general short-term health effects.
Footnotes
The authors thank Dave Brown and the Sacramento-Yolo Mosquito and Vector Control District for providing aerial spraying data. Dr. Geraghty's work is supported by a University of California (UC), Davis, Clinical and Translational Science Center K12 Career Development Award (grant #UL1 RR024146) from the National Center for Research Resources of the National Institutes of Health.
The study was approved by both the UC Davis Institutional Review Board and the California Health and Human Services Committee for the Protection of Human Subjects.
REFERENCES
- 1.Rose RI. Pesticides and public health: integrated methods of mosquito management. Emerg Infect Dis. 2001;7:17–23. doi: 10.3201/eid0701.010103. [DOI] [PMC free article] [PubMed] [Google Scholar]
- 2.Centers for Disease Control and Prevention (US). Mosquito control questions and answers. [cited 2012 Oct 18]. Available from: URL: http://www.cdc.gov/ncidod/dvbid/westnile/qa/pesticides.htm.
- 3.Kollars D, Peyton Dahlberg C. West Nile spraying begins: officials say its safe, but public fears are widespread. Sacramento Bee. 2005;Sect. A:1. [Google Scholar]
- 4.Zielinski-Gutierrez EC, Hayden MH. A model for defining West Nile virus risk perception based on ecology and proximity. EcoHealth. 2006;3:28–34. [Google Scholar]
- 5.Stop West Nile Spraying Now. Support effective alternatives to adulticide spraying. [cited 2012 Nov 27]. Available from: URL: http://www.stopwestnilesprayingnow.org.
- 6.Elnaiem DE, Kelley K, Wright S, Laffey R, Yoshimura G, Reed M, et al. Impact of aerial spraying of pyrethrin insecticide on Culex pipiens and Culex tarsalis (Diptera: Culicidae) abundance and West Nile virus infection rates in an urban/suburban area of Sacramento County, California. J Med Entomol. 2008;45:751–7. doi: 10.1603/0022-2585(2008)45[751:ioasop]2.0.co;2. [DOI] [PubMed] [Google Scholar]
- 7.Carney RM, Husted S, Jean C, Glaser C, Kramer V. Efficacy of aerial spraying of mosquito adulticide in reducing incidence of West Nile virus, California, 2005. Emerg Infect Dis. 2008;14:747–54. doi: 10.3201/eid1405.071347. [DOI] [PMC free article] [PubMed] [Google Scholar]
- 8.Centers for Disease Control and Prevention, Agency for Toxic Substances and Disease Registry (US). Toxic substances portal—pyrethrins and pyrethroids. ToxFAQs™ for pyrethrins and pyrethroids. [cited 2012 Mar 7]. Available from: URL: http://www.atsdr.cdc.gov/toxfaqs/tf.asp?id=786&tid=153.
- 9.Spencer J, O'Malley M. Pyrethroid illnesses in California, 1996–2002. Rev Environ Contam Toxicol. 2006;186:57–72. [PubMed] [Google Scholar]
- 10.Karpati AM, Perrin MC, Matte T, Leighton J, Schwartz J, Barr RG. Pesticide spraying for West Nile virus control and emergency department asthma visits in New York City, 2000. Environ Health Perspect. 2004;112:1183–7. doi: 10.1289/ehp.6946. [DOI] [PMC free article] [PubMed] [Google Scholar]
- 11.O'Sullivan BC, Lafleur J, Fridal K, Hormozdi S, Schwartz S, Belt M, et al. The effect of pesticide spraying on the rate and severity of ED asthma. Am J Emerg Med. 2005;23:463–7. doi: 10.1016/j.ajem.2004.12.017. [DOI] [PubMed] [Google Scholar]
- 12.Environmental Protection Agency (US). Pyrethroids and pyrethrins. [cited 2012 Nov 27]. Available from: URL: http://www.epa.gov/oppsrrd1/reevaluation/pyrethroids-pyrethrins.html.
- 13.Centers for Disease Control and Prevention (US). 2005 West Nile virus activity in the United States. [cited 2011 Mar 8]. Available from: URL: http://www.cdc.gov/NCIDOD/dvbid/westnile/surv&controlCaseCount05_detailed.htm.
- 14.U.S. Geological Survey. West Nile virus human 2005. [cited 2011 Mar 8]. Available from: URL: http://diseasemaps.usgs.gov/2005/wnv/wnv_tx_human.html.
- 15.Hardy T. Aerial spraying's safety is challenged: Sacramento City Councilman Rob Fong is seeking to halt the anti-West Nile virus procedure. The Sacramento Bee. 2007 Aug 9; [Google Scholar]
- 16. Cal. Health – Safety Code §128736 (2004).
- 17.ESRI. ArcGIS®: Version 9.3.1. Redlands (CA): ESRI; 2009. [Google Scholar]
- 18.Reisen WK, Lothrop HD, Meyer RP. Time of host-seeking by Culex tarsalis (Diptera: Culicidae) in California. J Med Entomol. 1997;34:430–7. doi: 10.1093/jmedent/34.4.430. [DOI] [PubMed] [Google Scholar]
- 19.Savage HM, Anderson M, Gordon E, McMillen L, Colton L, Delorey M, et al. Host-seeking heights, host-seeking activity patterns, and West Nile virus infection rates for members of the Culex pipiens complex at different habitat types within the hybrid zone, Shelby County, TN, 2002 (Diptera: Culicidae) J Med Entomol. 2008;45:276–88. doi: 10.1603/0022-2585(2008)45[276:hhhapa]2.0.co;2. [DOI] [PubMed] [Google Scholar]
- 20.Briggs DJ, Gulliver J, Fecht D, Vienneau DM. Dasymetric modelling of small-area population distribution using land cover and light emissions data. Remote Sens Environ. 2007;108:451–66. [Google Scholar]
- 21.Sacramento County. GIS data library: parcels. [cited 2009 Jul 7]. Available from: URL: http://www.sacgis.org/GISDataPub/Data.
- 22.Casida JE. Pyrethrum flowers and pyrethroid insecticides. Environ Health Perspect. 1980;34:189–202. doi: 10.1289/ehp.8034189. [DOI] [PMC free article] [PubMed] [Google Scholar]
- 23.Angioni A, Dedola F, Minelli EV, Barra A, Cabras P, Caboni P. Residues and half-life times of pyrethrins on peaches after field treatments. J Agric Food Chem. 2005;53:4059–63. doi: 10.1021/jf0477999. [DOI] [PubMed] [Google Scholar]
- 24.Lawler SP, Dritz DA, Johnson CS, Wolder M. Does synergized pyrethrin applied over wetlands for mosquito control affect Daphnia magna zooplankton or Callibaetis californicus mayflies? Pest Manag Sci. 2008;64:843–7. doi: 10.1002/ps.1575. [DOI] [PubMed] [Google Scholar]
- 25.Ren C, O'Neill M, Park SK, Sparrow D, Vokonas P, Schwartz J. Ambient temperature, air pollution, and heart rate variability in an aging population. Am J Epidemiol. 2011;173:1013–21. doi: 10.1093/aje/kwq477. [DOI] [PMC free article] [PubMed] [Google Scholar]
- 26.Strand LB, Barnett AG, Tong S. The influence of season and ambient temperature on birth outcomes: a review of the epidemiological literature. Environ Res. 2011;111:451–62. doi: 10.1016/j.envres.2011.01.023. [DOI] [PubMed] [Google Scholar]
- 27.Basu R, Malig B. High ambient temperature and mortality in California: exploring the roles of age, disease, and mortality displacement. Environ Res. 2011;111:1286–92. doi: 10.1016/j.envres.2011.09.006. [DOI] [PubMed] [Google Scholar]
- 28.Collins FC, Jr,, Bolstad PV. A comparison of spatial interpolation techniques in temperature estimation. Third International Conference/Workshop on Integrating GIS and Environmental Modeling; 1996 Jan 21–25; Santa Fe, New Mexicom. [Google Scholar]
- 29.GeoLytics, Inc. 2008 median income estimate. [cited 2010 May 5]. Available from: URL: http://www.geolytics.com.
- 30.National Center for Health Statistics (US). International classification of diseases, ninth revision, clinical modification (ICD-9-CM) [cited 2012 Dec 1]. Available from: URL: http://www.cdc.gov/nchs/icd/icd9cm.htm.
- 31.Worker illness related to ground applications of pesticide—Kern County, California, 2005. MMWR Morb Mortal Wkly Rep. 2006;55(17):486–8. [PubMed] [Google Scholar]
- 32.Spencer J, O'Malley M. Pyrethroid illnesses in California, 1996–2002. Rev Environ Contam Toxicol. 2006;186:57–72. [PubMed] [Google Scholar]
- 33.StataCorp. Stata®: Version 11.2. College Station (TX): StataCorp; 2011. [Google Scholar]
- 34.Wong DW, Yuan L, Perlin SA. Comparison of spatial interpolation methods for the estimation of air quality data. J Expo Anal Environ Epidemiol. 2004;14:404–15. doi: 10.1038/sj.jea.7500338. [DOI] [PubMed] [Google Scholar]
- 35.Rojas-Avellaneda D. Spatial interpolation techniques for estimating levels of pollutant concentrations in the atmosphere. Revista Mexicana De Fisica. 2007;53:447–54. [Google Scholar]


