

Abstract
Objective
We recently reported an association with type 1 diabetes of a telomeric MHC SNP rs1233478. As further families have been analyzed in the Type 1 Diabetes Genetics Consortium (T1DGC), we sought to test replication of the association and with more data analyze haplotypic associations.
Research Design and Methods
We have since analyzed an additional 2,717 case and 1,315 control chromosomes from the T1DGC, with HLA-typing and data for 2,837 SNPs across the MHC region.
Results
We confirmed the association of rs1233478 [new data only: p=2.2E-5, OR=1.4]. We also found two additional SNPs nearby which were significantly associated with type 1 diabetes (new data only rs3131020: p=8.3E-9, OR=0.65; rs1592410 p=2.2E-8, OR=1.5). For studies of type 1 diabetes in the MHC region it is critical to account for linkage disequilibrium with the HLA genes. Logistic regression analysis of this new data indicated that the effects of rs3131020 and rs1592410 on type 1 diabetes risk are independent of HLA alleles (rs3131020: p=2.3E-3, OR=0.73; rs1592410: p=2.1E-3, OR=1.4). Haplotypes of 12 SNPs (including the three highly significant SNPs) stratify diabetes risk (high risk, protective, and neutral), with high risk haplotypes limited to approximately 20,000 base pairs in length. The 20,000 base pair region is telomeric of the UBD gene and contains LOC729653, a hypothetical gene.
Conclusions
We believe that polymorphisms of the telomeric MHC locus LOC729653 may confer risk for type 1 diabetes.
Keywords: genetic association studies, major histocompatibility complex, type 1 diabetes
Introduction
Type 1A diabetes is a complex autoimmune disease and is associated with genes within the major histocompatibility complex (MHC) and in other regions of the genome. Genome-wide association studies and other studies have identified more than 40 type 1 diabetes-associated genes, including insulin (INS), PTPN22, CTLA4, IFIH1 and IL2RA/CD251–17. However, the most significant association is with the MHC region, particularly the HLA-DRB1, HLA-DQA1, and HLA-DQB1 genes. The highest risk genotype for type 1 diabetes is DRB1*03-DQA1*0501-DQB1*0201/DRB1*04-DQA1*0301-DQB1*0302 (DR3/4)18,19.
There are genes other than HLA-DR/DQ within the MHC that also contribute to type 1 diabetes risk. Alleles of HLA-DPB1, HLA-B and HLA-A have also been associated with type 1 diabetes, independent of linkage disequilibrium with HLA-DR/DQ20,21. In particular, the HLA-B*39 allele is very high risk for type 1 diabetes, although it has a low frequency (4% of T1DGC case chromosomes)22,23. HLA-DPB1*0402 is protective against the development of anti-islet autoimmunity and diabetes24–26. We believe there are additional genes in the MHC region that contribute to type 1 diabetes risk as DR3/4 siblings that share 2 MHC haplotypes identical by descent with the proband have an 85% risk for developing anti-islet autoimmunity whereas those individuals that share 1 or 0 haplotypes identical by descent only have a risk of 20%27. As expected, class I HLA alleles associated with type 1 diabetes such as B*39 and A*24 are uncommon in the DAISY sibling case dataset given their low overall frequency.
Using an initial partial dataset from the Type 1 Diabetes Genetics Consortium (T1DGC), we previously reported an association of rs1233478 at the telomeric end of the MHC region with type 1 diabetes risk28. In this study, we analyzed additional data from the T1DGC, which provided an additional 1,060 affected sibling pairs and their parents for classical HLA alleles and 2,837 SNPs (single nucleotide polymorphisms) across the MHC region. We have confirmed the previous association at the telomeric end of the MHC region, identified additional strongly associated linked SNPs, and have detected a transcribed gene LOC729653 within the candidate region.
Methods
Study Populations and Genotyping
This analysis included 2,300 affected sibling pair families (10,012 individuals typed for HLA and/or SNPs) from the Type 1 Diabetes Genetics Consortium (T1DGC), using the 2007.11.MHC data freeze29. Affected sibling pairs and their parents were enrolled in 9 cohorts worldwide. Within the analyzed cohorts of Asia-Pacific, Europe, North America, UK, British Diabetes Association (BDA), Danish, Human Biological Data Interchange (HBDI), Joslin and Sardinian, 99% of individuals are classified as white/Caucasian or unknown. The T1DGC performed basic quality control analyses on the data. All study participants or their parents/surrogates provided written informed consent to participate, and the study protocol was approved by the relevant Ethics Committees and Institutional Review Boards.
Genotyping was completed for 3,072 SNPs at the Wellcome Trust Sanger Institute, using custom Illumina exon-centric and mapping panels [2957 distinct SNPs (1536 SNPs in each panel with 115 overlapping SNPs) with 2837 of 2957 SNPs successfully typed, yielding a 96% SNP success rate]. In addition, complete 4 digit HLA typing (HLA-DPB1, HLA-DPA1, HLA-DQB1, HLA-DQA1, HLA-DRB1, HLA-B, HLA-C and HLA-A), performed using immobilized probe linear arrays, was available for all samples30.
Data Processing
SNP positions used NCBI Build 36. T1DGC chromosomes were generated from SNP and HLA genotype data using multiple software packages. First, to establish that the genotype data demonstrated a Mendelian inheritance pattern within each family, the PedCheck program (http://watson.hgen.pitt.edu)31 was used on data from both Illumina panels and HLA separately. Mendelian inheritance patterns were present for all families. Next, data from the Illumina mapping SNP panel, the exon-centric SNP panel, and HLA were combined using custom Java programs. Merlin software (www.sph.umich.edu/csg/abecasis/Merlin)32 was used to phase the SNP and HLA genotype data from families into chromosomes. In situations of ambiguous phase (resulting from heterozygous SNPs or HLA in all family members), phase was not inferred and instead unphased alleles were labeled as such and were excluded from analyses where appropriate.
Founder chromosomes were used in these analyses, yielding 4 unique chromosomes per family. AFBAC (affected family based control) methodology was used to assign case or control status to chromosomes using Microsoft Excel macros as previously described33–36. Founder chromosomes were labeled as case if they were ever transmitted to a case individual. Correspondingly, chromosomes were labeled as control if they were never transmitted to a case individual. Two affected children in each family were used to label the chromosomes as either case or control, as this was the ascertainment scheme for T1DGC.
Characterization of the Expression Profile for LOC729653
LOC729653 expression was analyzed using the TissueScan Human Major Tissue qPCR Array Panel (cDNA from 48 normal human tissues) according to the manufacturer’s protocols (Origene Technologies, Rockville, MD). Reactions were amplified using primers generated against exon 3 (Ex3F) and the 3’ untranslated region (UTR1R) (Supplemental Table 1). The amplification conditions were as follows: 3 minutes at 94°C, 40 cycles (94°C for 15 seconds, 57°C for 1 minute, 72°C for 1 minute), and a final extension of 72°C for 15 minutes.
Expression results were verified using Taqman quantitative PCR (Applied Biosystems, Foster City, CA), the TissueScan Human Major Tissue qPCR Array Panel and purified human whole pancreas and pancreatic islets (> 75% pure, >75% viable) from healthy non-diabetic donors procured from the JDRF nPOD initiative and the NIH/NIDDK-sponsored Islet Cell Resource (ICR) distribution program respectively. Total RNA was extracted from human pancreas and isolated islets by TRIzol reagent® (Invitrogen, Carlsbad, CA). RNA was purified by RNeasy columns (Qiagen, Valencia, CA), quantified and quality verified by capillary electrophoresis (Agilent-2100 Bioanalyzer; Agilent, Palo Alto CA). cDNA was synthesized using iScript® cDNA Synthesis Kit (BioRad, Hercules, CA). The Taqman primers and probes designed and purchased from Applied Biosystems were as follows: forward primer: CATTTCTGGATTGCTGTCTGTC (anneals between residues 37 and 58 with a Tm of 56°), reverse primer: CAGGAGATGTGGTTCTGGTAGCT (anneals between residues 134 and 112 with a Tm of 58°), FAM /TAMRA probe: CATCTGCCCTGCTCAGTCCTGGG (anneals between residues 83 and 105 with a Tm of 68°). Three micrograms (µg) of cDNA was amplified in a 30 µl standard amplification reaction using Taqman Universal Master Mix in an Applied Biosystems Thermocycler ABI Prism® 7000. Two experiments were performed using 40 cycles, and the final experiment was performed using 45 cycles. Mean Ct (Table 3) was calculated across the three experiments, substituting either 40 or 45 for the Taqman calculations where there was no amplification (>40 or >45 in Supplemental table 5).
Table 3. Expression results from Taqman quantitative PCR and standard PCR.
Three Taqman experiments were performed (details in Methods and Supplemental Table 5). In addition, standard PCR was performed using 40 cycles (gel band column). LOC729653 is present at a low level in many tissues (Taqman Ct range of 30.3 cycles to 40.7 cycles). Mean Ct is the number of PCR cycles required for the transcript to appear, averaged across the three experiments.
| Sample Name | Number of Experiments (Taqman) |
Mean Ct |
Gel Band? (Standard PCR) |
|---|---|---|---|
| epididymis | 3 of 3 | 32.2 | yes |
| intestine (small) | 3 of 3 | 34.2 | no |
| stomach | 3 of 3 | 34.9 | yes |
| uterus | 3 of 3 | 34.9 | yes |
| duodenum (descending) | 3 of 3 | 35.1 | no |
| vagina | 3 of 3 | 35.2 | yes |
| lung | 3 of 3 | 35.2 | no |
| rectum | 3 of 3 | 35.3 | no |
| thymus | 3 of 3 | 35.4 | no |
| urinary bladder | 3 of 3 | 35.4 | yes |
| prostate | 3 of 3 | 36.6 | no |
| fat | 3 of 3 | 36.7 | no |
| lymph node | 3 of 3 | 37.2 | no |
| testis | 3 of 3 | 37.5 | no |
| urethra | 3 of 3 | 37.9 | yes |
| cervix | 3 of 3 | 38.1 | no |
| retina | 2 of 3 | 38.1 | no |
| seminal vesicles | 2 of 3 | 38.3 | yes |
| esophagus | 1 of 3 | 38.4 | yes |
| trachea | 2 of 3 | 38.5 | no |
| penis | 2 of 3 | 38.5 | no |
| bone marrow | 3 of 3 | 38.6 | no |
| spleen | 2 of 3 | 39.0 | yes |
| pancreas | 2 of 3 | 39.0 | no |
| ovary | 2 of 3 | 39.1 | no |
| nasal mucosa | 1 of 3 | 39.2 | no |
| tongue | 1 of 3 | 39.2 | no |
| vena cava | 2 of 3 | 39.2 | no |
| skin | 2 of 3 | 39.5 | yes |
| kidney | 1 of 3 | 39.6 | no |
| spinal cord | 1 of 3 | 39.7 | no |
| tonsil | 1 of 3 | 39.7 | no |
| whole pancreas (purified) | 3 of 3 | 39.7 | N/A |
| colon | 3 of 3 | 39.7 | no |
| uvula | 1 of 3 | 39.8 | no |
| thyroid | 1 of 3 | 39.8 | no |
| pituitary | 1 of 3 | 40.0 | yes |
| heart | 2 of 3 | 41.6 | no |
| adrenal gland | 1 of 3 | 41.6 | no |
| brain | 0 of 3 | 41.7 | no |
| intercranial artery | 0 of 3 | 41.7 | no |
| adult islets (purified) | 0 of 3 | 41.7 | N/A |
| liver | 0 of 3 | 41.7 | no |
| mammary gland | 0 of 3 | 41.7 | no |
| muscle | 0 of 3 | 41.7 | no |
| optic nerve | 0 of 3 | 41.7 | no |
| oviduct | 0 of 3 | 41.7 | no |
| PBL (plasma blood leukocytes) | 0 of 3 | 41.7 | no |
| pericardium | 0 of 3 | 41.7 | no |
| placenta | 0 of 3 | 41.7 | no |
| negative control | 0 of 3 | 41.7 | no |
Further characterization of the LOC729653 gene sequence was performed using First Strand cDNA Human Stomach (Origene Technologies, Rockville, MD) with primers listed in Supplemental Table 1 (Ex2F and UTR1R, Ex3F and UTR1R, Ex4F and UTR2R), followed by Sanger sequencing of each resulting product. In addition, Sanger sequencing was performed on 8 T1DGC individuals, each homozygous for one of four different haplotypes surrounding LOC729653. Sequencing focused on regions surrounding exons and the 3’ UTR of LOC729653, and partially covered the region from 29.571 Mb to 29.586 Mb. One low risk haplotype, one neutral and two different high risk haplotypes were represented, with sequencing performed for two individuals homozygous for each of the four haplotypes. Results are presented in supplemental table 6.
5’ Rapid Amplification of cDNA Ends (5’ RACE)
The 5’ end of LOC729653 was mapped by using rapid amplification of cDNA ends (5’ RACE) using the SMARTer RACE cDNA Amplification Kit and the Advantage® 2 PCR Kit according to instructions supplied by the manufacturer (Clontech Laboratories, Mountain View, CA). Primers used for the 5’ RACE were generated against the 3’ UTR and exon 4: one at the start of the 3’ UTR (RACE_OUT) and the other was a nested primer located in exon 4 (RACE_IN). 5’ RACE-ready cDNA was obtained from First Strand cDNA Human Stomach (Origene Technologies, Rockville, MD). The initial touchdown PCR conditions were 5 cycles (94°C for 30 seconds and 72°C for 3 minutes), 5 cycles (94°C for 30 seconds, 70°C for 30 seconds, and 72°C for 3 minutes) and 25 cycles (94°C for 30 seconds, 68°C for 30 seconds, and 72°C for 3 minutes), using the RACE_OUT primer. The reaction product was then used in a second round of PCR using the same conditions and the RACE_IN primer, followed by Sanger sequencing of the resulting products.
Statistical Analysis
The Fisher’s exact test (two-sided) was used to calculate p-values for association with type 1A diabetes, using α=0.05. In addition, to verify that the significant findings were not caused by population stratification, the transmission disequilibrium test (TDT) was computed on the SNPs surrounding LOC729653, using Haploview version 4.2 (http://www.broadinstitute.org/mpg/haploview)37. We also used Haploview version 4.2 to determine Hardy-Weinberg Equilibrium (HWE) values for SNPs of interest and to generate the linkage disequilibrium plot in Figure 2. For the linkage disequilibrium plot, we used the standard color scheme and the default Gabriel et al. confidence interval definition of haplotype blocks38. An in-house script was used to complete the 12 SNP and 14 SNP haplotype analyses on case/control founder chromosomes. SAS software (version 9.2) was used to perform logistic regression analysis.
Figure 2. Linkage disequilibrium across the 14 SNPs of interest in LOC729653.
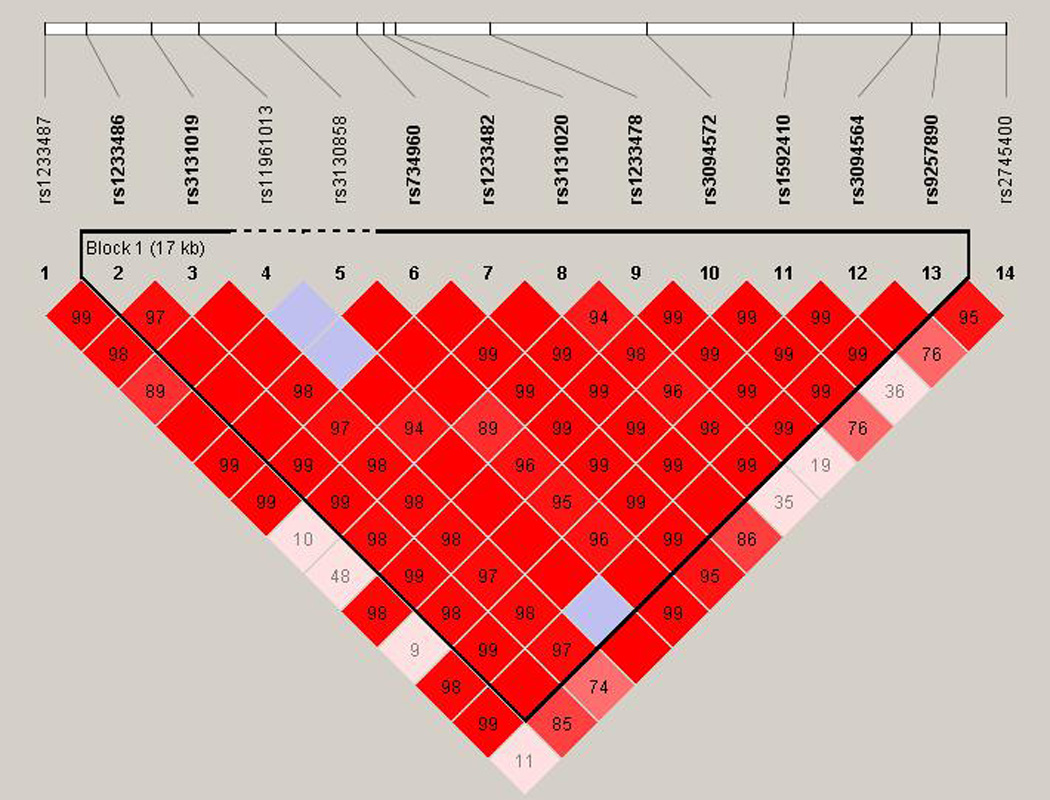
Linkage disequilibrium was calculated using Haploview across the 14 SNPs of interest in LOC729653. Haplotype blocks were calculated using the default Gabriel et al. confidence interval settings. The numbers represent D’ values, and where the block is empty, the D’ is equal to 1. As can been seen from the graph, there is one haplotype block in the region, which encompasses the 12 central SNPs identified in our analysis.
Results
Utilizing additional data provided on 1,060 additional families from the Type 1 Diabetes Genetics Consortium (T1DGC), we were able to replicate the association of rs1233478 (identified in 1,240 initial families) at the telomeric end of the MHC region with type 1 diabetes (p=2.2E-5, OR=1.4) (Figure 1A, Supplemental Table 2). We also found two additional SNPs nearby which were significantly associated with type 1 diabetes (rs3131020: p=8.3E-9, OR=0.65; rs1592410: p=2.2E-8, OR=1.5). Given the larger combined dataset, three SNPs within and near LOC729653 are significantly associated with type 1 diabetes [rs3131020 p=1.6E-20, odds ratio (OR)=0.64; rs1233478 p=3.2E-25, OR=1.9; rs1592410 p=6.6E-20, OR=1.5] (Figure 1B, Supplemental Table 3). A summary of these results is presented in Table 1. We also focused specifically on the LOC729653 region (Figure 1C). These results were confirmed when we used the TDT to analyze transmission to affected children for each SNP. For the combined dataset, the “A” allele for all three SNPs was significantly over-transmitted to affected children (rs3131020: p=1.6E-22; rs1233478: p=3.3E-27; rs1592410: p=1.2E-21).
Figure 1. Association of SNPs across the MHC region with type 1 diabetes.
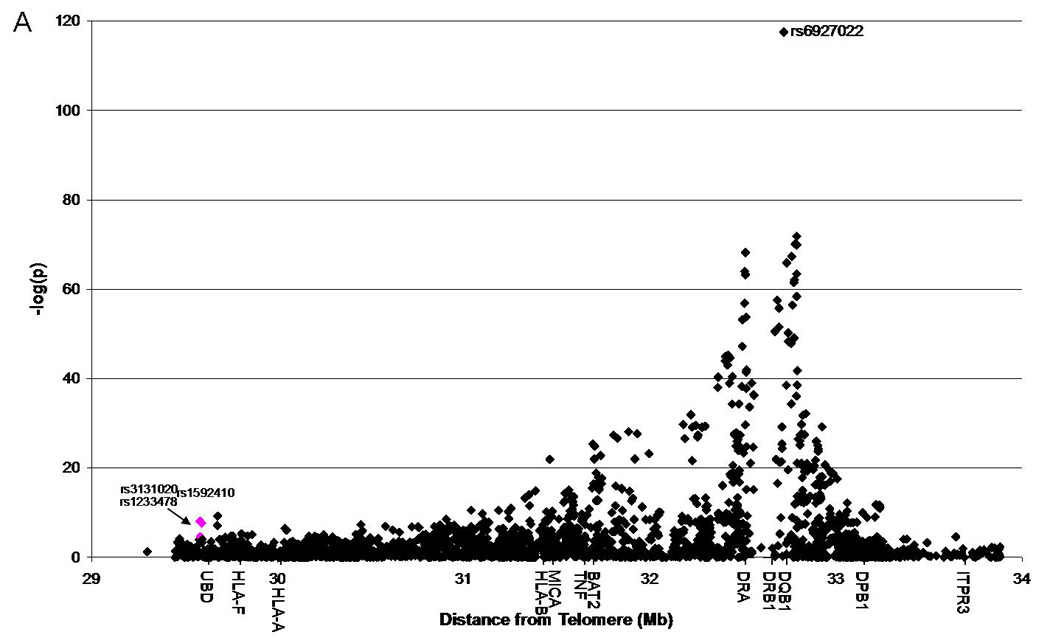
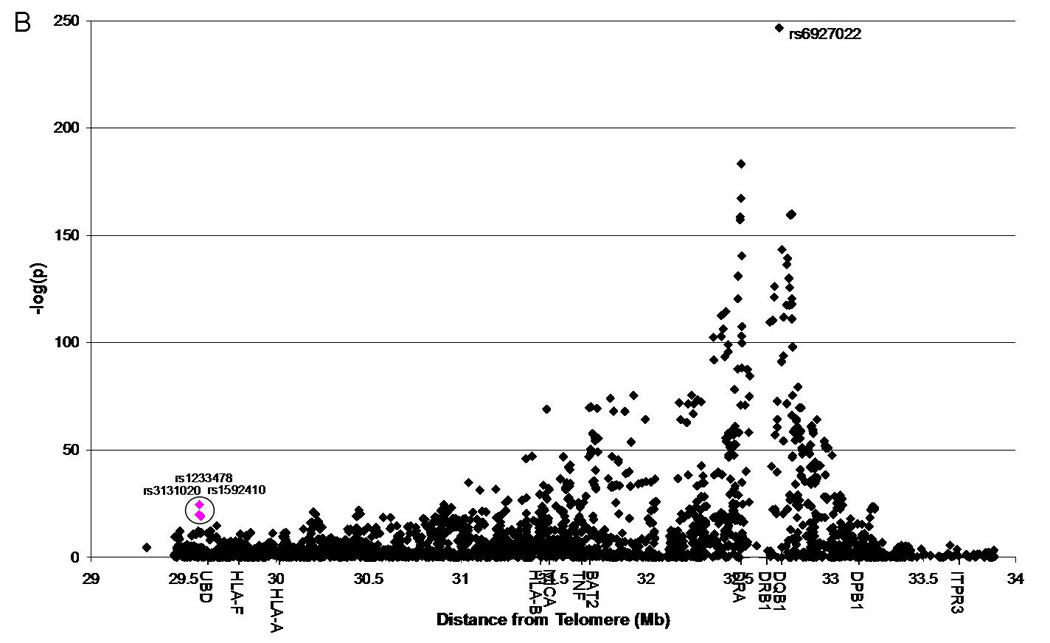
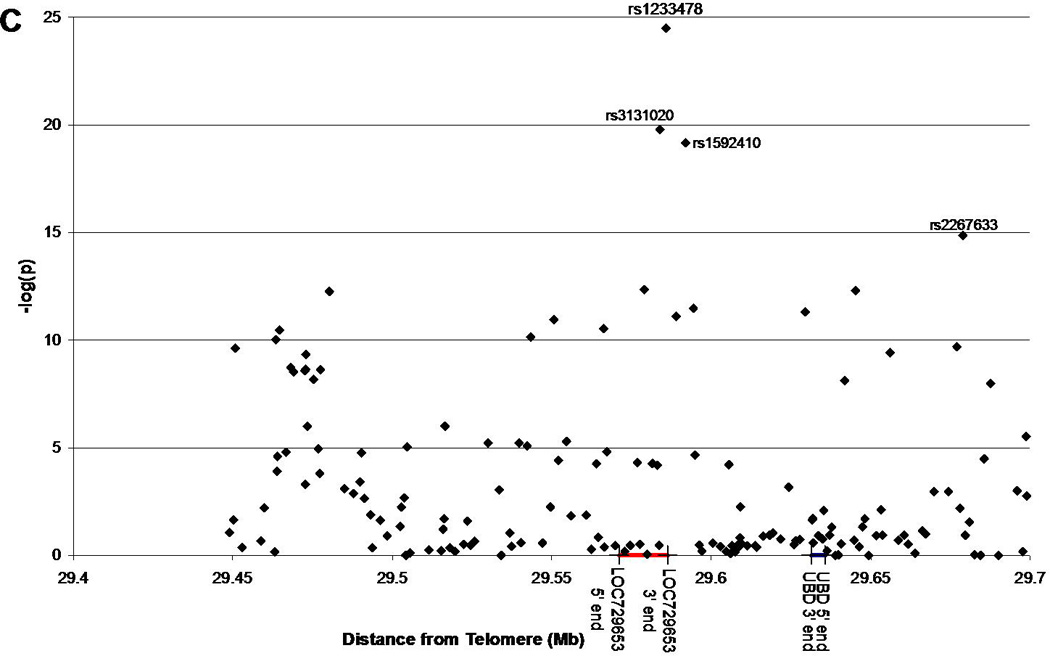
Negative log of the p-values are plotted against the position (distance from the telomere, in megabases).
1A: Replication set, T1DGC, 2,717 case chromosomes and 1,315 control chromosomes analyzed; three SNPs of interest are highlighted in pink.
1B: Combined set (initial and replication sets combined), T1DGC, 5,814 case and 2,971 control chromosomes analyzed; three SNPs of interest are highlighted in pink and circled.
1C: Same as Figure 1B but zoomed in to show the region surrounding the LOC729653 gene.
Table 1. SNPs of interest near LOC729653.
All three SNPs of interest are in Hardy-Weinberg Equilibrium. Raw p-values and odds ratios were calculated based on either the new data set or combined data set, case/control chromosome analysis. The corrected p-values were generated using the same data sets and using logistic regression analysis accounting for the effects from HLA-DRB1, HLA-DQB1, HLA-B and HLA-A.
| Dataset | SNP | Position (Build 36) |
HWE | Major Allele |
Minor Allele |
Case Major |
Case Minor |
Control Major |
Control Minor |
Raw p-value |
Raw Odds Ratio |
Corrected p-value |
Corrected Odds Ratio |
|---|---|---|---|---|---|---|---|---|---|---|---|---|---|
| New | rs3131020 | 29583881 | 0.3117 | 1 | 3 | 1186 | 1163 | 446 | 669 | 8.3E-09 | 0.65 | 2.3E-03 | 0.73 |
| New | rs1233478 | 29585800 | 1 | 2 | 1 | 1916 | 584 | 993 | 208 | 2.2E-05 | 1.4 | 0.4 | 1.1 |
| New | rs1592410 | 29591947 | 1.3025 | 3 | 1 | 1199 | 1196 | 685 | 454 | 2.2E-08 | 1.5 | 2.1E-03 | 1.4 |
| Combined | rs3131020 | 29583881 | 0.7995 | 1 | 3 | 2722 | 2494 | 1076 | 1543 | 1.6E-20 | 0.64 | 0.02 | 0.83 |
| Combined | rs1233478 | 29585800 | 0.7005 | 2 | 1 | 4044 | 1394 | 2320 | 433 | 3.2E-25 | 1.9 | 4.1E-03 | 1.3 |
| Combined | rs1592410 | 29591947 | 0.6846 | 3 | 1 | 2523 | 2737 | 1561 | 1093 | 6.6E-20 | 1.5 | 7.3E-03 | 1.2 |
We performed haplotypic analyses to further localize the association signal. The high risk alleles for the three SNPs (in the T1DGC dataset) are rs3131020 “A”, rs1233478 “A” and rs1592410 “A.” A 12 SNP haplotype that includes A-A-A for the three SNPs of interest is the only haplotype (with frequency greater than 1%) that is significantly over-transmitted (CAGTGCAACAAC) (Table 2). When this is expanded to a 14 SNP haplotype (one additional SNP on each side), three haplotypes are significantly over-transmitted, all with the same core 12 SNP haplotype (Table 2). This suggests that the association signal [or causative high risk allele(s)] is within this 14 SNP range, or 19,440 base pairs. In addition, there are low risk or protective haplotypes present at this locus. The protective haplotypes of these 14 SNPs have GCTG and GCCG for rs3131020, rs1233478, rs3094572 and rs1592410, indicating that there is already a difference in risk across these 4 SNPs (8,066 base pairs), suggesting that the causative protective polymorphism may be within this region. We examined the linkage disequilibrium across the 14 SNPs of interest and found that there is one haplotype block in the region, encompassing the 12 central SNPs identified in our analysis (Figure 2).
Table 2. Haplotypes across the LOC729653 locus.
Haplotypes with a frequency of more than 1% are shown. The SNPs are rs1233487, rs1233486, rs3131019, rs11961013, rs3130858, rs734960, rs1233482, rs3131020, rs1233478, rs3094572, rs1592410, rs3094564, rs9257890, and rs2745400, in order. All the 14 SNP haplotypes that are significantly associated with type 1 diabetes and confer increased risk for type 1 diabetes share the central 12 SNPs (bold in table, share 12 SNP haplotype number 4).
| 14 SNP | 12 SNP | ||||||||||
|---|---|---|---|---|---|---|---|---|---|---|---|
| Haplotype | Freq. (%) |
Case | Control | p-value | Odds Ratio |
12 SNP # |
Freq. (%) |
Case | Control | p-value | Odds Ratio |
| ACCGTGCGCTGGCG | 34.2 | 1414 | 829 | 4.6E-07† | 0.76 | 1 | 34.6 | 1499 | 900 | 2.8E-08‡ | 0.74 |
| ATAGTGAACCAACA | 22.9 | 1013 | 486 | 0.7 | 1.0 | 2 | 24.1 | 1123 | 551 | 0.8 | 1.0 |
| GCAGTACGCCGATA | 12.4 | 511 | 299 | 9.4E-03† | 0.82 | 3 | 12.6 | 549 | 324 | 8.9E-03‡ | 0.82 |
| GCAGTGCAACAACG | 11.9 | 604 | 177 | 3.2E-11* | 1.8 | 4 | 22.1 | 1193 | 341 | 4.9E-26† | 2.0 |
| ACAGTGCAACAACA | 6.4 | 323 | 98 | 1.0E-05* | 1.7 | 4 | 22.1 | 1193 | 341 | 4.9E-26† | 2.0 |
| ACCGGGCGCTGGCA | 3.2 | 117 | 91 | 9.3E-04† | 0.62 | 5 | 3.2 | 125 | 97 | 1.1E-03‡ | 0.63 |
| GCAGTGCAACAACA | 2.6 | 141 | 27 | 1.0E-06* | 2.6 | 4 | 22.1 | 1193 | 341 | 4.9E-26† | 2.0 |
| ATAGTGAACCAACG | 1.4 | 61 | 29 | 1 | 1.0 | 2 | 24.1 | 1123 | 551 | 0.8 | 1.0 |
| ACCGTGCGCTGGCA | 1.2 | 47 | 30 | 0.3 | 0.76 | 1 | 34.6 | 1499 | 900 | 2.8E-08‡ | 0.74 |
represents haplotypes that are significantly associated with type 1 diabetes and confer increased risk
represents haplotypes that are significantly associated with type 1 diabetes and confer low risk
As shown with HLA-DR/DQ stratification (Supplemental Table 4), the diabetes association of the rs1233478 “A” allele was not due to a single HLA-DR/DQ haplotype, as 12/14 haplotypes (with at least 100 chromosomes available for analysis) have positive odds ratios. To further evaluate the association of these SNPs in the context of HLA-DR/DQ effects in addition to class I HLA effects, we used logistic regression analysis to determine if the diabetes association of the 12 SNP haplotype is independent of the classical HLA alleles. We looked at the new/replication data and the combined dataset. In the replication dataset, two of the three SNPs have an effect independent of HLA-DQB1, HLA-DRB1, HLA-B and HLA-A (rs3131020: p=2.3E-3, OR=0.73; rs1233478: p=0.4, OR=1.1; rs1592410: p=2.1E-3, OR=1.4). In the combined data, each SNP by itself has an effect independent of HLA-DQB1, HLA-DRB1, HLA-B and HLA-A (rs3131020: p=0.02, OR=0.83; rs1233478: p=4.1E-3, OR=1.3; rs1592410: p=7.3E-3, OR=1.2). A summary of these results is presented in Table 1. We also tested the 12 SNP haplotype (coded as the high risk haplotype, CAGTGCAACAAC or not, which included all other haplotypes), and found that in the combined data the haplotype does have an effect independent of HLA-DQB1, HLA-DRB1, HLA-B and HLA-A (haplotype: p=0.01, OR=1.3). In a model with the three SNPs (rs3131020, rs1233478 and rs1592410) and the 12 SNP haplotype, the final model includes the 12 SNP haplotype and rs1592410. Extending this analysis, we tested the effect of the three SNPs only (rs3131020, rs1233478 and rs1592410) and found that in the combined data, the final model includes only rs3131020 and rs1233478, not rs1592410. We performed another logistic regression analysis to test the effect of the 12 SNP haplotype with specific high risk HLA alleles, and the final model included the 12 SNP haplotype (p=0.04, OR=1.2), HLA-DQB1, HLA-DRB1, HLA-B*39 and HLA-A*24.
Motivated by these results, we studied LOC729653. There is limited data available for LOC729653 from NCBI UniGene, other than two ESTs (expressed sequence tags) found in prostate tissue. We assayed cDNA from 48 different tissues, and found that spliced LOC729653 cDNA is present at low levels in 11 tissues (Table 3). We verified these results using Taqman quantitative PCR in three separate experiments (Table 3, detailed results in Supplemental Table 5). We found that LOC729653 cDNA is present at low levels in 19 tissues (defined as expression in 3 of 3 Taqman experiments), with less consistent expression results in an additional 20 tissues (defined as expression in 1 or 2 Taqman experiments). We also tested both whole pancreas and adult pancreatic islets, and by Taqman found expression in whole pancreas but not adult pancreatic islets. We next performed a combination of sequencing and 5’ RACE to determine the actual sequence of the transcribed LOC729653 mRNA. We found that LOC729653 contains at least three exons and has an unusual 3’ UTR that includes an intron that is spliced from the cDNA. A diagram of the transcript we have identified thus far is presented in Figure 3 and the sequence we obtained is in Supplemental Figure 1. We also sequenced eight T1DGC individuals, each homozygous for one of four haplotypes across LOC729653. We found that there was only one SNP at which the two individuals homozygous for the neutral haplotype differed, and the two individuals homozygous for the first high risk haplotype also differed at this SNP, which is presented in Supplemental Table 6. The only SNP which has one allele present in all the high risk individuals and the other allele present in all the low risk and neutral individuals is rs1233478. The only coding SNP identified was rs734961, and all eight individuals were homozygous for the common allele at this SNP.
Figure 3. Diagram of the LOC729653 gene.
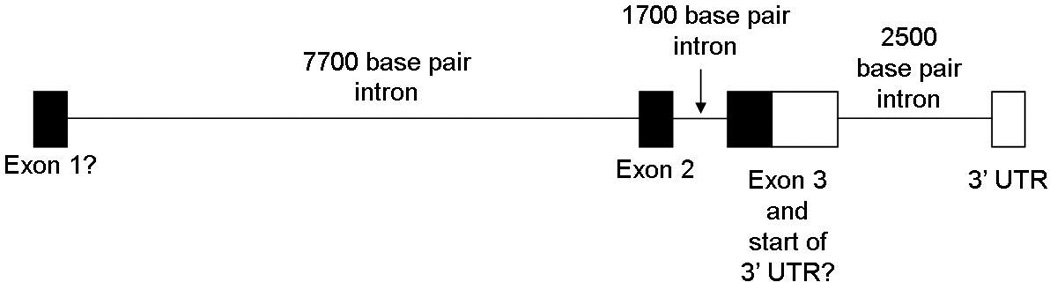
A diagram is shown of the LOC729653 gene based on the sequence obtained in this study.
Discussion
We report here the confirmation of the association of SNPs at the telomeric end of the MHC region independent of HLA alleles (rs1233478, p=2.2E-5, OR=1.4) by analyzing additional families from the T1DGC. Using haplotype analysis, we define a conserved 20,000 base pair region for high risk haplotypes which includes the transcribed gene LOC729653. We have analyzed the expression pattern of LOC729653, and find that the gene is expressed in at least 19 different tissues.
Logistic regression analysis indicated an association of SNPs within this telomeric locus independent of HLA-DQB1, HLA-DRB1, HLA-B and HLA-A (rs1233478 p=4.1E-3, OR=1.3; haplotype p=0.01, OR=1.3). Given the logistic regression analysis with multiple loci, the p-values for the SNPs and the haplotype drop drastically when correction for classical HLA alleles is applied. There are 13 HLA-DRB1, 12 HLA-DQB1, 26 HLA-B and 15 HLA-A alleles in the dataset, which adds significant complexity to the logistic regression model. Even though the odds ratio for this haplotype is only 1.3 compared to higher odds ratios for B*39 and A*24 (HLA-B*39 p=3.3E-6, OR=2.7 and HLA-A*24 p=4.5E-5, OR=1.6 in the logistic regression model with the LOC729653 haplotype, HLA-DQB1 and HLA-DRB1), this high risk haplotype is much more common (22%) than A24 (10%) or B39 (3%). This odds ratio of 1.3 for the haplotype is equivalent to or greater than most non-MHC type 1 diabetes loci [INS relative risk (RR)=1.7, PTPN22 RR=1.6, CTLA4 RR=1.15, IL2RA RR=1.1, and IFIH1 RR=0.88]17.
Although finding a similar initial association of rs1233478, another group (Nejentsev and Howson) did not find a significant association after recursive partitioning with HLA-DRB1, HLA-DQB1, HLA-B, HLA-A and HLA-DPB1 alleles22,23. These analyses used recursive partitioning with genotypes rather than actual phased chromosomal haplotypes (that can be derived from the T1DGC data due to family analysis) to model the effect of HLA-DRB1 and HLA-DQB1 genotypes, followed by conditional logistic regression for HLA-B, HLA-A and HLA-DPB1. In the current study, we utilized defined chromosomal haplotypes and thus were able to define control chromosomes (non-transmitted chromosomes), while Nejentsev and Howson studied genotypes (both chromosomes together). Analysis of genotypes limits the number of controls with the DR3/4 highest risk genotype, as it is present in only 2.4% of the general population but in 30% of type 1 diabetes patients19. Analysis of defined chromosomal haplotypes allows for ascertainment of the direct contribution of DR3 and DR4 chromosomes that are present in approximately 22% of non-transmitted chromosomes.
A recent report describes a genome-wide linkage scan in the rat39. The results of this indicate that a genomic region, termed Iddm37, is linked to susceptibility to KRV-induced diabetes in LEW.1WR1 rats. One-hundred percent of LEW.1WR1 rats develop diabetes when treated with poly I:C and injected with kilham rat virus (KRV), whereas the control strain, LEW, does not develop diabetes under these conditions. This region includes the rat UBD gene, and is homologous to the human region that contains the human UBD gene. The authors also analyzed UBD mRNA expression levels in the rat model. UBD mRNA expression in both the spleen and pancreatic lymph node is higher in the LEW.1WR1 rat than in the LEW rat both prior to poly I:C treatment and when treated with poly I:C and KRV. Another recent report has described the association of a UBD non-synonymous SNP (rs11724) with celiac disease, another autoimmune disease40. Unfortunately, this SNP was not typed by the T1DGC. However, the 3’ end of the UBD gene is only 35,159 base pairs from the centromeric end of our defined 20 kb region. One major UBD function is to direct proteins to the proteasome using E1, E2 and E3 molecules that are different from the usual ubiquitin pathway members41,42. Additionally, UBD is inducible in the setting of inflammation as IFN-γ and TNF-α are cytokines known to increase UBD expression43. Finally, UBD has an important role in dendritic cell maturation44,45 and therefore has a potential role in generating auto-reactive T-cells that recognize self-peptides39. While the 12 SNP haplotype discussed here excludes UBD gene itself, there could be potential regulatory elements in the 20 kb region that affect UBD. Additionally, the haplotypic analysis discussed here is not exhaustive given the complexity of the MHC region. There are additional SNPs in the region surrounding LOC729653 that were not genotyped by the T1DGC, and future analyses could include either imputation of these SNPs using data from the 1000 Genomes Project and the International HapMap Project or further genotyping of additional SNPs in T1DGC individuals.”
We have now established the expression of LOC729653 RNA in at least nineteen different human tissues. This includes lymph node, thymus, stomach, pancreas, bone marrow, cervix, colon, duodenum, epididymus, small intestine, fat, lung, prostate, rectum, testis, urethra, urinary bladder, vagina, and uterus. We did not find expression in human pancreatic islets. The function of this gene is at present unknown. Although several of the type 1 diabetes autoantigens [e.g. glutamate decarboxylase 1 (GAD1), chromogranin A (CHGA), and dystrophia myotonica-protein kinase (DMPK)] are widely expressed in tissues outside of pancreatic islets, lack of a restricted expression pattern (e.g. pancreatic islets or specific lymphocyte subsets) for LOC729653 makes its direct contribution to diabetes pathogenesis less clear.
Analysis of DR3/4 siblings of patients with type 1 diabetes reveals that those siblings who share two MHC haplotypes identical by descent have a risk of 80% for anti-islet autoimmunity, compared to DR3/4 siblings who do not share both MHC haplotypes identical by descent and have a risk of approximately 20%27. This suggests that non-DR/DQ MHC loci may result in a four fold increase of risk in individuals with the DR3/4 genotype. A major portion of this non-DR/DQ association with the MHC region is likely not accounted for by low-frequency HLA-B or HLA-A alleles, nor by the telomeric locus reported in this study (odds ratio after correction is 1.3). We thus believe additional studies with direct sequencing of multiple HLA haplotypes and an additional in depth study of the MHC is essential to better define the genetics of type 1A diabetes.
Supplementary Material
Significant findings of the study.
The current study identifies a telomeric region of the MHC that is associated with type 1 diabetes independent of HLA alleles. We have identified a transcribed gene of unknown function as a candidate.
What this study adds
This study not only confirms our prior association study of a telomeric type 1 diabetes locus but identifies a gene candidate.
References
- 1.Wellcome Trust Case Control Consortium. Genome-wide association study of 14,000 cases of seven common diseases and 3,000 shared controls. Nature. 2007;447:661–678. doi: 10.1038/nature05911. [DOI] [PMC free article] [PubMed] [Google Scholar]
- 2.Cooper JD, Smyth DJ, Smiles AM, et al. Meta-analysis of genome-wide association study data identifies additional type 1 diabetes risk loci. Nat Genet. 2008;40:1399–1401. doi: 10.1038/ng.249. [DOI] [PMC free article] [PubMed] [Google Scholar]
- 3.Concannon P, Erlich HA, Julier C, et al. Type 1 diabetes: evidence for susceptibility loci from four genome-wide linkage scans in 1,435 multiplex families. Diabetes. 2005;54:2995–3001. doi: 10.2337/diabetes.54.10.2995. [DOI] [PubMed] [Google Scholar]
- 4.Steck AK, Baschal EE, Jasinski JM, et al. rs2476601 T allele (R620W) defines high-risk PTPN22 type I diabetes-associated haplotypes with preliminary evidence for an additional protective haplotype. Genes Immun. 2009;10(Suppl 1):S21–S26. doi: 10.1038/gene.2009.87. [DOI] [PMC free article] [PubMed] [Google Scholar]
- 5.Pugliese A, Zeller M, Fernandez A, Jr, et al. The insulin gene is transcribed in the human thymus and transcription levels correlated with allelic variation at the INS VNTR-IDDM2 susceptibility locus for type 1 diabetes. Nat Genet. 1997;15:293–297. doi: 10.1038/ng0397-293. [DOI] [PubMed] [Google Scholar]
- 6.Spielman RS, McGinnis RE, Ewens WJ. Transmission test for linkage disequilibrium: the insulin gene region and insulin-dependent diabetes mellitus (IDDM) Am J Hum Genet. 1993;52:506–516. [PMC free article] [PubMed] [Google Scholar]
- 7.Bottini N, Musumeci L, Alonso A, et al. A functional variant of lymphoid tyrosine phosphatase is associated with type I diabetes. Nat Genet. 2004;36:337–338. doi: 10.1038/ng1323. [DOI] [PubMed] [Google Scholar]
- 8.Zheng W, She JX. Genetic association between a lymphoid tyrosine phosphatase (PTPN22) and type 1 diabetes. Diabetes. 2005;54:906–908. doi: 10.2337/diabetes.54.3.906. [DOI] [PubMed] [Google Scholar]
- 9.Qu HQ, Bradfield JP, Grant SF, Hakonarson H, Polychronakos C. Remapping the type I diabetes association of the CTLA4 locus. Genes Immun. 2009;10(Suppl 1):S27–S32. doi: 10.1038/gene.2009.88. [DOI] [PMC free article] [PubMed] [Google Scholar]
- 10.Ueda H, Howson JM, Esposito L, et al. Association of the T-cell regulatory gene CTLA4 with susceptibility to autoimmune disease. Nature. 2003;423:506–511. doi: 10.1038/nature01621. [DOI] [PubMed] [Google Scholar]
- 11.Smyth DJ, Cooper JD, Bailey R, et al. A genome-wide association study of nonsynonymous SNPs identifies a type 1 diabetes locus in the interferon-induced helicase (IFIH1) region. Nat Genet. 2006;38:617–619. doi: 10.1038/ng1800. [DOI] [PubMed] [Google Scholar]
- 12.Todd JA, Walker NM, Cooper JD, et al. Robust associations of four new chromosome regions from genome-wide analyses of type 1 diabetes. Nat Genet. 2007;39:857–864. doi: 10.1038/ng2068. [DOI] [PMC free article] [PubMed] [Google Scholar]
- 13.Nejentsev S, Walker N, Riches D, Egholm M, Todd JA. Rare variants of IFIH1, a gene implicated in antiviral responses, protect against type 1 diabetes. Science. 2009;324:387–389. doi: 10.1126/science.1167728. [DOI] [PMC free article] [PubMed] [Google Scholar]
- 14.Vella A, Cooper JD, Lowe CE, et al. Localization of a type 1 diabetes locus in the IL2RA/CD25 region by use of tag single-nucleotide polymorphisms. Am J Hum Genet. 2005;76:773–779. doi: 10.1086/429843. [DOI] [PMC free article] [PubMed] [Google Scholar]
- 15.Qu HQ, Bradfield JP, Belisle A, Grant SF, Hakonarson H, Polychronakos C. The type I diabetes association of the IL2RA locus. Genes Immun. 2009;10(Suppl 1):S42–S48. doi: 10.1038/gene.2009.90. [DOI] [PMC free article] [PubMed] [Google Scholar]
- 16.Howson JM, Walker NM, Smyth DJ, Todd JA. Analysis of 19 genes for association with type I diabetes in the Type I Diabetes Genetics Consortium families. Genes Immun. 2009;10(Suppl 1):S74–S84. doi: 10.1038/gene.2009.96. [DOI] [PMC free article] [PubMed] [Google Scholar]
- 17.Barrett JC, Clayton DG, Concannon P, et al. Genome-wide association study and meta-analysis find that over 40 loci affect risk of type 1 diabetes. Nat Genet. 2009 doi: 10.1038/ng.381. [DOI] [PMC free article] [PubMed] [Google Scholar]
- 18.She JX. Susceptibility to type I diabetes: HLA-DQ and DR revisited. Immunol Today. 1996;17:323–329. doi: 10.1016/0167-5699(96)10014-1. [DOI] [PubMed] [Google Scholar]
- 19.Rewers M, Bugawan TL, Norris JM, et al. Newborn screening for HLA markers associated with IDDM: diabetes autoimmunity study in the young (DAISY) Diabetologia. 1996;39:807–812. doi: 10.1007/s001250050514. [DOI] [PubMed] [Google Scholar]
- 20.Noble JA, Valdes AM, Bugawan TL, Apple RJ, Thomson G, Erlich HA. The HLA class I A locus affects susceptibility to type 1 diabetes. Hum Immunol. 2002;63:657–664. doi: 10.1016/s0198-8859(02)00421-4. [DOI] [PMC free article] [PubMed] [Google Scholar]
- 21.Valdes AM, Erlich HA, Noble JA. Human leukocyte antigen class I B and C loci contribute to Type 1 Diabetes (T1D) susceptibility and age at T1D onset. Hum Immunol. 2005;66:301–313. doi: 10.1016/j.humimm.2004.12.001. [DOI] [PMC free article] [PubMed] [Google Scholar]
- 22.Nejentsev S, Howson JM, Walker NM, et al. Localization of type 1 diabetes susceptibility to the MHC class I genes HLA-B and HLA-A. Nature. 2007;450:887–892. doi: 10.1038/nature06406. [DOI] [PMC free article] [PubMed] [Google Scholar]
- 23.Howson JM, Walker NM, Clayton D, Todd JA. Confirmation of HLA class II independent type 1 diabetes associations in the major histocompatibility complex including HLA-B and HLA-A. Diabetes Obes Metab. 2009;11(Suppl 1):31–45. doi: 10.1111/j.1463-1326.2008.01001.x. [DOI] [PMC free article] [PubMed] [Google Scholar]
- 24.Baschal EE, Aly TA, Babu SR, et al. HLA-DPB1*0402 protects against type 1A diabetes autoimmunity in the highest risk DR3-DQB1*0201/DR4-DQB1*0302 DAISY population. Diabetes. 2007;56:2405–2409. doi: 10.2337/db07-0029. [DOI] [PubMed] [Google Scholar]
- 25.Noble JA, Valdes AM, Cook M, Klitz W, Thomson G, Erlich HA. The role of HLA class II genes in insulin-dependent diabetes mellitus: molecular analysis of 180 Caucasian, multiplex families. Am J Hum Genet. 1996;59:1134–1148. [PMC free article] [PubMed] [Google Scholar]
- 26.Noble JA, Valdes AM, Thomson G, Erlich HA. The HLA class II locus DPB1 can influence susceptibility to type 1 diabetes. Diabetes. 2000;49:121–125. doi: 10.2337/diabetes.49.1.121. [DOI] [PubMed] [Google Scholar]
- 27.Aly TA, Ide A, Jahromi MM, et al. Extreme genetic risk for type 1A diabetes. Proc Natl Acad Sci U S A. 2006;103:14074–14079. doi: 10.1073/pnas.0606349103. [DOI] [PMC free article] [PubMed] [Google Scholar]
- 28.Aly TA, Baschal EE, Jahromi MM, et al. Analysis of single nucleotide polymorphisms identifies major type 1A diabetes locus telomeric of the major histocompatibility complex. Diabetes. 2008;57:770–776. doi: 10.2337/db07-0900. [DOI] [PubMed] [Google Scholar]
- 29.Brown WM, Pierce J, Hilner JE, et al. Overview of the MHC fine mapping data. Diabetes Obes Metab. 2009;11(Suppl 1):2–7. doi: 10.1111/j.1463-1326.2008.00997.x. [DOI] [PMC free article] [PubMed] [Google Scholar]
- 30.Mychaleckyj JC, Noble JA, Moonsamy PV, et al. HLA genotyping in the international Type 1 Diabetes Genetics Consortium. Clinical Trials. 2010;7:S75–S87. doi: 10.1177/1740774510373494. [DOI] [PMC free article] [PubMed] [Google Scholar]
- 31.O'Connell JR, Weeks DE. PedCheck: a program for identification of genotype incompatibilities in linkage analysis. Am J Hum Genet. 1998;63:259–266. doi: 10.1086/301904. [DOI] [PMC free article] [PubMed] [Google Scholar]
- 32.Abecasis GR, Cherny SS, Cookson WO, Cardon LR. Merlin--rapid analysis of dense genetic maps using sparse gene flow trees. Nat Genet. 2002;30:97–101. doi: 10.1038/ng786. [DOI] [PubMed] [Google Scholar]
- 33.Raum D, Awdeh Z, Yunis EJ, Alper CA, Gabbay KH. Extended major histocompatibility complex haplotypes in type I diabetes mellitus. J Clin Invest. 1984;74:449–454. doi: 10.1172/JCI111441. [DOI] [PMC free article] [PubMed] [Google Scholar]
- 34.Thomson G. Mapping disease genes: family-based association studies. Am J Hum Genet. 1995;57:487–498. [PMC free article] [PubMed] [Google Scholar]
- 35.Baschal EE, Aly TA, Jasinski JM, et al. The frequent and conserved DR3-B8-A1 extended haplotype confers less diabetes risk than other DR3 haplotypes. Diabetes Obes Metab. 2009;11(Suppl 1):25–30. doi: 10.1111/j.1463-1326.2008.01000.x. [DOI] [PMC free article] [PubMed] [Google Scholar]
- 36.Rubinstein P, Walker M, Carpenter C, et al. Genetics of HLA-disease associations. The use of the haplotype relative risk (hrr) and the "haplo-delta" (Dh) estimates in juvenile diabetes from three racial groups. Hum Immunol. 1981;3:384. [Google Scholar]
- 37.Barrett JC, Fry B, Maller J, Daly MJ. Haploview: analysis and visualization of LD and haplotype maps. Bioinformatics. 2005;21:263–265. doi: 10.1093/bioinformatics/bth457. [DOI] [PubMed] [Google Scholar]
- 38.Gabriel SB, Schaffner SF, Nguyen H, et al. The structure of haplotype blocks in the human genome. Science. 2002;296:2225–2229. doi: 10.1126/science.1069424. [DOI] [PubMed] [Google Scholar]
- 39.Blankenhorn EP, Cort L, Greiner DL, Guberski DL, Mordes JP. Virus-induced autoimmune diabetes in the LEW.1WR1 rat requires Iddm14 and a genetic locus proximal to the major histocompatibility complex. Diabetes. 2009;58:2930–2938. doi: 10.2337/db09-0387. [DOI] [PMC free article] [PubMed] [Google Scholar]
- 40.Castellanos-Rubio A, Santin I, Irastorza I, et al. A regulatory single nucleotide polymorphism in the ubiquitin D gene associated with celiac disease. Hum Immunol. 2010;71:96–99. doi: 10.1016/j.humimm.2009.09.359. [DOI] [PubMed] [Google Scholar]
- 41.Chiu YH, Sun Q, Chen ZJ. E1-L2 activates both ubiquitin and FAT10. Mol Cell. 2007;27:1014–1023. doi: 10.1016/j.molcel.2007.08.020. [DOI] [PubMed] [Google Scholar]
- 42.Kalveram B, Schmidtke G, Groettrup M. The ubiquitin-like modifier FAT10 interacts with HDAC6 and localizes to aggresomes under proteasome inhibition. J Cell Sci. 2008;121:4079–4088. doi: 10.1242/jcs.035006. [DOI] [PubMed] [Google Scholar]
- 43.Raasi S, Schmidtke G, de GR, Groettrup M. A ubiquitin-like protein which is synergistically inducible by interferon-gamma and tumor necrosis factor-alpha. Eur J Immunol. 1999;29:4030–4036. doi: 10.1002/(SICI)1521-4141(199912)29:12<4030::AID-IMMU4030>3.0.CO;2-Y. [DOI] [PubMed] [Google Scholar]
- 44.Bates EE, Ravel O, Dieu MC, et al. Identification and analysis of a novel member of the ubiquitin family expressed in dendritic cells and mature B cells. Eur J Immunol. 1997;27:2471–2477. doi: 10.1002/eji.1830271002. [DOI] [PubMed] [Google Scholar]
- 45.Ebstein F, Lange N, Urban S, Seifert U, Kruger E, Kloetzel PM. Maturation of human dendritic cells is accompanied by functional remodelling of the ubiquitin-proteasome system. Int J Biochem Cell Biol. 2009;41:1205–1215. doi: 10.1016/j.biocel.2008.10.023. [DOI] [PubMed] [Google Scholar]
Associated Data
This section collects any data citations, data availability statements, or supplementary materials included in this article.