

Abstract
Single-molecule fluorescence imaging is often incompatible with physiological protein concentrations, as fluorescence background overwhelms an individual molecule's signal. We solve this problem with a new imaging approach called PhADE (PhotoActivation, Diffusion, and Excitation). A protein of interest is fused to a photoactivatable protein (mKikGR) and introduced to its surface-immobilized substrate. After photoactivation of mKikGR near the surface, rapid diffusion of the unbound mKikGR fusion out of the detection volume eliminates background fluorescence, whereupon the bound molecules are imaged. We labeled the eukaryotic DNA-replication protein Flap endonuclease 1 (Fen1) with mKikGR and added it to replication-competent Xenopus laevis egg extracts. PhADE imaging of high concentrations of the fusion construct revealed its dynamics and micrometer-scale movements on individual, replicating DNA molecules. Because PhADE imaging is in principle compatible with any photoactivatable fluorophore, it should have broad applicability in revealing single-molecule dynamics and stoichiometry of macromolecular protein complexes at previously inaccessible fluorophore concentrations.
Introduction
The imaging of individual, fluorescently-labeled macromolecules and their interactions with substrates or binding partners reveals aspects of biochemical reactions that are inaccessible in ensemble experiments1. However, single-molecule fluorescence experiments are only possible when less than one fluorescent molecule is present per light diffraction-limited detection volume, corresponding to a maximum concentration of ~1 nM. Total internal reflection (TIR) fluorescence microscopy can be used to confine the illuminated volume to a ~100-nm thin layer at a glass-water interface. Nevertheless, the highest concentration of fluorescent molecules compatible with TIR fluorescence microscopy is ~10 nM, far less than the Kd for many biochemical interactions2. The illuminated volume can be further reduced in the far field in technically demanding approaches such as 4Pi and stimulated emission depletion (STED) microscopy3,4. Alternatively, the sample volume itself may be drastically limited5,6. However, the latter strategies preclude visualizing micrometer-scale motions. In summary, a generally applicable method is lacking to allow single-molecule imaging of biological macromolecules at physiologically-relevant concentrations.
In this paper, we describe a novel imaging scheme called PhADE (PhotoActivation, Diffusion, and Excitation), which increases the useful concentration range of single-molecule fluorescence i m aging by at least two orders of magnitude and allows single-molecule visualization at physiological concentrations. We validated this method in a challenging environment for single-molecule studies, an undiluted cell-free extract of Xenopus egg, to visualize individual DNA-replication complexes. This approach revealed the micrometer-scale movement of replication forks, the pattern of replication initiation along DNA molecules, and the dynamics of individual proteins at replication forks.
Results
In PhADE (Fig. 1a), a protein of interest is fused to the photo-convertible protein mKikGR7. The fusion protein is introduced into a microfluidic flow cell containing a binding partner or substrate that has been immobilized on the surface (Fig. 1a). In its ground state, mKikGR fluoresces green (mKikG) upon excitation with 488-nm light (Supplementary Fig. 1a). After illumination with a pulse of 405-nm light, the green form of the fluorophore is converted or “activated” to a spectrally distinct form (mKikR) that fluoresces red upon excitation with 568-nm light (Supplementary Fig. 1). Using total internal reflection (TIR) microscopy, mKikG is selectively converted to mKikR near the surface of the flow cell (Fig. 1a). Any mKikR molecules not bound to the binding partner diffuse out of the TIR illumination volume and are diluted by diffusion-driven exchange with non-activated protein (Fig. 1a). Finally, the mKikR molecules retained by the binding partner are imaged with 568-nm TIR excitation until they dissociate or photobleach (Fig. 1a).
Figure 1. Experimental design and validation of PhADE.

(a) Cartoon depicting the three steps of the PhADE imaging scheme. (b) 6-his-mKikGR bound to α-6-his antibody (substrate), which was immobilized on a surface via a biotin-streptavidin interaction, was imaged in the presence of 2 μM 6-his-mKikGR in solution. mKikG was imaged using 488-nm light (“pre”). Next, mKikR was imaged with 568-nm light before (“0 s”) and after photoactivation with 405-nm (panels 1 s to 5 s) using the pulse sequence shown above. White arrow highlights an on-off intensity change indicative of a single mKikR molecule. Scale bar: 1 μm.
To validate PhADE, a solution of 2 μM 6xhis-tagged mKikGR was drawn into a flow cell coated with a low density of surface-immobilized anti-6xhis antibody. As expected, TIR imaging of mKikG with 488-nm light resulted in saturated images, and imaging with 568-nm light before photoactivation failed to reveal any mKikR (Fig. 1b). However, after 405-nm activation of mKikG to mKikR and diffusion, discrete signals of mKikR were detected with a high signal-to-background ratio (Fig. 1b). The quantized on and off intensity changes confirm that signals correspond to single molecules (Fig. 1b). The photophysical properties of mKikGR allow a highly efficient conversion of immobilized mKikG to mKikR under our illumination conditions and the majority of mKikGR can be photoconverted (Supplementary Fig. 2a–c). Thus, PhADE can efficiently detect individual proteins bound to substrate in a highly concentrated solution of the labeled protein of interest.
We next wanted to apply PhADE to study a complex biochemical reaction. We chose eukaryotic DNA replication, which begins at thousands of chromosomal sites called origins8. In the G1 phase of the cell cycle, pre-replication complexes (pre-RCs) are assembled at origins. In S phase, cyclin-dependent kinase (CDK) converts pre-RCs into a pair of replisomes that copy DNA in opposite directions, giving rise to a replication `bubble' that consists of two double-stranded daughter DNA molecules. Unlike the leading strand, which is synthesized continuously, the lagging strand is made discontinuously from short, RNA-primed DNA segments called Okazaki fragments9. When the polymerase at the growing 3′ end of one Okazaki fragment encounters the 5′ end of another Okazaki fragment, it performs strand-displacement synthesis, creating a 5′ flap containing the primer. The processivity factor PCNA then helps recruit a flap endonuclease (Fen1), which cleaves the flap. Several rounds of displacement synthesis and flap cleavage leave a ligatable nick9. Using DNA-fiber techniques10, researchers have visualized eukaryotic DNA replication intermediates on individual strands of DNA, but no dynamic, single-molecule imaging of this process has been reported.
Eukaryotic DNA replication occurs with high efficiency in soluble, cell-free extracts of Xenopus eggs11. Performing conventional single-molecule imaging in such a system is challenging because fluorescent proteins would have to be added at high concentrations to effectively compete with their endogenous counterparts, which are very abundant (100s of nM to μM; Supplementary Fig. 3a; ref. 12). We reasoned that PhADE might overcome this problem, since it allows single-molecule imaging at high fluorophore concentrations.
To apply PhADE to eukaryotic DNA replication, λ DNA (48.5 kbp; contour length 16.3 μm) was stretched to ~80% of its contour length and attached at both ends to the bottom surface of a microfluidic flow cell (Fig. 2a). Next, a high speed supernatant (HSS) of crude Xenopus laevis egg lysate was introduced that assembles pre-RCs in a sequence-nonspecific manner13. After 20 minutes, HSS is replaced with nucleoplasmic extract (NPE), which promotes DNA replication (Fig. 2a)11,14. The immobilized DNA replicates efficiently, and multiple replication bubbles can be visualized via immuno-fluorescent detection of incorporated digoxigenin-dUTP (dig-dUTP) (Fig. 2a) or labeling of dsDNA with an intercalating dye (SYTOX Orange) whose fluorescence intensity doubles at replicated regions (Fig. 2a)15. To implement PhADE, we prepared a fusion of the flap endonuclease Fen1 with mKikGR (Supplementary Fig. 3b) and confirmed that it interacted specifically with PCNA16 (Supplementary Fig. 3c), cleaved 5′ flap DNA17,18 (Supplementary Fig. 3d), and, like endogenous Fen1, was able to function in the maturation of Okazaki fragments into a continuous lagging strand (Supplementary Fig. 3e–i).
Figure 2. PhADE imaging of Fen1KikR visualizes the growth of individual replication bubbles.
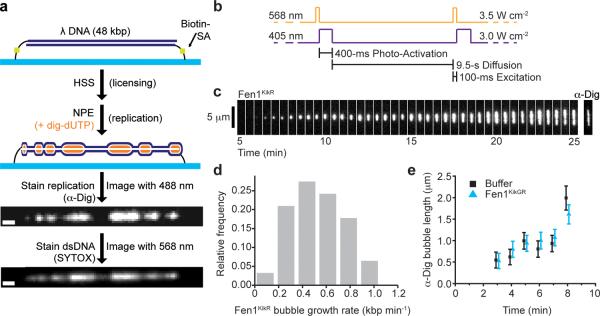
(a) Scheme for replication of surface-immobilized λ DNA by Xenopus egg extracts and detection of replication bubbles. λ DNA is attached to the bottom surface of a flow cell at both ends. Next, the DNA is licensed with HSS. Replication is promoted with NPE supplemented with dig-dUTP and, for PhADE imaging, Fen1KikGR. After real-time imaging of Fen1KikR (see below), the extracts are removed, and replicated DNA is stained with α-Dig and/or SYTOX Orange. Scale bar: 1 μm. (b) PhADE sequence used to visualize the growth of D179A Fen1KikR-labeled replication bubbles. (c) Replication was carried out in the presence of 4 μM D179A Fen1KikGR and Dig-dUTP under conditions of limited origin firing (Supplementary Fig. 4a–b). Between 5 and 25 minutes after the first NPE addition, D179A Fen1KikR was imaged every 10 s using PhADE. A sample kymograph shows every third frame of a replication bubble growing over time. After the last PhADE cycle, replicated DNA was stained with α-Dig. (d) Histogram of bubble growth rates tracked between 5 and 25 minutes displays a mean of 520 ± 220 bp min−1 (± s.d.), (n = 62 events from 3 independent experiments). (e) Average length of replication bubbles as measured by α-Dig staining, in the presence (blue triangles) or absence (black squares) of 2 μM D179A Fen1KikGR. Mean ± error estimate (see Online Methods). See also Supplementary Table 1.
For PhADE imaging of replication in the flow cell, NPE was supplemented with 2–4 μM Fen1KikGR. For most experiments, we used a nuclease-deficient mutant of Fen1KikGR (D179A Fen1KikGR; Supplementary Fig. 3d) to minimize the potential for nucleolytic damage to the tethered DNA. At a concentration of 2–4 μM, D179A Fen1KikGR should compete with endogenous Fen1, which is present in the replication reaction at ~1 μM (Supplementary Fig. 3a). For the initial PhADE experiments, origin firing was restricted to ~1 event per λ-phage to prevent merging of neighboring replication bubbles (Supplementary Fig. 4a–b) 11,15. Once replication began, we performed cycles of PhADE imaging at 10-second intervals (Fig. 2b). A kymograph of the images revealed a growing, linear tract of D179A Fen1KikR that coincided with replicated DNA (Fig. 2c and Supplementary Video 1). The high intensity of the signals at an excitation power 10-fold lower than necessary to image single molecules (Fig. 1b) suggests that many molecules of D179A Fen1KikGR were bound along the length of each replication bubble. Nevertheless, PhADE imaging of Fen1KikR greatly increased the contrast of features that were barely distinguishable using TIR fluorescence imaging of Fen1KikG (Supplementary Fig. 4c–d). The growth of 62 D179A Fen1KikR bubbles imaged using the PhADE regime in Figure 2b was tracked, revealing a mean growth rate of 520 ± 220 (± s.d.) bp min−1 (Fig. 2d), in agreement with previous estimates of the replication fork rate in egg extracts (ref. 15 and references therein). We verified that these PhADE imaging conditions supported the visualization of the replication reaction for at least 12 minutes without slowing growth (Supplementary Fig. 4e).
The binding of Fen1KikGR along the entire length of replication bubbles was unexpected, since Okazaki-fragment maturation is only thought to occur immediately behind the replication fork9,19. This phenomenon was explained by the fact that high concentrations of Fen1KikGR induced the retention of PCNA on DNA, effectively creating a continuous tract of Fen1KikGR docking sites (Supplementary Fig. 4f–g). Importantly, since 2 μM D179A Fen1KikGR does not detectably alter ensemble replication kinetics (Supplementary Fig. 4h) or single-molecule bubble growth (Fig. 2e and Supplementary Table 1), Fen1KikGR PhADE is a valid means to visualize the dynamics of replication bubbles.
We next used D179A Fen1KikGR PhADE to follow replication when origin firing was unrestricted. Starting 2.5 minutes after NPE addition, iterative PhADE cycles as depicted in Figure 2b revealed the global, time-resolved pattern of replication on individual λ DNAs (Fig. 3a and Supplementary Video 2). We verified that all replication bubbles were detected with PhADE (Supplementary Fig. 5a–b). Based on these PhADE movies, we quantified the timing and spacing of replication initiation events reported by Fen1KikR signals that appear, increase in intensity and then in size (Fig. 3a; see Online Methods for criteria). Initiations detected by Fen1KikGR peaked 6 minutes after addition of NPE (Fig. 3b and Supplementary Fig. 5c). Above the resolution limit of 0.5 μm, the distribution of inter-origin distances was well-fitted by an exponential decay (Fig. 3c), suggesting that origin spacing is random at these length scales. Strikingly, the cumulative inter-origin distance measured by PhADE declined to 3.0 ± 1.0 kbp (0.79 ± 0.27 μm) by 10 minutes (Fig. 3d and Supplementary Fig. 5d), which is ~2.5 fold smaller than values reported previously for plasmids or sperm chromatin replicating in Xenopus laevis egg extracts20–25. The data in Figures 2 and 3 demonstrate that PhADE can be used to monitor the movement of molecular machines over micrometer-scale distances at high fluorophore concentration.
Figure 3. During unperturbed replication, PhADE imaging of Fen1KikR reveals a high density of initiations.

(a) Replication of λ DNA during unrestricted origin firing was monitored by PhADE imaging (as in Fig. 2b) of 2 μM D179A Fen1KikGR and displayed as a kymograph. White arrows indicate initiations. (b) PhADE kymographs as in Figure 3a were analyzed to determine the mean number of origins firing each minute (black) or cumulatively (orange) per λ DNA (n = 12 λ DNA). Similar results were obtained in a second extract (Supplementary Fig. 5c). (c) PhADE kymographs as in Figure 3a were analyzed to determine the distance between adjacent initiations over time. Black bars, reliable resolution limit (> 0.5 μm). Orange lines, single exponential decay fit to bars > 0.5 μm. (d) The mean inter-origin distance as determined from 12 replicating λ DNA molecules followed via D179A Fen1KikR PhADE declines over time. Mean ± error estimate (see Online Methods). Similar results were obtained in a second extract (Supplementary Fig. 5d).
We next wanted to know whether PhADE could detect single molecules of Fen1 at the DNA replication fork. We therefore supplemented replication reactions with 125 or 250 nM wild-type Fen1KikGR and performed PhADE at higher illumination intensity (Fig. 4a). At these reduced concentrations, discrete foci of mKikR fluorescence were observed that co-localized with the ends of replication bubbles (Fig. 4b–c). A comparison of the foci's fluorescence intensity to immobilized Biotin-KikGR, revealed that at 125 nM wild-type Fen1KikGR most foci correspond to single molecules (Fig. 4c). At 250 nM Fen1KikGR, multiple molecules are found within foci (Fig. 4b). Importantly, at concentrations of Fen1KikGR that would be compatible with conventional TIR fluorescence imaging (10 nM)2, no signal was detected on the DNA, demonstrating the need to perform PhADE under these conditions (Supplementary Fig. 6a). In contrast, ΔPIP Fen1KikGR, which is deficient for PCNA-binding (Supplementary Fig. 3c), bound replication bubbles much less efficiently than wild-type Fen1KikGR (Supplementary Fig. 6b). Thus, PhADE imaging is able to detect the specific binding of single Fen1KikR molecules to the replisome, to estimate their stoichiometry, and to distinguish the properties of wild-type and mutant proteins.
Figure 4. PhADE reveals single molecules of Fen1KikGR at replication forks and measures Fen1KikGR off rate from DNA.

(a) Imaging sequence for Figure 4b–c. (b) Replication in the presence of 0.25 μM WT Fen1KikGR. (top) A representative kymograph of Fen1KikR on λ DNA imaged every 10 s. After the final round of PhADE, replication bubbles and DNA were detected. 132 Fen1KikR foci were localized to 113 replication bubbles. Scale bar: 1 μm. (bottom) Intensity histogram of Fen1KikR foci on bubbles (black) versus single molecules of biotin-mKikR (gray). (c) As in Figure 4b but using 0.125 μM WT Fen1KikGR. 112 Fen1KikR foci were found on 129 replication bubbles. (d) DNA was replicated in the presence of 0.125 μM wild-type Fen1KikGR and Fen1KikR was imaged as in Supplementary Figure 7a before (first frame) and after photoactivation (frames 2–6). Afterwards, replication bubbles and DNA were detected. Scale bar: 1 μm. (e) The duration of wild-type Fen1KikR binding at replication bubbles is compared to the fluorescence on times of immobilized Biotin-mKikR. (wild-type Fen1KikR: mean ± s.d. of 3 experiments, n = 40 events; Biotin-mKikGR: mean ± s.d. of 6 experiments, n = 1,165 events, points are fit to a mono-exponential decay). (f) DNA was replicated in the presence of 2 μM WT Fen1KikGR. Fen1KikR was photoactivated once (black triangle) and imaged once a minute as depicted in Supplementary Figure 7c. Scale bar: 1 μm. (g) Normalized, integrated intensity of the region in Figure 4f (squares) is compared to Biotin-mKikR photobleaching (solid line) under the same imaging conditions. Biexponential fit (dashed line) reveals a mean life-time of 0.7 ± 0.3 min for Fen1KikGR on DNA.
To measure the dissociation rate of Fen1 from replication forks, Fen1KikGR was photoactivated, and the number of frames that Fen1KikR molecules persisted on DNA (“on time”) when imaged once per minute was determined. To this end, we used iterative PhADE cycles to both efficiently activate new molecules and to keep previously activated Fen1KikR in the fluorescent state (Supplementary Fig. 7a–b). The on time of Fen1KikR was clearly less than that of a Biotin-mKikR standard immobilized through binding to streptavidin (Fig. 4d–e). The data suggest that the half-life of single molecules of Fen1KikR at replication forks is less than one minute. This time is similar to the half-life of Fen1KikR on DNA at 2 μM Fen1KikGR, which is 30 – 40 s (Fig. 4f–g). Thus, PhADE imaging can be used not only to measure the steady-state levels of proteins in a macromolecular complex, but also their off-rate from the complex.
Discussion
We introduce a new approach called PhADE that exploits localized photoactivation and diffusion to perform single-molecule imaging at high concentrations of the labeled species of interest. PhADE represents a powerful means to achieve quantitative labeling and imaging of a fluorescent reactant with high signal to noise over a broad range of concentrations. The high concentration regime will be indispensable for single-molecule studies of proteins with weak affinities for their targets and in cases where fluorescent protein must compete with its endogenous counterpart (Supplementary Fig. 6a). Factors that dissociate and re-associate rapidly can be imaged with repeated rounds of PhADE. Off rates can be determined with a single round of photoactivation followed by repeated imaging of the activated form. The arrival of new reactant to the substrate as a function of time elapsed between photoactivations will give access to on rates. Further, PhADE imaging allows the measurement of the number of fluorescently-labeled proteins in a macromolecular complex over time. In principle, PhADE can be applied to the study of any biochemical reaction involving high reactant concentrations, provided one reaction partner is immobilized on a surface.
While mKikGR has excellent photoactivation properties, it is important to consider the suitability of mKikGR as a fluorescent tag to study protein dynamics. We showed that Fen1KikGR suppresses an apparent defect in Okazaki-fragment processing, indicating that mKikGR does not adversely affect Fen1 function. However, at μM concentrations, Fen1KikGR enhanced chromatin-association of Fen1's binding partner PCNA. This effect allowed us to use Fen1 as a marker for replicated DNA. Notably, a high concentration of recombinant Fen1–6his did not stabilize PCNA (Supplementary Fig. 4g), indicating this effect was due to mKikGR. Because mKikGR is reported to be a monomer7,26, and the off rates for Fen1KikR at the high and low concentration regimes were similar (Fig. 4), we consider it unlikely that PCNA was stabilized due to dimerization of Fen1KikGR molecules bound to adjacent PCNA subunits. Instead, the bulkiness of the mKikGR tag might interfere with a protein-protein interaction important for PCNA dissociation. In summary, mKikGR fusions can function normally, but whether subtle aspects of protein dynamics are affected can be difficult to ascertain, as is the case for all tagged proteins.
Our results have important implications for the measurement of replication initiation. Notably, the random spacing and asynchronous firing of origins revealed by PhADE generally agrees with previous results from static single-molecule imaging approaches21–25,27, except that we observed a 2–3 fold higher frequency of initiation events. The discrepancy with previous data sets is unlikely to be due to incomplete chromatinization of our doubly-tethered DNA templates (Supplementary Fig. 8a–b and Supplementary Table 2). Importantly, a re-analysis of our dynamic data in a static fashion (by only considering individual frames from PhADE movies) resulted in minimum center-to-center distance among replication bubbles that agrees with the previously published data (7.5 ± 1.0 kbp; Supplementary Fig. 5a). The difference between the dynamic and static data sets is thus independent of the particular conditions under which replication is carried out. Rather, as previously anticipated27, merging of replication bubbles and late-firing origins render more than 50% of initiations invisible to conventional DNA combing approaches that analyze a single time point.
Our data also bear on the mechanism of Okazaki-fragment processing. If the 30–40 s on time of Fen1KikGR accurately reflects the behavior of endogenous Fen1 (see above), the data are consistent with the proposal that a single Fen1 remains associated with PCNA and polymerase δ through multiple rounds of flap cleavage28.
Our work along with recent work on RNA splicing is among the first to use single-molecule fluorescence techniques to study macromolecular complexes in cell-free extracts29,30. While we supplemented Fen1KikGR to extracts containing endogenous Fen1, the endogenous protein can also potentially be immunodepleted (Supplementary Fig. 3e–i). In genetically tractable cell-free systems (e.g., yeast), the endogenous protein can potentially either be replaced by an mKikGR fusion or genetically depleted via a degron tag. Single-molecule studies in cell-free systems have the potential to yield novel biochemical insights into complex cellular pathways, and PhADE overcomes a fundamental barrier to their use in a new and accessible way.
It should be possible to perform PhADE with a broad range of photoactivatable fluorophores. Ideally, PhADE probes should have high quantum yields and high extinction coefficients of photoactivation and fluorescence, as such properties speed up activation and minimize exposure of the sample to light. The probes must also have high switching yields to be compatible with use at high concentrations31. Optimizing photostability by decreasing photobleaching rates will aid single-molecule tracking. Finally, pairs of fluorophores that are switched by the same wavelength yet whose fluorescence spectra are distinct would allow for dual-color PhADE. Strong candidates for improved fluorophores are the azido-push-pull fluorogens32 and Cy3-Cy5 hetero-dimers33,34. Single-molecule high-resolution fluorescence imaging techniques including photoactivated localization microscopy (PALM), fluorescence photoactivation localization microscopy (FPALM), and stochastic optical reconstruction microscopy (STORM) already rely on and are driving further innovations in photoswitchable fluorescent probes35 that will likely be employable in PhADE.
Supplementary Material
Acknowledgements
We thank H. Yardimci and J.J. Loparo for assistance with experiments and critical reading of the manuscript. We thank C.G. Havens (Harvard University) for sharing advice and reagents. This work was supported by grants from the National Institutes of Health (NIH) (GM077248), American Cancer Society (RSG0823401GMC), and the Netherlands Organization for Scientific Research (NWO; Vici 680-47-607) to A.M.v.O, and grants from the NIH (GM62267) and American Cancer Society (RSG0823401GMC) to J.C.W. A.B.L was supported by NIH and National Institute of General Medical Sciences Molecular Biophysics Training Grant T32 GM008313.
Footnotes
Author Contributions A.B.L performed all experiments. A.M.v.O. and S.H. designed the microscope. A.B.L, A.M.v.O., and J.C.W. designed experiments and performed data analysis. A.B.L, A.M.v.O., and J.C.W. prepared the manuscript.
Competing financial interests The authors declare no competing financial interests.
References
- 1.Joo C, Balci H, Ishitsuka Y, Buranachai C, Ha T. Advances in single-molecule fluorescence methods for molecular biology. Annu. Rev. Biochem. 2008;77:51–76. doi: 10.1146/annurev.biochem.77.070606.101543. [DOI] [PubMed] [Google Scholar]
- 2.van Oijen AM. Single-molecule approaches to characterizing kinetics of biomolecular interactions. Curr. Opin. Biotechnol. 2011;22:75–80. doi: 10.1016/j.copbio.2010.10.002. [DOI] [PubMed] [Google Scholar]
- 3.Klar TA, Hell SW. Subdiffraction resolution in far-field fluorescence microscopy. Opt. Lett. 1999;24:954–956. doi: 10.1364/ol.24.000954. [DOI] [PubMed] [Google Scholar]
- 4.Hell S, Stelzer EHK. Properties of a 4Pi confocal fluorescence microscope. J. Opt. Soc. Am. A. 1992;9:2159–2166. [Google Scholar]
- 5.Levene MJ, et al. Zero-mode waveguides for single-molecule analysis at high concentrations. Science. 2003;299:682–686. doi: 10.1126/science.1079700. [DOI] [PubMed] [Google Scholar]
- 6.Boukobza E, Sonnenfeld A, Haran G. Immobilization in surface-tethered lipid vesicles as a new tool for single biomolecule spectroscopy. J. Phys. Chem. B. 2001;105:12165–12170. [Google Scholar]
- 7.Habuchi S, Tsutsui H, Kochaniak AB, Miyawaki A, van Oijen AM. mKikGR, a monomeric photoswitchable fluorescent protein. PLoS ONE. 2008;3:e3944. doi: 10.1371/journal.pone.0003944. [DOI] [PMC free article] [PubMed] [Google Scholar]
- 8.Masai H, Matsumoto S, You Z, Yoshizawa-Sugata N, Oda M. Eukaryotic chromosome DNA replication: Where, when, and how? Annu. Rev. Biochem. 2010;79:89–130. doi: 10.1146/annurev.biochem.052308.103205. [DOI] [PubMed] [Google Scholar]
- 9.Burgers PMJ. Polymerase dynamics at the eukaryotic DNA replication fork. J. Biol. Chem. 2009;284:4041–4045. doi: 10.1074/jbc.R800062200. [DOI] [PMC free article] [PubMed] [Google Scholar]
- 10.Herrick J, Bensimon A. Introduction to Molecular Combing: Genomics, DNA Replication, and Cancer. In: Vengrova S, Dalgaard JZ, editors. Methods in Molecular Biology, DNA Replication. Vol. 5. Humana Press; Totowa, NJ: 2009. pp. 71–101. [DOI] [PubMed] [Google Scholar]
- 11.Walter J, Sun L, Newport J. Regulated chromosomal DNA replication in the absence of a nucleus. Mol. Cell. 1998;1:519–529. doi: 10.1016/s1097-2765(00)80052-0. [DOI] [PubMed] [Google Scholar]
- 12.Strausfeld UP, et al. Cip1 blocks the initiation of DNA replication in Xenopus extracts by inhibition of cyclin-dependent kinases. Curr. Biol. 1994;4:876–883. doi: 10.1016/s0960-9822(00)00196-2. [DOI] [PubMed] [Google Scholar]
- 13.Blow JJ. Control of chromosomal DNA replication in the early Xenopus embryo. EMBO J. 2001;20:3293–3297. doi: 10.1093/emboj/20.13.3293. [DOI] [PMC free article] [PubMed] [Google Scholar]
- 14.Lebofsky R, Takahashi T, Walter JC. DNA replication in nucleus-free Xenopus egg extracts. Methods Mol. Biol. 2009;521:229–252. doi: 10.1007/978-1-60327-815-7_13. [DOI] [PubMed] [Google Scholar]
- 15.Yardimci H, Loveland AB, Habuchi S, van Oijen AM, Walter JC. Uncoupling of sister replisomes during eukaryotic DNA replication. Mol. Cell. 2010;40:834–840. doi: 10.1016/j.molcel.2010.11.027. [DOI] [PMC free article] [PubMed] [Google Scholar]
- 16.Gary R, Kim K, Cornelius HL, Park MS, Matsumoto Y. Proliferating Cell Nuclear Antigen facilitates excision in long-patch base excision repair. J. Biol. Chem. 1999;274:4354–4363. doi: 10.1074/jbc.274.7.4354. [DOI] [PubMed] [Google Scholar]
- 17.Harrington JJ, Lieber MR. The characterization of a mammalian DNA structure-specific endonuclease. EMBO J. 1994;13:1235–1246. doi: 10.1002/j.1460-2075.1994.tb06373.x. [DOI] [PMC free article] [PubMed] [Google Scholar]
- 18.Shen B, Nolan JP, Sklar LA, Park MS. Functional analysis of point mutations in human flap endonuclease-1 active site. Nucleic Acids Res. 1997;25:3332–3338. doi: 10.1093/nar/25.16.3332. [DOI] [PMC free article] [PubMed] [Google Scholar]
- 19.Blow JJ, Laskey RA. Initiation of DNA replication in nuclei and purified DNA by a cell-free extract of Xenopus eggs. Cell. 1986;47:577–587. doi: 10.1016/0092-8674(86)90622-7. [DOI] [PubMed] [Google Scholar]
- 20.Walter J, Newport JW. Regulation of replicon size in Xenopus egg extracts. Science. 1997;275:993–995. doi: 10.1126/science.275.5302.993. [DOI] [PubMed] [Google Scholar]
- 21.Herrick J, Stanislawski P, Hyrien O, Bensimon A. Replication fork density increases during DNA synthesis in X. laevis egg extracts. J. Mol. Biol. 2000;300:1133–1142. doi: 10.1006/jmbi.2000.3930. [DOI] [PubMed] [Google Scholar]
- 22.Lucas I, Chevrier-Miller M, Sogo JM, Hyrien O. Mechanisms ensuring rapid and complete DNA replication despite random initiation in Xenopus early embryos. J. Mol. Biol. 2000;296:769–786. doi: 10.1006/jmbi.2000.3500. [DOI] [PubMed] [Google Scholar]
- 23.Blow JJ, Gillespie PJ, Francis D, Jackson DA. Replication origins in Xenopus egg extract are 5–15 kb apart and are activated in clusters that fire at different times. J. Cell. Biol. 2001;152:15–26. doi: 10.1083/jcb.152.1.15. [DOI] [PMC free article] [PubMed] [Google Scholar]
- 24.Marheineke K, Hyrien O. Control of replication origin density and firing time in Xenopus egg extracts. J. Biol. Chem. 2004;279:28071–28081. doi: 10.1074/jbc.M401574200. [DOI] [PubMed] [Google Scholar]
- 25.Marheineke K, Hyrien O. Aphidicolin triggers a block to replication origin firing in Xenopus egg extracts. J. Biol. Chem. 2001;276:17092–17100. doi: 10.1074/jbc.M100271200. [DOI] [PubMed] [Google Scholar]
- 26.Ridelis I, et al. Use of Kikume green-red fusions to study the influence of pharmacological chaperones on trafficking of G protein-coupled receptors. FEBS Lett. 2012;586:784–791. doi: 10.1016/j.febslet.2012.01.043. [DOI] [PubMed] [Google Scholar]
- 27.Herrick J, Jun S, Bechhoefer J, Bensimon A. Kinetic model of DNA replication in eukaryotic organisms. J. Mol. Biol. 2002;320:741–750. doi: 10.1016/s0022-2836(02)00522-3. [DOI] [PubMed] [Google Scholar]
- 28.Ayyagari R, Gomes XV, Gordenin DA, Burgers PMJ. Okazaki fragment maturation in yeast. I. Distribution of functions between FEN1 and DNA2. J. Biol. Chem. 2003;278:1618–1625. doi: 10.1074/jbc.M209801200. [DOI] [PubMed] [Google Scholar]
- 29.Hoskins AA, Gelles J, Moore MJ. New insights into the spliceosome by single molecule fluorescence microscopy. Curr. Opin. Chem. Biol. 2011;15:864–870. doi: 10.1016/j.cbpa.2011.10.010. [DOI] [PMC free article] [PubMed] [Google Scholar]
- 30.Jain A, et al. Probing cellular protein complexes using single-molecule pull-down. Nature. 2011;473:484–488. doi: 10.1038/nature10016. [DOI] [PMC free article] [PubMed] [Google Scholar]
- 31.Thompson MA, Biteen JS, Lord SJ, Conley NR, Moerner WE. Molecules and Methods for Super-Resolution Imaging. In: Walter NG, editor. Single Molecule Tools, Part B:Super-Resolution, Particle Tracking, Multiparameter, and Force Based Methods. Vol. 2. Academic Press; 2010. pp. 27–59. [DOI] [PMC free article] [PubMed] [Google Scholar]
- 32.Lord SJ, et al. Azido push-pull fluorogens photoactivate to produce bright fluorescent labels. J. Phys. Chem. B. 2010;114:14157–14167. doi: 10.1021/jp907080r. [DOI] [PMC free article] [PubMed] [Google Scholar]
- 33.Bates M, Blosser TR, Zhuang X. Short-range spectroscopic ruler based on a single-molecule optical switch. Phys. Rev. Lett. 2005;94:108101. doi: 10.1103/PhysRevLett.94.108101. [DOI] [PMC free article] [PubMed] [Google Scholar]
- 34.Conley NR, Biteen JS, Moerner WE. Cy3-Cy5 covalent heterodimers for single-molecule photoswitching. J. Phys. Chem. B. 2008;112:11878–11880. doi: 10.1021/jp806698p. [DOI] [PMC free article] [PubMed] [Google Scholar]
- 35.Patterson G, Davidson M, Manley S, Lippincott-Schwartz J. Superresolution imaging using single-molecule localization. Annu. Rev. Phys. Chem. 2010;61:345–367. doi: 10.1146/annurev.physchem.012809.103444. [DOI] [PMC free article] [PubMed] [Google Scholar]
Associated Data
This section collects any data citations, data availability statements, or supplementary materials included in this article.