

Abstract
Common microarray and next-generation sequencing data analysis concentrate on tumor subtype classification, marker detection, and transcriptional regulation discovery during biological processes by exploring the correlated gene expression patterns and their shared functions. Genetic regulatory network (GRN) based approaches have been employed in many large studies in order to scrutinize for dysregulation and potential treatment controls. In addition to gene regulation and network construction, the concept of the network modulator that has significant systemic impact has been proposed, and detection algorithms have been developed in past years. Here we provide a unified mathematic description of these methods, followed with a brief survey of these modulator identification algorithms. As an early attempt to extend the concept to new RNA regulation mechanism, competitive endogenous RNA (ceRNA), into a modulator framework, we provide two applications to illustrate the network construction, modulation effect, and the preliminary finding from these networks. Those methods we surveyed and developed are used to dissect the regulated network under different modulators. Not limit to these, the concept of “modulation” can adapt to various biological mechanisms to discover the novel gene regulation mechanisms.
1. Introduction
With the development of microarray [1] and lately the next generation sequencing techniques [2], transcriptional profiling of biological samples, such as tumor samples [3–5] and samples from other model organisms, have been carried out in order to study sample subtypes at molecular level or transcriptional regulation during the biological processes [6–8]. While common data analysis methods employ hierarchical clustering algorithms or pattern classification to explore correlated genes and their functions, the genetic regulatory network (GRN) approaches were employed to scrutinize for dysregulation between different tumor groups or biological processes (see reviews [9–12]).
To construct the network, most of research is focused on methods based on gene expression data derived from high-throughput technologies by using metrics such as Pearson or Spearman correlation [13], mutual information [14], co-determination method [15, 16], Bayesian methods [17, 18], and probabilistic Boolean networks [19]. Recently, new transcriptional regulation via competitive endogenous RNA (ceRNAs) has been proposed [20, 21], introducing additional dimension in modeling gene regulation. This type of regulation requires the knowledge of microRNA (miRNA) binding targets [22, 23] and the hypothesis of RNA regulations via competition of miRNA binding. Common GRN construction tries to confine regulators to be transcription factor (TF) proteins, a primary transcription programming machine, which relies on sequence-specific binding sites at target genes' promoter regions. In contrast, ceRNAs mediate gene regulation via competing miRNAs binding sites in target 3′UTR region, which exist in >50% of mRNAs [22, 24]. In this study, we will extend the current network construction methods by incorporating regulation via ceRNAs.
In tumorigenesis, gene mutation is the main cause of the cancer [25]. The mutation may not directly reflect in the change at the gene expression level; however, it will disrupt gene regulation [26–28]. In Hudson et al., they found that mutated myostatin and MYL2 showed different coexpressions when comparing to wild-type myostatin. Chun et al. also showed that oncogenic KRAS modulates HIF-1α and HIF-2α target genes and in turn modulates cancer metabolism. Stelniec-Klotz et al. presented a complex hierarchical model of KRAS modulated network followed by double perturbation experiments. Shen et al. [29] showed a temporal change of GRNs modulated after the estradiol stimulation, indicating important role of estrogen in modulating GRNs. Functionally, modulation effect of high expression of ESR1 was also reported by Wilson and Dering [30] where they studied previously published microarray data with cells treated with hormone receptor agonists and antagonists [31–33]. In this study, a comprehensive review of existing algorithms to uncover the modulators was provided. Given either mutation or protein expression status was unknown under many of reported studies, the problem of how to partition the diverse samples with different conditions, such as active or inactive oncogene status (and perhaps a combination of multiple mutations), and the prediction of a putative modulator of gene regulation remains a difficult task.
By combining gene regulation obtained from coexpression data and ceRNAs, we report here an early attempt to unify two systems mathematically while assuming a known modulator, estrogen receptor (ER). By employing the TCGA [3] breast tumor gene expressions data and their clinical test result (ER status), we demonstrate the approach of obtaining GRN via ceRNAs and a new presentation of ER modulation effects. By integrating breast cancer data into our unique ceRNAs discovery website, we are uniquely positioned to further explore the ceRNA regulation network and further develop the discovery algorithms in order to detect potential modulators of regulatory interactions.
2. Models of Gene Regulation and Modulation
2.1. Regulation of Gene Expression
The complex relationships among genes and their products in a cellular system can be studied using genetic regulatory networks (GRNs). The networks model the different states or phenotypes of a cellular system. In this model, the interactions are commonly modeled as regulator-target pairs with edges between regulator and target pair representing their interaction direction, as shown in Figure 1(a). In this model a target gene is a gene whose expression can be altered (activated or suppressed) by a regulator gene. This definition of a target gene implies that any gene can be at some point a target gene or a direct or indirect regulator depending on its position in the genetic regulatory network. The regulator gene is a gene that controls (activates or suppresses) its target genes' expression. The consequences of these activated (or suppressed) genes sometimes are involved in specific biological functions, such as cell proliferation in cancer. Examples of regulator-target pair in biology are common. For example, a target gene CDCA7 (cell division cycle-associated protein 7) is a c-Myc (regulator) responsive gene, and it is part of c-Myc-mediated transformation of lymphoblastoid cells. Furthermore, as shown in Figure 1(b), a regulator gene can also act as a target gene if there exists an upstream regulator.
Figure 1.
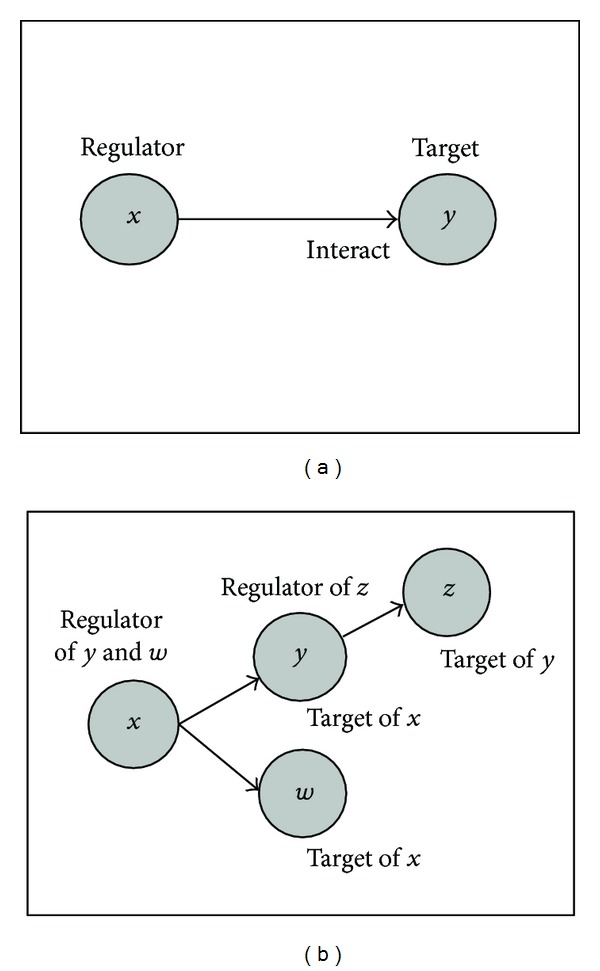
Regulator-target pair in genetic regulatory network model: (a) basic regulator-target pair and (b) regulator-target complex.
If the interaction is modeled after Boolean network (BN) model [34], then
| (1) |
where each regulator x j ∈ {0,1} is a binary variable, as well as it is target y i. As described by (1), the target y i at time t + 1 is completely determined by the values of its regulators at time t by means of a Boolean function f i ∈ F, where F is a collection of Boolean functions. Thus, the Boolean network G(V, F) is defined as a set of nodes (genes) V = {x 1, x 2,…, x n} and a list of functions (edges or interactions) F = {f 1, f 2, …, f n}. Similarly such relationship can be defined in the framework of Bayesian network where the similar regulators-target relationship as defined in (1) can be modeled by the distribution
| (2) |
where Parents(y i(t + 1)) = {x j1(t),…,x j k(t), y i(t)} is the set of regulators, or parents, of y i, P(y i(t + 1) | Parents (y i(t + 1))) is the conditional distribution defining the regulator-target relationship, and P(Parents(y i(t + 1))) models the prior distribution of regulators. Unlike in (1), the target and regulators in (2) are modeled as random variables. Despite of this difference, in both (1) and (2), the target is always a function (or conditional distribution) of the regulator (or parents). When the relationship is defined by a Boolean function as in (1), the conditional distribution in (2) take the form of a binomial distribution (or a multinomial distribution when both regulators and target take more than two states). Other distributions such as the Gaussian and Poisson can be introduced to model more complex relationships than the Boolean. The network construction, inference, and control, however, are beyond the scope of this paper, and we leave the topics to the literatures [9, 35, 36].
The interactions among genes and their products in a complex cellular process of gene expression are diverse, governed by the central dogma of molecular biology [37]. There are different regulation mechanisms that can actuate during different stages. Figure 2 shows three different cases of regulation of gene expression. Figure 2(a) shows the case of regulation of expression in which a transcription factor (TF) regulates the expression of a protein-coding gene (in dark grey) by binding to the promoter region of target gene y.Figure 2(b) is the case of regulation at the protein level in which a ligand protein interacts with a receptor to activate relay molecules to transduce outside signals directly into cell behavior. Figure 2(c) is the case of regulation at the RNA level in which one or more miRNAs regulate target mRNA y by translational repression or target transcript degradation via binding to sequence-specific binding sites (called miRNA response elements or MREs) in 3′UTR region. As illustrated in Figure 2(c), the target genes/proteins all contain a domain of binding or docking site, enabling specific interactions between regulator-target pairs, a common element in network structure.
Figure 2.
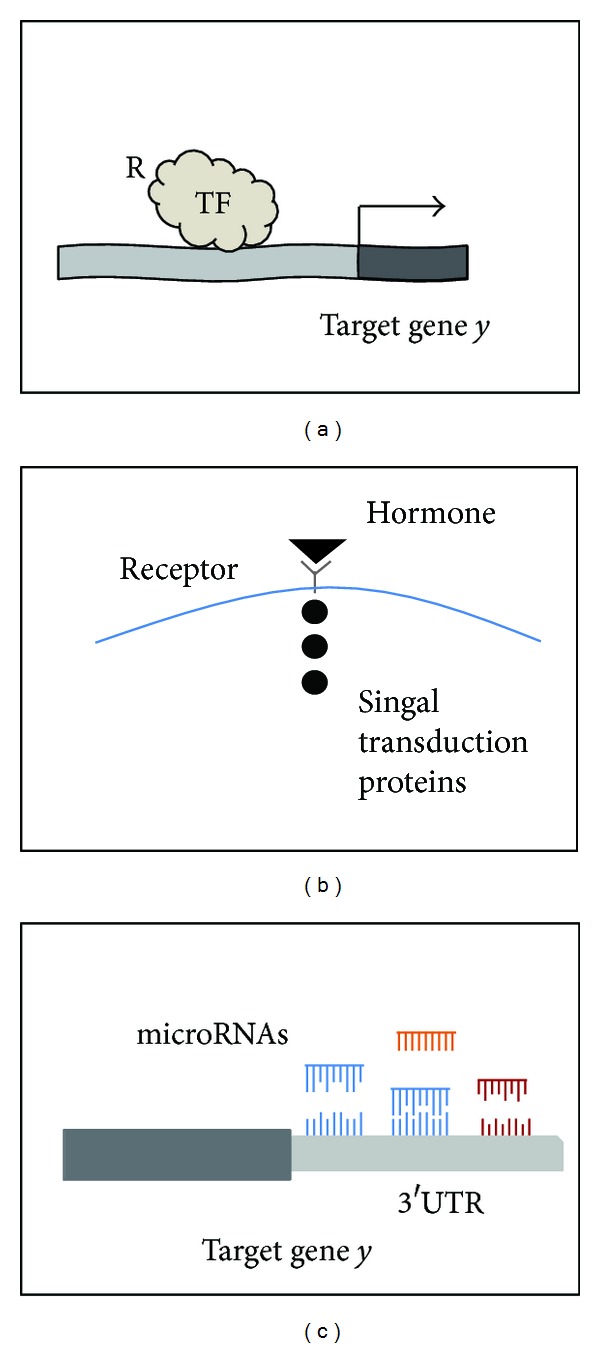
Three different cases of regulation of gene expression that share the network representation of a regulator target interaction.
2.2. Modulation of Gene Regulation
Different from the concept of a coregulator commonly referred in the regulatory biology, a modulator denotes a gene or protein that is capable of altering the endogenous gene expression at one stage or time. In the context of this paper, we specifically define a modulator to be a gene that can systemically influence the interaction of regulator-target pair, either to activate or suppress the interaction in the presence/absence of the modulator. One example of modulator is the widely studied estrogen receptor (ER) in breast cancer studies [38–40]; the ER status determines not only the tumor progression, but also the chemotherapy treatment outcomes. It is well known that binding of estrogen to receptor facilitates the ER activities to activate or repress gene expression [41], thus effectively modulating the GRN. Figure 3 illustrates the model of the interaction between a modulator (m) and a regulator (x) target (y) pair that it modulates.
Figure 3.
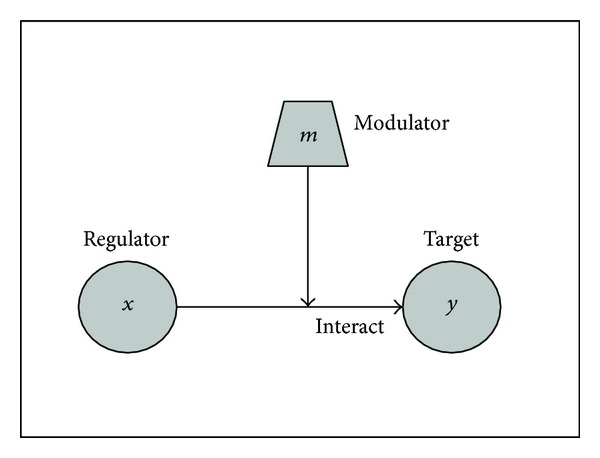
Graphical representation of the triplet interaction of regulator x, target y, and modulator m.
Following the convention used in (1) and (2), the modulation interaction in Figure 3 can be modeled by
| (3) |
where y represents target expression, x represents the parents (regulators) of target y, and ℱ (m)(·) is the regulation function modulated by m. When ℱ (m)(·) is stochastic, the relationship is modeled by the conditional distribution as
| (4) |
where p(y | x, m) models the regulator-target relationship modulated by m and p(x | m) defines the prior distribution of regulators (parents) expression modulated by m. Different distribution models can be used to model different mechanisms for modulation. At the biological level, there are different mechanisms for modulation of the interaction x-y, and currently several algorithms for prediction of the modulators has been developed. This survey presents the latest formulations and algorithms for prediction of modulators.
3. Survey of Algorithms of Gene Regulation and Modulation Discovery
During the past years, many computational tools have been developed for regulation network construction, and then depending on the hypothesis, modulator concept can be tested and extracted. Here we will focus on modulator detection algorithms (MINDy, Mimosa, GEM, and Hermes). To introduce gene-gene interaction concept, we will also briefly discuss algorithms for regulation network construction (ARACNE) and ceRNA identification algorithm (MuTaMe).
3.1. ARACNE (Algorithm for the Reconstruction of Accurate Cellular Networks)
ARACNE [14, 42] is an algorithm that extracts transcriptional networks from microarray data by using an information-theoretic method to reduce the indirect interactions. ARACNE assumes that it is sufficient to estimate 2-way marginal distributions, when sample size M > 100, in genomics problems, such that
| (5) |
Or a candidate interaction can be identified using estimation of mutual information MI of genes x and y, MI(x, y) = MIxy, where MIxy = 1 if genes x and y are identical, and MIxy is zero if p(x, y) = p(x)p(y), or x and y are statistically independent. Specifically, the estimation of mutual information of gene expressions x and y of regulator and target genes is done by using the Gaussian kernel estimator. The ARACNE takes additional two steps to clean the network: (1) removing MI if its P value is less than that derived from two independent genes via random permutation and (2) data processing inequality (DPI). The algorithm further assumes that for a triplet gene (g x, g y, g z), where g x regulates g z, through g y, then
| (6) |
where → represents regulation relationship. In other words, the lowest mutual information MIx,z is from an indirect interaction and thus shall be removed from the GRN by ARACNE in the DPI step. A similar algorithm was proposed [43] to utilize conditional mutual information to explore more than 2 regulators.
3.2. MINDy (Modulator Inference by Network Dynamics)
Similar to ARACNE, MINDy is also an information-theoretic algorithm [44]. However, MINDy aims to identify potential transcription factor-(TF-target) gene pairs that can be modulated by a candidate modulator. MINDy assumes that the expressions of the modulated TF-target pairs are of different correlations under different expression state of the modulator. For simplicity and computational consideration, MINDy considers only two modulator expression states, that is, up- (m = 1) or down-expression (m = 0). Then, it tests if the expression correlations of potential TF-target pairs are significantly different for modulator up-expression versus down-expression. The modulator dependent correlation is assessed by the conditional mutual information (CMI) or I(x, y | m = 0) and I(x, y | m = 1). Similar to ARACNE, the CMI is calculated using the Gaussian kernel estimator. To test if a pair of TF (y) and target (x) is modulated by m, the CMI difference can be calculated as
| (7) |
The pair is determined to be modulated if ΔI ≠ 0. The significance P values for ΔI ≠ 0 is computed using permutation tests.
3.3. Mimosa
Similarly to MINDy, Mimosa [45] was proposed to identify modulated TF-target pairs. However, it does not preselect a set of modulators of interest but rather aims to also search for the modulators. Mimosa also assumes that a modulator takes only two states, that is, absence and presence or 0 and 1. The modulated regulator-target pair is further assumed to be correlated when a modulator is present but uncorrelated when it is absent. Therefore, the distribution of a modulated TF-target pair, x and y, naturally follows a mixture distribution
| (8) |
where π is the probability of the modulator being absent. Particularly, an uncorrelated and correlated bivariant Gaussian distributions were introduced to model different modulated regulator-target relationship, such that
| (9a) |
| (9b) |
where α models the correlation between x and y when the modulator is present. With this model, Mimosa sets out to fit the samples of every pair of potential regulator target with the mixture model (7). This is equivalent to finding a partition of the paired expression samples into the correlated and uncorrelated samples. The paired expression samples that possess such correlated-uncorrelated partition (0.3 < π < 0.7 and | α | >0.8) are determined to be modulated. To identify the modulator of a (or a group of) modulated pair(s), a weighted t-test was developed to search for the genes whose expressions are differentially expressed in the correlated partition versus the uncorrelated partition.
3.4. GEM (Gene Expression Modulator)
GEM [46] improves over MINDy by predicting how a modulator-TF interaction affects the expression of the target gene. It can detect new types of interactions that result in stronger correlation but low ΔI, which therefore would be missed by MINDy. GEM hypothesizes that the correlation between the expression of a modulator m and a target x must change, as that of the TF x changes. Unlike the previous surveyed algorithms, GEM first transforms the continuous expression levels to binary states (up- (1) or down-expression (0)) and then works only with discrete expression states. To model the hypothesized relationship, the following model is proposed:
| (10) |
where α c is a constant, α m and α y model the effect of modulator and TF on the target genes, and γ represents the effect of modulator-TF interaction on the target gene. If the modulator-TF interaction has an effect on x, then γ will be nonzero. For a given (x, y, m) triplets GEM devised an algorithm to estimate the model coefficients in (10) and a test to determine if γ is nonzero, or m is a modulator of x and y.
3.5. MuTaMe (Mutually Targeted MRE Enrichment)
The goal of MuTaMe [21] is to identify ceRNA networks of a gene of interest (GoI) or mRNA that share miRNA response elements (MREs) of same miRNAs. Figure 4 shows two mRNAs, where one is the GoIy and the other is a candidate ceRNA or modulator m. In the figure, the miRNA represented in color red has MREs in both mRNA y and mRNA m; in this case the presence of mRNA m will start the competition with y for miRNA represented in color red.
Figure 4.
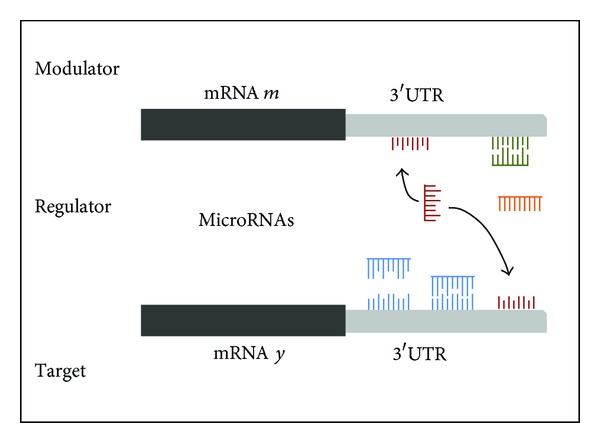
Modulation of gene regulation by competing mRNAs.
The hypothesis of MuTaMe is that mRNAs that have many of the same MREs can regulate each other by competing for miRNAs binding. The input of this algorithm is a GoI, which is targeted by a group of miRNAs known to the user. Then, from a database of predicted MREs for the entire transcriptome, it is possible to obtain the binding sites and its predicted locations in the 3′UTR for all mRNAs. This data is used to generate scores for each mRNA based on several features:
the number of miRNAs that an mRNA m shares with the GoI y;
the density of the predicted MREs for the miRNA; it favors the cases in which more MREs are located in shorter distances;
the distribution of the MREs for every miRNA; it favors situations in which the MREs tend to be evenly distributed;
the number of MREs predicted to target m; it favors situations where each miRNA contains more MREs in m.
Then each candidate transcript m will be assigned a score that results from multiplying the scores in (a) to (d). This score indicates the likelihood of the candidates to be ceRNAs and will be used to predict ceRNAs.
3.6. Hermes
Hermes [20] is an extension of MINDy that infers candidate modulators of miRNA activity from expression profiles of genes and miRNAs of the same samples. Hermes makes inferences by estimating the MI and CMI. However, different from MINDy (7), Hermes extracts the dependences of this triplet by studying the difference between the CMI of x expression and y expression conditional on the expression of m and the MI of x and y expressions as follows:
| (11) |
These quantities and their associated statistical significance can be computed from collections of expression of genes with number of samples 250 or greater. Hermes expands MINDy by providing the capacity to identify candidate modulator genes of miRNAs activity. The presence of these modulators (m) will affect the relation between the expression of the miRNAs targeting a gene (x) and the expression level of this gene (x).
In summary, we surveyed some of the most popular algorithms for the inference of modulator. Additional modulator identification algorithms are summarized in Table 1. It is worth noting that the concept of modulator applies to cases beyond discussed in this paper. Such example includes the multilayer integrated regulatory model proposed in Yan et al. [49], where the top layer of regulators could be also considered as “modulators.”
Table 1.
Gene regulation network and modulator identification methods.
| Algorithm | Features | References |
|---|---|---|
| ARACNE | Interaction network constructed via mutual information (MI). | [14, 42] |
| Network profiler | A varying-coefficient structural equation model (SEM) to represent the modulator-dependent conditional independence between genes. | [47] |
| MINDy | Gene-pair interaction dependency on modulator candidates by using the conditional mutual information (CMI). | [44] |
| Mimosa | Search for modulator by partition samples with a Gaussian mixture model. | [45] |
| GEM | A probabilistic method for detecting modulators of TFs that affect the expression of target gene by using a priori knowledge and gene expression profiles. | [46] |
| MuTaMe | Based on the hypothesis that shared MREs can regulate mRNAs by competing for microRNAs binding. | [21] |
| Hermes | Extension of MINDy to include microRNAs as candidate modulators by using CMI and MI from expression profiles of genes and miRNAs of the same samples. | [20] |
| ERα
modulator |
Analyzes the interaction between TF and target gene conditioned on a group of specific modulator genes via a multiple linear regression. | [48] |
4. Applications to Breast Cancer Gene Expression Data
Algorithms of utilizing modulator concept have been implemented in various software packages. Here we will discuss two new applications, MEGRA and TraceRNA, implemented in-house specifically to utilize the concept of differential correlation coefficients and ceRNAs to construct a modulated GRN with a predetermined modulator. In the case of MGERA, we chose estrogen receptor, ESR1, as the initial starting point, since it is one of the dominant and systemic factor in breast cancer; in the case of TraceRNA, we also chose gene ESR1 and its modulated gene network. Preliminary results of applications to TCGA breast cancer data are reported in the following 2 sections.
4.1. MGERA
The Modulated Gene Regulation Analysis algorithm (MGERA) was designed to explore gene regulation pairs modulated by the modulator m. The regulation pairs can be identified by examining the coexpression of two genes based on Pearson correlation (similar to (7) in the context of correlation coefficient). Fisher transformation is adopted to normalize the correlation coefficients biased by sample sizes to obtain equivalent statistical power among data with different sample sizes. Statistical significance of difference in the absolute correlation coefficients between two genes is tested by the student t-test following Fisher transformation. For the gene pairs with significantly different coefficients between two genes, active and deactive statuses are identified by examining the modulated gene expression pairs (MGEPs). The MGEPs are further combined to construct the m modulated gene regulation network for a systematic and comprehensive view of interaction under modulation.
To demonstrate the ability of MGERA, we set estrogen receptor (ER) as the modulator and applied the algorithm to TCGA breast cancer expression data [3] which contains 588 expression profiles (461 ER+ and 127 ER−). By using P value <0.01 and the difference in the absolute Pearson correlation coefficients >0.6 as criteria, we identified 2,324 putative ER+ MGEPs, and a highly connected ER+ modulated gene regulation network was constructed (Figure 5). The top ten genes with highest connectivity was show in Table 2. The cysteine/tyrosine-rich 1 gene (CYYR1), connected to 142 genes, was identified as the top hub gene in the network and thus may serve as a key regulator under ER+ modulation. Gene Ontology analysis of CYYR1 and its connected neighbor genes revealed significant association with extracellular matrix, epithelial tube formation, and angiogenesis.
Figure 5.
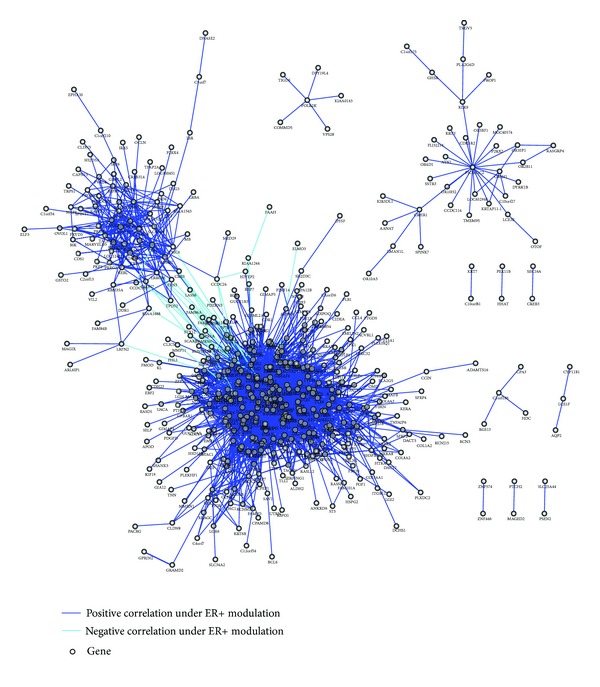
ER+ modulated gene regulation network.
Table 2.
Hub genes derived from modulated gene regulation network (Figure 5).
| Gene | Number of ER+ MGEPs |
|---|---|
| CYYR1 | 142 |
| MRAS | 109 |
| C9orf19 | 95 |
| LOC339524 | 93 |
| PLEKHG1 | 92 |
| FBLN5 | 91 |
| BOC | 91 |
| ANKRD35 | 89 |
| FAM107A | 83 |
| C16orf77 | 73 |
4.2. TraceRNA
To identify the regulation network of ceRNAs for a GoI, we developed a web-based application TraceRNA presented earlier in [50] with extension to regulation network construction. The analysis flow chart of TraceRNA was shown in Figure 6. For a selected GoI, the GoI binding miRNAs (GBmiRs) were derived either validated miRNAs from miRTarBase [51] or predicted miRNAs from SVMicrO [52]. Then mRNAs (other than the given GoI) also targeted by GBmiRs were identified as the candidates of ceRNAs. The relevant (or tumor-specific) gene expression data were used to further strengthen relationship between the ceRNA candidates and GoI. The candidate ceRNAs which coexpressed with GoI were reported as putative ceRNAs. To construct the gene regulation network via GBmiRs, we set each ceRNA as the secondary GoI, and the ceRNAs of these secondary GoIs were identified by applying the algorithm recursively. Upon identifying all the ceRNAs, the regulation network of ceRNAs of a given GoI was constructed.
Figure 6.
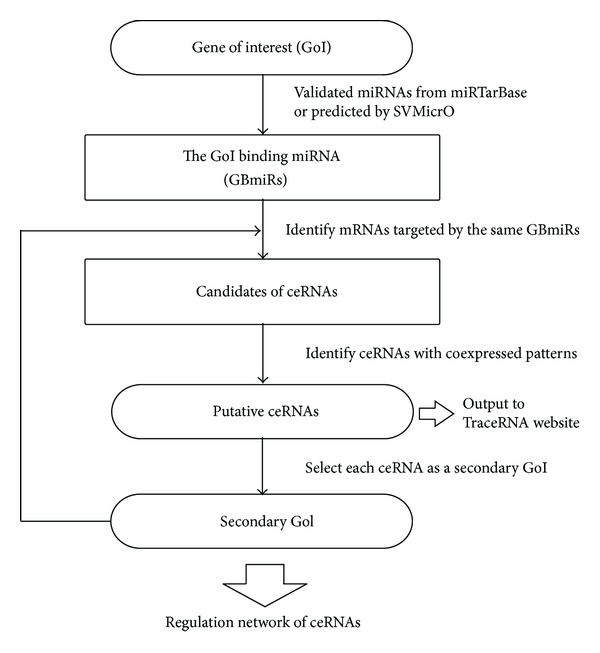
The analysis flow chart of TraceRNA.
To identify ceRNA candidates, three miRNAs binding prediction algorithms, SiteTest, SVMicrO, and BCMicrO, were used in TracRNA. SiteTest is an algorithm similar to MuTaMe and uses UTR features for target prediction. SVMicrO [52] is an algorithm that uses a large number of sequence-level site as well as UTR features including binding secondary structure, energy, and conservation, whereas BCMicrO [53] employs a Bayesian approach that integrates predictions from 6 popular algorithms including TargetScan, miRanda, PicTar, mirTarget, PITA, and DIANA-microT. Pearson correlation coefficient was used to test the coexpression between the GoI and the candidate ceRNAs. We utilized TCGA breast cancer cohort [3] as the expression data, by using 60% of GBmiRs as common miRNAs and Pearson correlation coefficient >0.9 as criteria. The final scores of putative ceRNAs (see Table 3, last column) were generated by using Borda merging method which rerank the sum of ranks from both GBmiR binding and coexpression P values [54]. To illustrate the utility of the TraceRNA algorithm for breast cancer study, we also focus on the genes interacted with the estrogen receptor alpha, ESR1, with GBmiRs including miR-18a, miR-18b, miR-193b, miR-19a, miR-19b, miR-206, miR-20b, miR-22, miR-221, miR-222, miR-29b, and miR-302c. The regulation network generated by ESR1 as the initial GoI is shown in Figure 7, and the top 18 ceRNAs are provided in Table 3. The TraceRNA algorithm can be accessed http://compgenomics.utsa.edu/cerna/.
Table 3.
Top 18 candidate ceRNAs for ESR1 as GOI obtained from TraceRNA. ESR1 is at rank of 174 (not listed in this table).
| Gene symbol | SVMicrO-based prediction | Expression correlation | Final score | ||
|---|---|---|---|---|---|
| Score | P value | Score | P value | ||
| FOXP1 | 1.066 | 0.0043 | 0.508 | 0.016 | 1212 |
| VEZF1 | 0.942 | 0.0060 | 0.4868 | 0.020 | 1179 |
| NOVA1 | 0.896 | 0.0067 | 0.479 | 0.023 | 1160 |
| CPEB3 | 0.858 | 0.0074 | 0.484 | 0.022 | 1149 |
| MAP2K4 | 0.919 | 0.0064 | 0.322 | 0.097 | 1139 |
| FAM120A | 0.885 | 0.0069 | 0.341 | 0.082 | 1130 |
| PCDHA3 | 0.983 | 0.0054 | 0.170 | 0.215 | 1125 |
| SIRT1 | 0.927 | 0.0062 | 0.230 | 0.162 | 1117 |
| PCDHA5 | 0.983 | 0.0054 | 0.148 | 0.233 | 1113 |
| PTEN | 0.898 | 0.0067 | 0.221 | 0.168 | 1104 |
| PCDHA1 | 0.983 | 0.0054 | 0.140 | 0.239 | 1103 |
| NBEA | 0.752 | 0.0098 | 0.491 | 0.020 | 1102 |
| ZFHX4 | 0.970 | 0.0056 | 0.154 | 0.229 | 1097 |
| GLCE | 0.798 | 0.0087 | 0.3231 | 0.096 | 1096 |
| MAGI2 | 0.777 | 0.0092 | 0.321 | 0.097 | 1086 |
| SATB2 | 0.801 | 0.0086 | 0.243 | 0.151 | 1078 |
| LEF1 | 0.753 | 0.0098 | 0.291 | 0.112 | 1065 |
| ATPBD4 | 0.819 | 0.0082 | 0.170 | 0.215 | 1060 |
Figure 7.
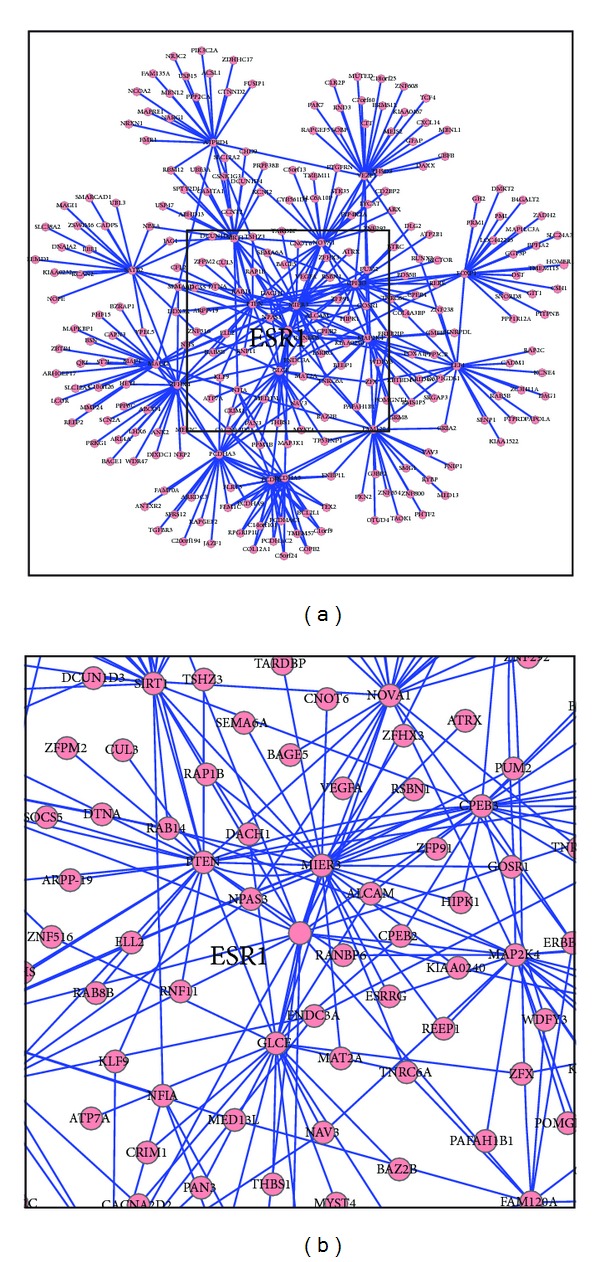
(a) ceRNA network for gene of interest ESR1 generated using TraceRNA. (b) Network graph enlarged at ESR1.
5. Conclusions
In this report, we attempt to provide a unified concept of modulation of gene regulation, encompassing earlier mRNA expression based methods and lately the ceRNA method. We expect the integration of ceRNA concept into the gene-gene interactions, and their modulator identification will further enhance our understanding in gene interaction and their systemic influence. Applications provided here also represent examples of our earlier attempt to construct modulated networks specific to breast cancer studies. Further investigation will be carried out to extend our modeling to provide a unified understanding of genetic regulation in an altered environment.
Authors' Contribution
M. Flores and T.-H Hsiao are contributed equally to this work.
Acknowledgments
The authors would like to thank the funding support of this work by Qatar National Research Foundation (NPRP 09 -874-3-235) to Y. Chen and Y. Huang, National Science Foundation (CCF-1246073) to Y. Huang. The authors also thank the computational support provided by the UTSA Computational Systems Biology Core Facility (NIH RCMI 5G12RR013646-12).
References
- 1.Schena M, Shalon D, Davis RW, Brown PO. Quantitative monitoring of gene expression patterns with a complementary DNA microarray. Science. 1995;270(5235):467–470. doi: 10.1126/science.270.5235.467. [DOI] [PubMed] [Google Scholar]
- 2.Mardis ER. Next-generation DNA sequencing methods. Annual Review of Genomics and Human Genetics. 2008;9:387–402. doi: 10.1146/annurev.genom.9.081307.164359. [DOI] [PubMed] [Google Scholar]
- 3.Cancer Genome Atlas Network. Comprehensive molecular portraits of human breast tumours. Nature. 2012;490:61–70. doi: 10.1038/nature11412. [DOI] [PMC free article] [PubMed] [Google Scholar]
- 4.Bell D, Berchuck A, Birrer M, et al. Integrated genomic analyses of ovarian carcinoma. Nature. 2011;474(7353):609–615. doi: 10.1038/nature10166. [DOI] [PMC free article] [PubMed] [Google Scholar]
- 5.McLendon R, Friedman A, Bigner D, et al. Comprehensive genomic characterization defines human glioblastoma genes and core pathways. Nature. 2008;455(7216):1061–1068. doi: 10.1038/nature07385. [DOI] [PMC free article] [PubMed] [Google Scholar]
- 6.Perou CM, Sørile T, Eisen MB, et al. Molecular portraits of human breast tumours. Nature. 2000;406(6797):747–752. doi: 10.1038/35021093. [DOI] [PubMed] [Google Scholar]
- 7.Lapointe J, Li C, Higgins JP, et al. Gene expression profiling identifies clinically relevant subtypes of prostate cancer. Proceedings of the National Academy of Sciences of the United States of America. 2004;101(3):811–816. doi: 10.1073/pnas.0304146101. [DOI] [PMC free article] [PubMed] [Google Scholar]
- 8.Eisen MB, Spellman PT, Brown PO, Botstein D. Cluster analysis and display of genome-wide expression patterns. Proceedings of the National Academy of Sciences of the United States of America. 1998;95(25):14863–14868. doi: 10.1073/pnas.95.25.14863. [DOI] [PMC free article] [PubMed] [Google Scholar]
- 9.Schlitt T, Brazma A. Current approaches to gene regulatory network modelling. BMC Bioinformatics. 2007;8(supplement 6, article S9) doi: 10.1186/1471-2105-8-S6-S9. [DOI] [PMC free article] [PubMed] [Google Scholar]
- 10.Hache H, Lehrach H, Herwig R. Reverse engineering of gene regulatory networks: a comparative study. Eurasip Journal on Bioinformatics and Systems Biology. 2009;2009 doi: 10.1155/2009/617281.617281 [DOI] [PMC free article] [PubMed] [Google Scholar]
- 11.Lee WP, Tzou WS. Computational methods for discovering gene networks from expression data. Briefings in Bioinformatics. 2009;10(4):408–423. doi: 10.1093/bib/bbp028. [DOI] [PubMed] [Google Scholar]
- 12.Sima C, Hua J, Jung S. Inference of gene regulatory networks using time-series data: a survey. Current Genomics. 2009;10(6):416–429. doi: 10.2174/138920209789177610. [DOI] [PMC free article] [PubMed] [Google Scholar]
- 13.Stuart JM, Segal E, Koller D, Kim SK. A gene-coexpression network for global discovery of conserved genetic modules. Science. 2003;302(5643):249–255. doi: 10.1126/science.1087447. [DOI] [PubMed] [Google Scholar]
- 14.Margolin AA, Nemenman I, Basso K, et al. ARACNE: an algorithm for the reconstruction of gene regulatory networks in a mammalian cellular context. BMC Bioinformatics. 2006;7(supplement 1, article S7) doi: 10.1186/1471-2105-7-S1-S7. [DOI] [PMC free article] [PubMed] [Google Scholar]
- 15.Dougherty ER, Kim S, Chen Y. Coefficient of determination in nonlinear signal processing. Signal Processing. 2000;80(10):2219–2235. [Google Scholar]
- 16.Kim S, Dougherty ER, Chen Y, et al. Multivariate measurement of gene expression relationships. Genomics. 2000;67(2):201–209. doi: 10.1006/geno.2000.6241. [DOI] [PubMed] [Google Scholar]
- 17.Chen X, Chen M, Ning K. BNArray: an R package for constructing gene regulatory networks from microarray data by using Bayesian network. Bioinformatics. 2006;22(23):2952–2954. doi: 10.1093/bioinformatics/btl491. [DOI] [PubMed] [Google Scholar]
- 18.Werhli AV, Grzegorczyk M, Husmeier D. Comparative evaluation of reverse engineering gene regulatory networks with relevance networks, graphical gaussian models and bayesian networks. Bioinformatics. 2006;22(20):2523–2531. doi: 10.1093/bioinformatics/btl391. [DOI] [PubMed] [Google Scholar]
- 19.Shmulevich I, Dougherty ER, Kim S, Zhang W. Probabilistic Boolean networks: a rule-based uncertainty model for gene regulatory networks. Bioinformatics. 2002;18(2):261–274. doi: 10.1093/bioinformatics/18.2.261. [DOI] [PubMed] [Google Scholar]
- 20.Sumazin P, Yang X, Chiu H-S, et al. An extensive MicroRNA-mediated network of RNA-RNA interactions regulates established oncogenic pathways in glioblastoma. Cell. 2011;147(2):370–381. doi: 10.1016/j.cell.2011.09.041. [DOI] [PMC free article] [PubMed] [Google Scholar]
- 21.Tay Y, Kats L, Salmena L, et al. Coding-independent regulation of the tumor suppressor PTEN by competing endogenous mRNAs. Cell. 2011;147(2):344–357. doi: 10.1016/j.cell.2011.09.029. [DOI] [PMC free article] [PubMed] [Google Scholar]
- 22.Bartel DP. MicroRNAs: target recognition and regulatory functions. Cell. 2009;136(2):215–233. doi: 10.1016/j.cell.2009.01.002. [DOI] [PMC free article] [PubMed] [Google Scholar]
- 23.Yue D, Meng J, Lu M, Chen CLP, Guo M, Huang Y. Understanding MicroRNA regulation: a computational perspective. IEEE Signal Processing Magazine. 2012;29(1):77–88.6105465 [Google Scholar]
- 24.Jones-Rhoades MW, Bartel DP. Computational identification of plant MicroRNAs and their targets, including a stress-induced miRNA. Molecular Cell. 2004;14(6):787–799. doi: 10.1016/j.molcel.2004.05.027. [DOI] [PubMed] [Google Scholar]
- 25.Hanahan D, Weinberg RA. The hallmarks of cancer. Cell. 2000;100(1):57–70. doi: 10.1016/s0092-8674(00)81683-9. [DOI] [PubMed] [Google Scholar]
- 26.Chun SY, Johnson C, Washburn JG, Cruz-Correa MR, Dang DT, Dang LH. Oncogenic KRAS modulates mitochondrial metabolism in human colon cancer cells by inducing HIF-1α and HIF-2α target genes. Molecular Cancer. 2010;9, article 293 doi: 10.1186/1476-4598-9-293. [DOI] [PMC free article] [PubMed] [Google Scholar]
- 27.Hudson NJ, Reverter A, Dalrymple BP. A differential wiring analysis of expression data correctly identifies the gene containing the causal mutation. PLoS Computational Biology. 2009;5(5) doi: 10.1371/journal.pcbi.1000382.e1000382 [DOI] [PMC free article] [PubMed] [Google Scholar]
- 28.Stelniec-Klotz I, Legewie S, Tchernitsa O, et al. Reverse engineering a hierarchical regulatory network downstream of oncogenic KRAS. Molecular Systems Biology. 2012;8 doi: 10.1038/msb.2012.32.601 [DOI] [PMC free article] [PubMed] [Google Scholar]
- 29.Shen C, Huang Y, Liu Y, et al. A modulated empirical Bayes model for identifying topological and temporal estrogen receptor α regulatory networks in breast cancer. BMC Systems Biology. 2011;5, article 67 doi: 10.1186/1752-0509-5-67. [DOI] [PMC free article] [PubMed] [Google Scholar]
- 30.Wilson CA, Dering J. Recent translational research: microarray expression profiling of breast cancer. Beyond classification and prognostic markers? Breast Cancer Research. 2004;6(5):192–200. doi: 10.1186/bcr917. [DOI] [PMC free article] [PubMed] [Google Scholar]
- 31.Cunliffe HE, Ringnér M, Bilke S, et al. The gene expression response of breast cancer to growth regulators: patterns and correlation with tumor expression profiles. Cancer Research. 2003;63(21):7158–7166. [PubMed] [Google Scholar]
- 32.Frasor J, Stossi F, Danes JM, Komm B, Lyttle CR, Katzenellenbogen BS. Selective estrogen receptor modulators: discrimination of agonistic versus antagonistic activities by gene expression profiling in breast cancer cells. Cancer Research. 2004;64(4):1522–1533. doi: 10.1158/0008-5472.can-03-3326. [DOI] [PubMed] [Google Scholar]
- 33.van’t Veer LJ, Dai H, van de Vijver MJ, et al. Gene expression profiling predicts clinical outcome of breast cancer. Nature. 2002;415(6871):530–536. doi: 10.1038/415530a. [DOI] [PubMed] [Google Scholar]
- 34.Kauffman SA. The Origins of Order : Self-Organization and Selection in Evolution. New York, NY, USA: Oxford University Press; 1993. [Google Scholar]
- 35.Allen JD, Xie Y, Chen M, Girard L, Xiao G. Comparing statistical methods for constructing large scale gene networks. PLoS ONE. 2012;7(1) doi: 10.1371/journal.pone.0029348.e29348 [DOI] [PMC free article] [PubMed] [Google Scholar]
- 36.Huang Y, Tienda-Luna IM, Wang Y. Reverse engineering gene regulatory networks: a survey of statistical models. IEEE Signal Processing Magazine. 2009;26(1):76–97. doi: 10.1109/MSP.2008.930647. [DOI] [PMC free article] [PubMed] [Google Scholar]
- 37.Crick F. Central dogma of molecular biology. Nature. 1970;227(5258):561–563. doi: 10.1038/227561a0. [DOI] [PubMed] [Google Scholar]
- 38.Hamilton A, Piccart M. The contribution of molecular markers to the prediction of response in the treatment of breast cancer: a review of the literature on HER-2, p53 and BCL-2. Annals of Oncology. 2000;11(6):647–663. doi: 10.1023/a:1008390429428. [DOI] [PubMed] [Google Scholar]
- 39.Sotiriou C, Neo SY, McShane LM, et al. Breast cancer classification and prognosis based on gene expression profiles from a population-based study. Proceedings of the National Academy of Sciences of the United States of America. 2003;100(18):10393–10398. doi: 10.1073/pnas.1732912100. [DOI] [PMC free article] [PubMed] [Google Scholar]
- 40.Sørlie T, Perou CM, Tibshirani R, et al. Gene expression patterns of breast carcinomas distinguish tumor subclasses with clinical implications. Proceedings of the National Academy of Sciences of the United States of America. 2001;98(19):10869–10874. doi: 10.1073/pnas.191367098. [DOI] [PMC free article] [PubMed] [Google Scholar]
- 41.Carroll JS, Meyer CA, Song J, et al. Genome-wide analysis of estrogen receptor binding sites. Nature Genetics. 2006;38(11):1289–1297. doi: 10.1038/ng1901. [DOI] [PubMed] [Google Scholar]
- 42.Basso K, Margolin AA, Stolovitzky G, Klein U, Dalla-Favera R, Califano A. Reverse engineering of regulatory networks in human B cells. Nature Genetics. 2005;37(4):382–390. doi: 10.1038/ng1532. [DOI] [PubMed] [Google Scholar]
- 43.Liang KC, Wang X. Gene regulatory network reconstruction using conditional mutual information. Eurasip Journal on Bioinformatics and Systems Biology. 2008;2008 doi: 10.1155/2008/253894.253894 [DOI] [PMC free article] [PubMed] [Google Scholar]
- 44.Wang K, Bisikirska BC, Alvarez MJ, et al. Genome-wide identification of post-translational modulators of transcription factor activity in human B cells. Nature Biotechnology. 2009;27(9):829–837. doi: 10.1038/nbt.1563. [DOI] [PMC free article] [PubMed] [Google Scholar]
- 45.Hansen M, Everett L, Singh L, Hannenhalli S. Mimosa: mixture model of co-expression to detect modulators of regulatory interaction. Algorithms for Molecular Biology. 2010;5(1, article 4) doi: 10.1186/1748-7188-5-4. [DOI] [PMC free article] [PubMed] [Google Scholar]
- 46.Babur O, Demir E, Gönen M, Sander C, Dogrusoz U. Discovering modulators of gene expression. Nucleic Acids Research. 2010;38(17):5648–5656. doi: 10.1093/nar/gkq287.gkq287 [DOI] [PMC free article] [PubMed] [Google Scholar]
- 47.Shimamura T, Imoto S, Shimada Y, et al. A novel network profiling analysis reveals system changes in epithelial-mesenchymal transition. PLoS ONE. 2011;6(6) doi: 10.1371/journal.pone.0020804.e20804 [DOI] [PMC free article] [PubMed] [Google Scholar]
- 48.Wu HY, et al. A modulator based regulatory network for ERalpha signaling pathway. BMC Genomics. 2012;13(Supplement 6, article S6) doi: 10.1186/1471-2164-13-S6-S6. [DOI] [PMC free article] [PubMed] [Google Scholar]
- 49.Yan K-K, Hwang W, Qian J, et al. Construction and analysis of an integrated regulatory network derived from High-Throughput sequencing data. PLoS Computational Biology. 2011;7(11) doi: 10.1371/journal.pcbi.1002190.e1002190 [DOI] [PMC free article] [PubMed] [Google Scholar]
- 50.Flores M, Huang Y. TraceRNA: a web based application for ceRNAs prediction. Proceedings of the IEEE Genomic Signal Processing and Statistics Workshop (GENSIPS '12); 2012. [Google Scholar]
- 51.Hsu SD, Lin FM, Wu WY, et al. MiRTarBase: a database curates experimentally validated microRNA-target interactions. Nucleic Acids Research. 2011;39(1):D163–D169. doi: 10.1093/nar/gkq1107. [DOI] [PMC free article] [PubMed] [Google Scholar]
- 52.Liu H, Yue D, Chen Y, Gao SJ, Huang Y. Improving performance of mammalian microRNA target prediction. BMC Bioinformatics. 2010;11, article 476 doi: 10.1186/1471-2105-11-476. [DOI] [PMC free article] [PubMed] [Google Scholar]
- 53.Dong Y, et al. A Bayesian decision fusion approach for microRNA target prediction. BMC Genomics. 2012;13 doi: 10.1186/1471-2164-13-S8-S13. [DOI] [PMC free article] [PubMed] [Google Scholar]
- 54.Asm JA, Montague M. Models for Metasearch. Proceedings of the 24th annual international ACM SIGIR conference on Research and development in information retrieval; 2001; New Orleans, La, USA. la; pp. 276–284. [Google Scholar]