

Abstract
Background
Hair is a promising tissue to assess exposure to 2-amino-1-methyl-6-phenylimidazo[4,5-b]pyridine (PhIP), a carcinogen formed in cooked meats. However, an understanding of how dietary exposure to PhIP, cytochrome P450 1A2 activity - a key enzyme involved in PhIP metabolism, and hair pigmentation affect the level of PhIP accrued in hair is required in order to determine the reliability of the PhIP hair level as a biomarker of exposure to this carcinogen.
Methods
We examined the impact of PhIP exposure, cytochrome P450 1A2 activity, and hair pigmentation on the levels of PhIP accumulated in the hair of volunteers on a 4-week semi-controlled diet of cooked meat containing known quantities of PhIP.
Results
The amount of PhIP in hair increased, on average, 15-fold in light- and dark-haired individuals during consumption of cooked meat. PhIP levels in hair were correlated to PhIP intake (ρ = 0.53; p < 0.001), and the relationship was strengthened when PhIP levels were normalized for the melanin content of hair (ρ = 0.71; p < 0.001). However, PhIP accrual in hair was not correlated to cytochrome P450 1A2 activity, as assessed by the caffeine test, or to the levels of unmetabolized PhIP in urine, or to the metabolic ratio of the major urinary metabolite N2-(ß-1-glucosiduronyl-2-(hydroxyamino)-1-methyl-6-phenylimidazo[4,5-b]pyridine to unmetabolized PhIP.
Conclusions
The employment of the PhIP hair biomarker should take hair pigmentation into account for accurate exposure assessment.
Impact
PhIP hair levels can serve as a biomarker in epidemiological studies investigating the association of HAAs, cooked meat and cancer risk.
Introduction
2-Amino-1-methyl-6-phenylimidazo[4,5-b]pyridine (PhIP) is a carcinogenic heterocyclic aromatic amine (HAA) formed in well-done cooked meats (1) and comprises about 70% of the daily mean intake of HAAs in the United States (2). PhIP is a multisite carcinogen in rodents: it induces colorectal, pancreatic, prostate, and mammary gland tumors (3). Therefore, PhIP may have an etiological role in these cancers in humans (3). Indeed, some epidemiological studies have reported that the frequent consumption of well-done cooked meats containing HAAs increases the risk of developing cancers at these sites; however, other studies have not observed an association between consumption of well-done meats and the risk of cancer (4–9).
The accurate assessment of exposure is a major limitation in epidemiological studies addressing diet and cancer risk. The amount of PhIP formed is highly dependent on the type of meat cooked, as well as the method, temperature, and duration of cooking, which can lead to differences in the levels of PhIP by more than 100-fold (1, 10). As a result, inferences based on PhIP intake from food frequency questionnaires (FFQ) may be inaccurate (11); indeed, the mean intake of PhIP from an FFQ was not associated with the levels of urinary PhIP (12). The inconsistent findings in the literature on the association of HAA intake and cancer is probably because of the difficulty in assessing exposure and differences in meat cooking methods across populations.
Analytical methods have been established to measure PhIP and its metabolites in urine, following meat consumption (13–15); however, the occurrence of urinary biomarkers is transient, and the measured level only captures the preceding 24 hours of exposure. For individuals who chronically but intermittently consume cooked meats, urinary biomarkers of PhIP can be at undetectable levels, and these individuals can be misclassified. There are two reports on blood protein adducts of PhIP (16, 17), but the identities of the adducts have yet to be determined, and information on the kinetics of adduct formation and persistence are lacking. Putative DNA adducts of PhIP have been characterized in human tissues (16, 18, 19), but these measurements are often precluded by the unavailability of biopsy samples in large scale human studies. There is a need to establish stable, long-term biomarkers of PhIP, which can be implemented in molecular epidemiology studies to evaluate the health risk of this genotoxicant.
Human hair has served as a matrix to biomonitor various drugs and contaminants, such as nicotine, narcotics, and hormones (20–22). Alexander and co-workers showed that a small portion of the dose of PhIP becomes entrapped within the melanin-rich tissues of rodents, including the hair follicle, and PhIP becomes incorporated in the cortex of the newly grown hair shafts (23). Subsequently, gas chromatography-negative ion chemical ionization mass spectrometry (24) and liquid chromatography/mass spectrometry (LC/MS) methods have been established to quantitate PhIP in human hair (25–27).
The levels of PhIP in hair vary widely among individuals (24–27). The main factors expected to influence the level of PhIP in hair are: 1) the different concentrations of PhIP in the diet; 2) inter-individual differences in the pharmacokinetics and metabolism of PhIP; and 3) hair pigmentation. The level of cytochrome P450 1A2, a major hepatic enzyme involved in PhIP metabolism (28), can vary by more than 50-fold in humans (29) and may affect the level of PhIP that reaches the hair follicle, following first pass metabolism. PhIP has a high binding affinity for eumelanin, a pigment that is more predominant in black hair than in lighter-colored hair (23, 24). Thus, pigmentation may influence the sequestering of PhIP in hair.
In this study, we have examined the influence of PhIP exposure, P450 1A2 phenotype, and hair pigmentation on the level of PhIP accrual in hair of subjects put on a semi-controlled diet of well-done cooked meat containing known quantities of PhIP. This research is necessary to accurately gauge the use of hair as a reliable tissue to assess exposure to PhIP and the practicality of using PhIP hair level as a biomarker in large epidemiological studies investigating the association of HAAs with disease risk. The biomarkers of PhIP employed for study are shown in Figure 1.
Figure 1.
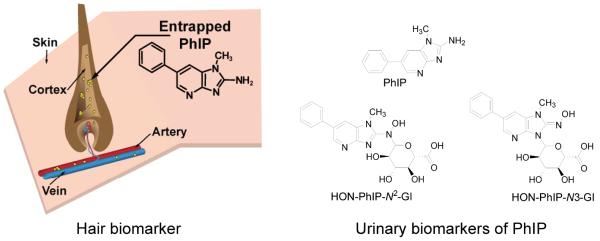
Biomarkers of PhIP in hair and urine.
Materials and Methods
Study Subjects
A group of N = 44 (82% males, 18% females, and 45% white, 44% Asian/Pacific Islander, 9% African American, 2% Hispanic Non-white) healthy, non-smoking volunteers were recruited among University of Hawaii students and staff on the Manoa campus. Inclusion criteria included: regular beef eater; age >18; no use of hair dyes; taking no prescribed or over the counter medication except an occasional analgesic; no history of gastrointestinal tract disorders; having a weight not less than 90% or greater than 130% of 1983 Metropolitan Life Insurance desirable weights; no weight change of more than 10 pounds in the past 12 months; no special diet (e.g., vegetarian, macrobiotic, weight loss, diabetic, etc.); fruit and vegetable intake ≤7 servings/day; fiber intake less than 22 g/d, alcohol intake no greater than 2 drinks per day; caffeine intake no greater than 2 caffeinated drinks per day. Recruitment was carried out through advertising on the University of Hawaii Manoa campus in Honolulu. The feeding study was divided into three phases. In phase I, a three week pre-feeding period, subjects refrained from eating pan-fried, grilled or oven-broiled meats, poultry or fish, cooked well-done. Thereafter, in phase II, volunteers ate dinner, five days a week, for four weeks at a study site on the University of Hawaii Manoa campus. As part of this meal, subjects were fed a ground beef patty (150 or 200 g) grilled well-done. The rest of the meal was varied on a five day rotating basis but was low in dietary fiber and included a starch (rice, potato or pasta), a vegetable, a fruit, dessert, and a drink. For the remainder of their daily meals and on Saturdays and Sundays, the participants followed their normal diet, except that they were asked to avoid eating any well-done meat or fish. After this 4-week feeding period, in phase III, the volunteers went back to their regular diet but refrained from eating meats that were grilled well done for four weeks. This study was run in groups of 10–20 subjects. All subjects provided informed consent and the study was approved by the Institutional Review Boards at the Wadsworth Center and the University of Hawaii.
Preparation of cooked meat
Ground beef (15% fat) was cooked as half pound patties on a commercial flat top griddle for an average of 10 minutes per side. The surface temperature of the griddle was monitored and ranged from 440 °F to 600 °F. The patties were flipped only once. After cooking, the patties were refrigerated overnight. They were then minced and homogenized with a food processor, and frozen until needed. On each day of feeding, the meat was re-heated in a warmer so no additional HAAs would be formed. Several samples of the cooked meat were analyzed for PhIP to estimate the dose provided to each study group.
Biological specimens
Urine was collected for the 12 h period immediately after dinner time until rising the following morning and kept on blue ice in a cooler until aliquoting and freezing at −80 °C. During phase II, subjects collected urine samples on days 21, 23, 35, and 49 (0, 2, 14, and 21 days following the start of consumption of well-done meat). During phase III, subjects provided 12-hour overnight urine samples at day 77 (the end of the 4th week of cessation of consumption of well-done meat). Urine was stored at −80 °C until assayed. Newly grown hair (50 – 200 mg) from the nape of the neck was collected by study staff once during phase I, and at the end of phases II and III. Samples were stored in sealed envelopes at 4 °C until assayed.
Chemicals
PhIP and 1-[2H3C]-PhIP were from Toronto Research Chemicals. The metabolites of PhIP and 1-[2H3C]-PhIP, N2-(ß-1-glucosiduronyl-2-(hydroxyamino)-1-methyl-6-phenylimidazo[4,5-b]pyridine (HON-PhIP-N2-Gl), and N3-(ß-1-glucosiduronyl-2-(hydroxyamino)-1-methyl-6-phenylimidazo[4,5-b]pyridine (HON-PhIP-N3-Gl) were prepared biosynthetically (14, 30).
Isolation of PhIP from Cooked Meat
PhIP was isolated from meat by tandem solid phase extraction (SPE) (10). Quantitative mass spectrometric measurements were done as described below.
Isolation of PhIP from Hair
Minced hair (25 – 50 mg) spiked with 1-[2H3C]-PhIP (100 pg per 50 mg hair) was digested in 1N NaOH (1 mL) at 80 °C for 1 h. Thereafter, PhIP was isolated by tandem solvent/solid phase extraction (27).
Spectrophotometric Characterization of Melanin in Hair
Hair (5 mg) was digested in Soluene 350:H2O (9:1 v/v, 1 mL) by heating at 95 ° C for 1 h. Spectra were acquired with an Agilent 8453 model UV/VIS spectrophotometer. The absorbance at 500 nm was used to estimate the total amount of melanin (31).
Isolation of PhIP and Metabolites in Urine
PhIP and its metabolites were isolated by solid phase extraction (15, 30). 1-[2H3C]-PhIP and 1-[2H3C]-(HON-PhIP-N-Gl) metabolites were added, respectively, at a concentration of 100 and 1000 pg/mL urine (15).
Ultraperformance Liquid Chromatography-Electrospray Ionization/Tandem MS (UPLC-ESI/MS/MS) Measurements of PhIP in Hair and Cooked Meat, and Metabolites of PhIP from Urine
The quantification of PhIP analytes was performed with a NanoAcquity™ UPLC (Waters Corporation, Milford, MA) equipped with a Michrom C18 AQ column (0.3 × 150 mm, 3 μm particle size, Michrom Bioresources Inc., Auburn, CA) and a Michrom CaptiveSpray™ source interfaced to a Finnigan™ Quantum Ultra mass spectrometer (Thermo Fisher, San Jose, CA). The chromatographic conditions and instrument tune parameters were reported previously (15). Analyses were conducted in the positive ionization mode using the following transitions: PhIP: 225.1 → 210.1; and 1-[2H3C]-PhIP: 228.1 → 210.1; isomeric HON-PhIP-N-Gl: 417.1 → 225.1, 224.1, and 223.1; [2H3C]-HON-PhIP-N-Gl: 420.1 → 228.1, 227.1, and 225.1.
Caffeine Phenotyping for P450 1A2 Activity
Subjects fasted for ten hours, then consumed 2 cups of coffee (about 100 mg of caffeine) upon rising, maintained fasting for another two hours, abstained from other caffeine consumption, and collected their urine during the fifth hour after dosage. Caffeine metabolites (17U: 1,7-dimethyluric acid; 17X: 1,7-dimethylxanthine; and 137X: caffeine) were analyzed by HPLC with a photodiode array detector to assess metabolic phenotypes (32). The coefficient of variation (CV) for the caffeine metabolite ratio based on 69 blind duplicate pairs analyzed with the study samples was 2.6%. The caffeine tests were carried out twice in each phase, a week apart. All samples from each subject were analyzed in the same analytical batch.
Statistical Analyses
The PhIP values in hair and the urine and caffeine metabolic phenotypes were analyzed using linear mixed regression models, with person included as a random effect and study day as a set of fixed effect indicators. The PhIP values were log-transformed as ln(x+1) in order to meet model assumptions. Geometric means and 95% confidence intervals (CI) were computed across study days as the antilog of the covariate-adjusted means and their 95% CI. Spearman rank correlation coefficients (ρ) were used to assess associations between PhIP levels in hair with dietary intake of PhIP, P450 1A2 caffeine metabolic phenotype, and PhIP and its metabolite levels in urine. Additional linear regression models for PhIP accrued in hair at day 49, with and without normalization for melanin, were performed to examine its associations with dietary exposure to PhIP (μg) and melanin. All analyses were conducted using SAS, version 9.2 (SAS Institute, Inc., Cary NC). P-values were two-sided, and p<0.05 is considered statistically significant.
Results
PhIP Content in Well-Done Cooked Meats and Dietary Exposure in Semi-Controlled Feeding Study
The concentration of PhIP in cooked meat ranged from 6.2 to 81 ng/g. The meat portion size was adjusted (150 g or 200 g) so that the amounts of PhIP given per serving to the subjects were on average (μg PhIP/serving): 1.2 (study group 1), 3.0 (study group 2), 11.7 (study group 3) and 8.0 (study group 4).
PhIP Biomarkers in Urine and Hair
The analytical methods for measurement of PhIP and its metabolites in urine and PhIP in hair resulted in within-day and between-day CVs (%) ≤10% (14, 15, 27). The mass chromatograms of PhIP and its metabolites in urine collected from a typical subject during the study are shown in Figure 2. There was no evidence of urinary biomarkers of PhIP in the pre-dose urine specimen, whereas PhIP and its metabolites were readily identified in the urine specimen during the feeding phase. The unmetabolized PhIP present in urine 12 h following consumption of cooked meat ranged from undetectable to 0.39% (day 23); undetectable to 0.81% (day 35); and undetectable to 0.51% (day 49) of the ingested dose. Consistent with previous studies (13, 15, 30, 33), HON-PhIP-N2-Gl, a conjugate of the genotoxic metabolite 2-hydroxyamino-1-methyl-6-phenylimidazo[4,5-b]pyridine (HONH-PhIP), was the predominant urinary metabolite and accounted for 6.1 – 80% (day 23); 8.6 – 75% (day 35); and 2.4 – 91%(day 49) of the ingested dose. HONPhIP-N3-Gl accounted for 0.3 – 7.2% (day 23); 0.4 – 6.4% (day 35); and 0.2 – 6.5% (day 49) of the ingested dose. The analysis of PhIP accrued in newly grown hair collected from one typical subject during the pre-dose and immediately following the 4-week controlled meat feeding phase is shown in Figure 2. The product ion spectra of the analyte corroborated its identity as PhIP.
Figure 2.

UPLC-ESI/MS/MS analysis of PhIP biomarkers in urine and hair. (A) PhIP and the N2- and N3-glucuronide conjugates of HONH-PhIP in urine (A) pre-feeding and (B) during consumption of well-done cooked meat, (C) PhIP in hair during pre-feeding and (D) following 4 weeks of consumption of well-done cooked meat. The product ion spectra of the analyte in hair and synthetic PhIP (E) confirm the identity of the hair biomarker as PhIP. The symbol tR represents retention time, and the symbol A represents area counts. The HON-PhIP-N2-Gl elutes at tR = 12.2 min and HON-PhIP-N3-Gl elutes at tR = 14.6 min.
The geometric mean levels of PhIP in hair are summarized by study day in Table 1. The mean levels of PhIP are expressed in three ways: per pg/g of hair, unadjusted and adjusted for melanin content in the regression model, and expressed as ng/g melanin to account for the influence of pigmentation on the accrual of PhIP in human hair (24, 34). The pre-feeding period average levels of PhIP in hair of subjects prior to consuming well-done cooked meat diet (days 0 and 21) ranged between 79 – 93 pg/g hair; these values are about 2-fold above the limit of quantification (LOQ). During this period, the newly grown hair of 77% of subjects on day 0 and 73% of subjects on day 21 contained PhIP at levels above the LOQ. The mean level of PhIP in hair increased by nearly 13-fold following 4 weeks of consuming the well-done meat diet (day 49) compared to the average over the non-feeding period, and the levels of PhIP in hair further increased by 1.4-fold in the newly grown hair 4 weeks following completion of the meat feeding study (day 77); the average increase for the post versus pre feeding periods was 15-fold. The values at days 49 and 77 are statistically significantly different from the values at days 0 and 21 (p's < 0.001). The level of increase of PhIP in hair from the pre- to post-feeding period was substantial for participants with both lighter and darker hair (Table 1): 14-fold and 20-fold for those with the lowest 25% levels and the highest 25% of melanin, respectively (p for difference=0.27). The PhIP hair levels returned to baseline values at 3 months post-meat consumption.
Table 1.
Mean* PhIP content in hair and PhIP content in hair by melanin levels of subjects on a semi-controlled well-done meat diet
| Day 0 | Day 21 | Day 49 | Day 77 | p-value** | ||
|---|---|---|---|---|---|---|
| Biomarker | Melanin Level*** | n = 43 | n = 33 | n = 44 | n = 44 | |
| PhIP (pg/g hair) | ALL | 93 (69 – 126) | 79 (60 – 104) | 1077 (809 – 1432) | 1492 (1120 – 1989) | <0.001 |
| Quartile 1 | 36 (22 – 61) | 41 (24 – 72) | 492 (297 – 815) | 641 (394 – 1041) | ||
| Quartile 2 | 116 (70 – 193) | 94 (57 – 155) | 661 (390 – 1120) | 910 (552 – 1500) | ||
| Quartile 3 | 165 (99 – 274) | 99 (58 – 167) | 1865 (1120 – 3107) | 2281 (1400 – 3714) | ||
| Quartile 4 | 98 (58 – 165) | 97 (57 – 164) | 1527 (924 – 2522) | 2487 (1536 – 4026) | ||
| PhIP (pg/g hair), adjusted for melanin (mg/g hair)**** | ALL | 91 (69 – 120) | 76 (58 – 98) | 1027 (801 – 1316) | 1427 (1121 – 1817) | <0.001 |
| Quartile 1 | 50 (21 – 119) | 58 (24 – 141) | 677 (292 – 1566) | 871 (393 – 1930) | ||
| Quartile 2 | 120 (71 – 202) | 96 (58 – 160) | 683 (402 – 1158) | 951 (572 – 1578) | ||
| Quartile 3 | 149 (86 – 258) | 87 (48 – 157) | 1619 (904 – 2900) | 2014 (1163 – 3488) | ||
| Quartile 4 | 77 (38 – 157) | 77 (38 – 156) | 1191 (586 – 2419) | 1944 (969 – 3900) | ||
| PhIP (ng/g melanin) | ALL | 5.8 (4.4 – 7.5) | 4.8 (3.7 – 6.3) | 64 (50 – 80) | 87 (69 – 109) | <0.001 |
| Quartile 1 | 5.0 (2.9– 8.2) | 6.0 (3.3 – 10) | 68 (42 – 108) | 83 (52 – 132) | ||
| Quartile 2 | 7.8 (4.7 – 13) | 6.2 (3.7 – 10) | 45 (27 – 74) | 62 (38 – 101) | ||
| Quartile 3 | 7.9 (4.8 – 13) | 4.6 (2.6 – 7.9) | 80 (49 – 128) | 101 (63 – 161) | ||
| Quartile 4 | 3.7 (2.0 – 6.3) | 3.6 (1.9 – 6.3) | 52 (32 – 83) | 84 (53 – 134) |
Feeding with well-done meat commenced on Day 22 and ceased on Day 49.
Geometric mean and 95% confidence interval based on mixed linear model
Comparing the values of days 0 and 21 to values of days 49 and 77 based on a F-test with (1, 43) degrees of freedom
Melanin levels by quartiles: <11.7, 11.7 – 20.8, 20.9 – 25.5, >25.5 mg/g)
Melanin was included as an adjustment factor in the linear model
P450 1A2 Metabolic Phenotype
It was of interest to determine if the consumption of well-done red meat induced P450 1A2 activity (Table 2). The average level of P450 1A2, as assessed by the urinary ratio (17U + 17X) / 137X, varied from 6.3 – 7.1 prior to meat consumption, from 9.6 – 10.4 during the meat feeding period and from 7.1 – 7.2 during the post-feeding period; the difference in means was significantly different between feeding and non-feeding periods (p=0.0001). The positive effect of grilled meat consumption on the induction of P450 1A2 activity is consistent with findings from a previous study (35).
Table 2.
Mean* P450 1A2 caffeine metabolic phenotype of subjects on a semi-controlled well-done meat diet
| Study Day | N | Semesters 1 and 2 | N | Semesters 3 and 4 | N | All** |
|---|---|---|---|---|---|---|
| 14 | 21 | 6.4 (4.7 – 8.7) | 23 | 7.7 (5.7 – 10.2) | 44 | 7.1 (5.7 – 8.7) |
| 21 | 21 | 6.3 (4.3 – 8.9) | 22 | 6.4 (4.4 – 9.0) | 43 | 6.3 (4.9 – 8.1) |
| 35 | 21 | 10.2 (7.5 – 13.9) | 23 | 10.5 (7.8 – 14.1) | 44 | 10.4 (8.4 – 12.8) |
| 49 | 21 | 9.8 (7.2 – 13.4) | 23 | 9.2 (6.8 – 12.4) | 44 | 9.6 (7.7 – 11.8) |
| 70 | 21 | 6.4 (4.5 – 9.2) | 23 | 7.7 (5.35 – 10.8) | 44 | 7.1 (5.5 – 9.0) |
| 77 | 20 | 7.6 (5.4 – 10.5) | 23 | 6.8 (4.9 – 9.3) | 43 | 7.2 (5.7 – 9.0) |
Feeding with well-done meat commenced on Day 22 and ceased on Day 49.
Geometric mean and 95% confidence interval based on mixed linear model
P-value = 0.0001 comparing the values of days 14, 21, 70, and 77 to values of days 35 and 49 based on a F-test with (1, 43) degrees of freedom
Correlations Associating PhIP Levels in Hair with Dietary Exposure to PhIP, P450 1A2 Metabolic Phenotype, PhIP Metabolic Phenotype and Hair Pigmentation
We examined the interrelationships among PhIP accrued in hair and the factors potentially affecting PhIP hair levels. Correlations are summarized in Table 3, and plots of PhIP levels in hair, expressed either as pg/g hair or ng/g melanin (on a logarithmic scale) versus PhIP intake are presented in Figures 3A and 3B. There was a significant correlation between amount of PhIP intake and levels of PhIP accumulated in hair (ρ=0.53, P<0.001), and the correlation was strengthened when the melanin content of hair was taken into account (ρ=0.71, P<0.001). Subjects with dark hair and higher melanin content sequestered more PhIP in their hair than subjects with lighter hair pigmentation, with ρ=0.48 (P=0.001) between PhIP accrual in hair and melanin content (Table 3). We further explored this relationship in Figures 3C and 3D. The correlation is strengthened after normalization for PhIP intake: ρ=0.63 (P<0.001) for PhIP (pg/g hair)/PhIP intake (μg)) versus melanin content (mg/g hair). However, the correlation is poor when the level of PhIP in hair is further adjusted for melanin content: ρ=−0.04 (P=0.79) for PhIP (ng/g melanin)/PhIP intake (μg)) versus melanin, thereby demonstrating that melanin pigmentation is a major factor in PhIP binding to hair.
Table 3.
Spearman correlations between PhIP in Hair and other analytes at day 49
| PhIP (pg/g hair) | PhIP (ng/g melanin) | |||
|---|---|---|---|---|
| P | p-value | ρ | p-value | |
| PhIP Intake (ng) | 0.53 | <0.001 | 0.71 | <0.001 |
| Melanin (mg/g hair) | 0.48 | 0.001 | ||
| P450 1A2 (Metabolic ratio, based on 12hr urine) | −0.21 | 0.18 | −0.08 | 0.62 |
| % dose PhIP | −0.06 | 0.71 | −0.11 | 0.47 |
| % dose HONH-PhIP-N2-GI | −0.21 | 0.17 | −0.24 | 0.11 |
| % dose HONH-PhIP-N3-GI | −0.13 | 0.38 | −0.18 | 0.25 |
| Metabolic ratio: HONH-PhIP-N2-GI/PhIP | −0.18 | 0.24 | −0.23 | 0.14 |
| Metabolic ratio: HONH-PhIP-N3-GI/PhIP | −0.11 | 0.47 | −0.07 | 0.63 |
Figure 3.

Plots of (A) PhIP hair levels versus dietary exposure to PhIP, (B) PhIP hair levels normalized for melanin content versus dietary exposure to PhIP, (C) PhIP hair levels normalized for dietary intake of PhIP versus melanin hair content, and (D) PhIP hair levels normalized for melanin hair content and dietary intake of PhIP versus melanin hair content, following 4 weeks of consumption of well-done cooked beef.
The amount of PhIP present in urine was not correlated to the amount of PhIP accrued in hair, irrespective of adjustment for the melanin content of hair (unadjusted ρ= −0.06, adjusted ρ=−0.11, p's ≥ 0.47). The levels of PhIP in urine were also not strongly correlated to rapid P450 1A2 phenotype, based upon caffeine metabolic ratios (ρ=-0.20, p=0.20). Moreover, a significant inverse correlation was not observed between the levels of PhIP in hair, normalized for melanin content, and rapid phenotype of PhIP metabolism, employing the metabolic ratio of the two major urinary metabolites of PhIP, HON-PhIP-N2-Gl/PhIP (ρ = −0.23, p = 0.14) or HON-PhIP-N3-Gl/PhIP (ρ = −0.07, p = 0.63).
Discussion
PhIP is present in the hair of omnivores (24, 26, 27), whereas the levels of PhIP are negligible in the hair of vegetarians (27). Moreover, the levels of PhIP in hair samples from individual omnivores were reported to vary by less than 24% over a 6-month interval, signifying that the exposure to PhIP is relatively constant over time (27). These promising findings suggest that the measurement of PhIP in hair tissue can be employed as a reliable, long-lived biomarker to assess exposure to this dietary carcinogen. There is a large inter-individual variation in the levels of PhIP accrued in hair of subjects on unrestricted diets (24, 26, 27). A feeding study with known exposure to PhIP is essential to understand the interrelationship among PhIP hair levels, dietary intake of PhIP, phenotypes associated with PhIP metabolism, and hair pigmentation; all of these interactive factors are expected to influence the accrual of PhIP in hair.
In our meat-feeding study, the level of PhIP intake, and its biomarkers in urine and hair were carefully monitored during the pre-dose, the 4 week meat-feeding phase, and post-dose phases. Hair from the vertex posterior position of the scalp is often used for drug testing of chemicals four to five weeks after exposure (36). However, we selected newly grown hair from the nape of the neck because multiple collections of hair were required to measure the kinetics of PhIP uptake in hair within short time intervals. The mean levels of PhIP substantially increased after initiation of the well-done meat diet and continued to increase in newly grown hair 4 weeks after termination of the meat diet. An increase was observed in individuals with lighter and darker hair. In contrast to the findings of the hair biomarker, PhIP and its metabolites were not detected in urine samples, during this wash-out phase. The levels of PhIP in hair returned to basal levels at 12 weeks post-meat feeding phase. Thus, the time interval between the absorption of PhIP into the hair follicle and the outgrowth of the corresponding hair shaft through the subjects' skin surface is at least 4 weeks.
The consumption of PhIP in our semi-controlled feeding study corresponds to a dosage range from 17 – 166 ng of PhIP/kg body weight, assuming an average body weight of 70 kg. These amounts of PhIP are 2 to 13-fold higher than the average intake estimated between 9.2 and 12.6 ng of PhIP/kg body weight in US males (2). The geometric mean for hair level of PhIP, expressed as ng/g melanin, peaked at 87 (69, 109, 95% CI) on day 77. When the data are stratified by study group, the 9 volunteers who consumed the smallest dose of 1.2 μg PhIP per day had a mean level of PhIP in hair of 27 ng/g melanin (18, 39, 95%CI), and the 16 subjects who consumed the highest dose of 11.7 μg PhIP per day had a mean level of 133 ng/g melanin (106, 165, 95%CI). In comparison, in an independent study, the geometric means of PhIP in hair were estimated at 32 ng/g melanin (15, 70, 95% CI) for 5 subjects from Albany, NY, on a free-choice diet, when measured by the same analytical method (27). In comparison, a mean of 16.6 ng PhIP/g melanin (9, 18, 95% CI) was determined for subjects (N = 20) on a free-choice diet in Japan, where a different analytical method was employed to estimate the level of PhIP in hair.
P450 1A2 is the principal cytochrome P450 enzyme involved in the metabolism of PhIP (29, 37, 38), and it accounts for approximately 70% of the clearance of PhIP in humans (28). The inter-individual difference in hepatic P450 1A2 protein content can vary by more than 50-fold (29), and similar variations in P450 1A2 activity are observed in vivo, when employing caffeine as the metabolic probe (39). The amount of unmetabolized PhIP in the bloodstream that reaches the hair follicle, following first-pass metabolism by hepatic P450 1A2, was expected to differ among individuals, and the phenotypic activity of P450 1A2 was considered to be an important factor influencing the level of PhIP accrued in hair: subjects with rapid P450 1A2 phenotypes were expected to have the lowest levels of PhIP. However, a significant inverse correlation was not observed between the levels of PhIP in hair and rapid P450 1A2 activity, when employing caffeine as the metabolic probe. The range in levels of this measure of P450 1A2 activity among the volunteers in our feeding study showed a 18-fold difference, which may have not been sufficient to impact the levels of PhIP binding to hair. Earlier studies examining urinary caffeine metabolic ratios also did not detect an inverse relationship between P450 1A2 activity and the levels of PhIP excreted in urine (40). Hepatic P450 1A2 expression, even in subjects with slow P450 1A2 phenotypes (41), may be at levels sufficient to significantly reduce the concentration of PhIP during first pass metabolism before it reaches systemic circulation.
Rapid metabolizers of PhIP, based on the urinary metabolic ratio HONH-N2-PhIP-Glu/PhIP, also did not have significantly lower levels of PhIP in their hair than the slow metabolizers of PhIP. However, the metabolic ratio HONH-N2-PhIP-Glu/PhIP for many subjects showed significant intra-individual variation during study days when urine was collected. This short-term urinary biomarker represents a “snap-shot” of the metabolic phenotype and may not accurately reflect the overall phenotype during the 4 week feeding study, and thus may not be expected to correlate to the long-term hair biomarker.
Pigmentation, and melanin in particular, has a pronounced effect on the binding of PhIP to fur of animals (34, 42) and also human hair (23, 26, 27). Our data show that the binding of PhIP to hair should be adjusted for melanin content to standardize the accrual of PhIP in hair, particularly for subjects with red, blonde or grey hair where the melanin content is low (31). The role of melanin content in PhIP uptake in light-haired subjects merits further study. The intake of PhIP in our semi-controlled feeding study was up to 15-fold higher than the average intake levels of PhIP estimated in the United States, and the meat was cooked very well done. On-going feeding studies with a lesser intake of PhIP from meat cooked at lower temperatures than our current study will enable us to further our understanding about PhIP accrual in hair and its employment as a biomarker. The employment of hair containing PhIP represents the first long-term biomarker of HAAs, which are potential human carcinogens. The analysis of PhIP levels in hair may be used in molecular epidemiology studies to estimate exposure and assess the risk of disease by consumption of this HAA formed in well-done cooked meats.
Acknowledgments
Funding Source This research was supported by grant R01 CA122320 from the National Cancer Institute, and grant RFA 09/149 from the World Cancer Research Fund International
Footnotes
Disclosure of Potential Conflicts of Interest No potential coflicts of interest were disclosed.
Reference List
- 1.Felton JS, Jagerstad M, Knize MG, Skog K, Wakabayashi K. Contents in foods, beverages and tobacco. In: Nagao M, Sugimura T, editors. Food Borne Carcinogens Heterocyclic Amines. John Wiley & Sons Ltd.; Chichester, England: 2000. pp. 31–71. [Google Scholar]
- 2.Keating GA, Bogen KT. Estimates of heterocyclic amine intake in the US population. J Chromatogr B Analyt Technol Biomed Life Sci. 2004;802:127–33. doi: 10.1016/j.jchromb.2003.10.047. [DOI] [PubMed] [Google Scholar]
- 3.Sugimura T, Wakabayashi K, Nakagama H, Nagao M. Heterocyclic amines: Mutagens/carcinogens produced during cooking of meat and fish. Cancer Sci. 2004;95:290–9. doi: 10.1111/j.1349-7006.2004.tb03205.x. [DOI] [PMC free article] [PubMed] [Google Scholar]
- 4.Knize MG, Felton JS. Formation and human risk of carcinogenic heterocyclic amines formed from natural precursors in meat. Nutr Rev. 2005;63:158–65. doi: 10.1111/j.1753-4887.2005.tb00133.x. [DOI] [PubMed] [Google Scholar]
- 5.Zheng W, Lee SA. Well-done meat intake, heterocyclic amine exposure, and cancer risk. Nutr Cancer. 2009;61:437–46. doi: 10.1080/01635580802710741. [DOI] [PMC free article] [PubMed] [Google Scholar]
- 6.Alaejos MS, Gonzalez V, Afonso AM. Exposure to heterocyclic aromatic amines from the consumption of cooked red meat and its effect on human cancer risk: a review. Food Addit Contam Part A Chem Anal Control Expo Risk Assess. 2008;25:2–24. doi: 10.1080/02652030701474235. [DOI] [PubMed] [Google Scholar]
- 7.Cross AJ, Ferrucci LM, Risch A, Graubard BI, Ward MH, Park Y, et al. A large prospective study of meat consumption and colorectal cancer risk: an investigation of potential mechanisms underlying this association. Cancer Res. 2010;70:2406–14. doi: 10.1158/0008-5472.CAN-09-3929. [DOI] [PMC free article] [PubMed] [Google Scholar]
- 8.Wang J, Joshi AD, Corral R, Siegmund KD, Marchand LL, Martinez ME, et al. Carcinogen metabolism genes, red meat and poultry intake, and colorectal cancer risk. Int J Cancer. 2012;130:1898–907. doi: 10.1002/ijc.26199. [DOI] [PMC free article] [PubMed] [Google Scholar]
- 9.Nothlings U, Yamamoto JF, Wilkens LR, Murphy SP, Park SY, Henderson BE, et al. Meat and heterocyclic amine intake, smoking, NAT1 and NAT2 polymorphisms, and colorectal cancer risk in the multiethnic cohort study. Cancer Epidemiol Biomarkers Prev. 2009;18:2098–106. doi: 10.1158/1055-9965.EPI-08-1218. [DOI] [PMC free article] [PubMed] [Google Scholar]
- 10.Ni W, McNaughton L, LeMaster DM, Sinha R, Turesky RJ. Quantitation of 13 heterocyclic aromatic amines in cooked beef, pork, and chicken by liquid chromatography-electrospray ionization/tandem mass spectrometry. J Agric Food Chem. 2008;56:68–78. doi: 10.1021/jf072461a. [DOI] [PubMed] [Google Scholar]
- 11.Kristal AR, Peters U, Potter JD. Is it time to abandon the food frequency questionnaire? Cancer Epidemiol Biomarkers Prev. 2005;14:2826–8. doi: 10.1158/1055-9965.EPI-12-ED1. [DOI] [PubMed] [Google Scholar]
- 12.Deziel NC, Buckley TJ, Sinha R, Abubaker S, Platz EA, Strickland PT. Comparability and repeatability of methods for estimating the dietary intake of the heterocyclic amine contaminant 2-amino-1-methyl-6-phenylimidazo[4,5b]pyridine (PhIP) Food Addit Contam Part A Chem Anal Control Expo Risk Assess. 2012;29:1202–11. doi: 10.1080/19440049.2012.682657. [DOI] [PMC free article] [PubMed] [Google Scholar]
- 13.Walters DG, Young PJ, Agus C, Knize MG, Boobis AR, Gooderham NJ, et al. Cruciferous vegetable consumption alters the metabolism of the dietary carcinogen 2-amino-1-methyl-6-phenylimidazo[4,5-b]pyridine (PhIP) in humans. Carcinogenesis. 2004;25:1659–69. doi: 10.1093/carcin/bgh164. [DOI] [PubMed] [Google Scholar]
- 14.Fede JM, Thakur AP, Gooderham NJ, Turesky RJ. Biomonitoring of 2-amino-1-methyl-6-phenylimidazo[4,5-b]pyridine (PhIP) and its carcinogenic metabolites in urine. Chem Res Toxicol. 2009;22:1096–105. doi: 10.1021/tx900052c. [DOI] [PMC free article] [PubMed] [Google Scholar]
- 15.Gu D, Raymundo MM, Kadlubar FF, Turesky RJ. Ultraperformance liquid chromatography-tandem mass spectrometry method for biomonitoring cooked meat carcinogens and their metabolites in human urine. Anal Chem. 2011;83:1093–101. doi: 10.1021/ac102918b. [DOI] [PMC free article] [PubMed] [Google Scholar]
- 16.Dingley KH, Curtis KD, Nowell S, Felton JS, Lang NP, Turteltaub KW. DNA and protein adduct formation in the colon and blood of humans after exposure to a dietary-relevant dose of 2-amino-1-methyl-6-phenylimidazo[4,5-b]pyridine. Cancer Epidemiol Biomarkers Prev. 1999;8:507–12. [PubMed] [Google Scholar]
- 17.Magagnotti C, Orsi F, Bagnati R, Celli N, Rotilio D, Fanelli R, et al. Effect of diet on serum albumin and hemoglobin adducts of 2-amino-1-methyl-6-phenylimidazo[4,5-b]pyridine (PhIP) in humans. Int J Cancer. 2000;88:1–6. doi: 10.1002/1097-0215(20001001)88:1<1::aid-ijc1>3.0.co;2-d. [DOI] [PubMed] [Google Scholar]
- 18.Friesen MD, Kaderlik K, Lin D, Garren L, Bartsch H, Lang NP, et al. Analysis of DNA adducts of 2-amino-1-methyl-6-phenylimidazo[4,5-b]pyridine in rat and human tissues by alkaline hydrolysis and gas chromatography/electron capture mass spectrometry: validation by comparison with 32P-postlabeling. Chem Res Toxicol. 1994;7:733–9. doi: 10.1021/tx00042a004. [DOI] [PubMed] [Google Scholar]
- 19.Magagnotti C, Pastorelli R, Pozzi S, Andreoni B, Fanelli R, Airoldi L. Genetic polymorphisms and modulation of 2-amino-1-methyl-6-phenylimidazo[4,5-b]pyridine (PhIP)-DNA adducts in human lymphocytes. Int J Cancer. 2003;107:878–84. doi: 10.1002/ijc.11492. [DOI] [PubMed] [Google Scholar]
- 20.DuPont RL, Baumgartner WA. Drug testing by urine and hair analysis: complementary features and scientific issues. Forensic Sci Int. 1995;70:63–76. doi: 10.1016/0379-0738(94)01625-f. [DOI] [PubMed] [Google Scholar]
- 21.Nakahara Y, Takahashi K, Kikura R. Hair analysis for drugs of abuse. X. Effect of physicochemical properties of drugs on the incorporation rates into hair. Biol Pharm Bull. 1995;18:1223–7. doi: 10.1248/bpb.18.1223. [DOI] [PubMed] [Google Scholar]
- 22.Gratacos-Cubarsi M, Castellari M, Valero A, Garcia-Regueiro JA. Hair analysis for veterinary drug monitoring in livestock production. J Chromatogr B Analyt Technol Biomed Life Sci. 2006;834:14–25. doi: 10.1016/j.jchromb.2006.03.007. [DOI] [PubMed] [Google Scholar]
- 23.Alexander J, Reistad R, Hegstad S, Frandsen H, Ingebrigtsen K, Paulsen JE, et al. Biomarkers of exposure to heterocyclic amines: approaches to improve the exposure assessment. Food Chem Toxicol. 2002;40:1131–7. doi: 10.1016/s0278-6915(02)00053-4. [DOI] [PubMed] [Google Scholar]
- 24.Reistad R, Nyholm SH, Huag LS, Becher G, Alexander J. 2-Amino-1-methyl-6-phenylimidazo[4,5-b]pyridine (PhIP) in human hair as biomarker for dietary exposure. Biomarkers. 1999;4:263–71. doi: 10.1080/135475099230796. [DOI] [PubMed] [Google Scholar]
- 25.Hashimoto H, Hanaoka T, Kobayashi M, Tsugane S. Analytical method of 2-amino-1-methyl-6-phenylimidazo[4,5-b]pyridine in human hair by column-switching liquid chromatography-mass spectrometry. J Chromatogr B Analyt Technol Biomed Life Sci. 2004;803:209–13. doi: 10.1016/j.jchromb.2003.12.029. [DOI] [PubMed] [Google Scholar]
- 26.Kobayashi M, Hanaoka T, Hashimoto H, Tsugane S. 2-Amino-1-methyl-6-phenylimidazo[4,5-b]pyridine (PhIP) level in human hair as biomarkers for dietary grilled/stir-fried meat and fish intake. Mutat Res. 2005;588:136–42. doi: 10.1016/j.mrgentox.2005.09.008. [DOI] [PubMed] [Google Scholar]
- 27.Bessette EE, Yasa I, Dunbar D, Wilkens LR, Marchand LL, Turesky RJ. Biomonitoring of carcinogenic heterocyclic aromatic amines in hair: A validation study. Chem Res Toxicol. 2009;22:1454–63. doi: 10.1021/tx900155f. [DOI] [PMC free article] [PubMed] [Google Scholar]
- 28.Boobis AR, Lynch AM, Murray S, de la Torre R, Solans A, Farré M, et al. CYP1A2-catalyzed conversion of dietary heterocyclic amines to their proximate carcinogens is their major route of metabolism in humans. Cancer Res. 1994;54:89–94. [PubMed] [Google Scholar]
- 29.Turesky RJ, Constable A, Richoz J, Varga N, Markovic J, Martin MV, et al. Activation of heterocyclic aromatic amines by rat and human liver microsomes and by purified rat and human cytochrome P450 1A2. Chem Res Toxicol. 1998;11:925–36. doi: 10.1021/tx980022n. [DOI] [PubMed] [Google Scholar]
- 30.Gu D, McNaughton L, LeMaster D, Lake BG, Gooderham NJ, Kadlubar FF, et al. A comprehensive approach to the profiling of the cooked meat carcinogens 2-amino-3,8-dimethylimidazo[4,5-f]quinoxaline, 2-amino-1-methyl-6-phenylimidazo[4,5-b]pyridine, and their metabolites in human urine. Chem Res Toxicol. 2010;23:788–801. doi: 10.1021/tx900436m. [DOI] [PMC free article] [PubMed] [Google Scholar]
- 31.Ozeki H, Ito S, Wakamatsu K, Thody AJ. Spectrophotometric characterization of eumelanin and pheomelanin in hair. Pigment Cell Res. 1996;9:265–70. doi: 10.1111/j.1600-0749.1996.tb00116.x. [DOI] [PubMed] [Google Scholar]
- 32.Le Marchand L, Franke AA, Custer L, Wilkens LR, Cooney RV. Lifestyle and nutritional correlates of cytochrome CYP1A2 activity: inverse associations with plasma lutein and alpha-tocopherol. Pharmacogenetics. 1997;7:11–9. doi: 10.1097/00008571-199702000-00002. [DOI] [PubMed] [Google Scholar]
- 33.Malfatti MA, Dingley KH, Nowell-Kadlubar S, Ubick EA, Mulakken N, Nelson D, et al. The urinary metabolite profile of the dietary carcinogen 2-amino-1-methyl-6-phenylimidazo[4,5-b]pyridine is predictive of colon DNA adducts after a low-dose exposure in humans. Cancer Res. 2006;66:10541–7. doi: 10.1158/0008-5472.CAN-06-1573. [DOI] [PubMed] [Google Scholar]
- 34.Hegstad S, Reistad R, Haug LS, Alexander J. Eumelanin is a major determinant for 2-amino-1-methyl-6-phenylimidazo[4,5-b]pyridine (PhIP) incorporation into hair of mice. Pharmacol Toxicol. 2002;90:333–7. doi: 10.1034/j.1600-0773.2002.900607.x. [DOI] [PubMed] [Google Scholar]
- 35.Sinha R, Rothman N, Brown ED, Mark SD, Hoover RN, Caporaso NE, Levander OA, Knize MG, Lang NP, Kadlubar FF. Pan-fried meat containing high levels of heterocyclic aromatic amines but low levels of polycyclic aromatic hydrocarbons induces cytochrome P4501A2 activity in humans. Cancer Res. 1994;54:6154–9. [PubMed] [Google Scholar]
- 36.Kintz P. Bioanalytical procedures for detection of chemical agents in hair in the case of drug-facilitated crimes. Anal Bioanal Chem. 2007;388:1467–74. doi: 10.1007/s00216-007-1209-z. [DOI] [PubMed] [Google Scholar]
- 37.Zhao K, Murray S, Davies DS, Boobis AR, Gooderham NJ. Metabolism of the food derived mutagen and carcinogen 2-amino-1-methyl-6-phenylimidazo[4,5-b]pyridine (PhIP) by human liver microsomes. Carcinogenesis. 1994;15:1285–8. doi: 10.1093/carcin/15.6.1285. [DOI] [PubMed] [Google Scholar]
- 38.Langouët S, Paehler A, Welti DH, Kerriguy N, Guillouzo A, Turesky RJ. Differential metabolism of 2-amino-1-methyl-6-phenylimidazo[4,5- b]pyridine in rat and human hepatocytes. Carcinogenesis. 2002;23:115–22. doi: 10.1093/carcin/23.1.115. [DOI] [PubMed] [Google Scholar]
- 39.Butler MA, Lang NP, Young JF, Caporaso NE, Vineis P, Hayes RB, et al. Determination of CYP1A2 and NAT2 phenotypes in human populations by analysis of caffeine urinary metabolites. Pharmacogenetics. 1992;2:116–27. doi: 10.1097/00008571-199206000-00003. [DOI] [PubMed] [Google Scholar]
- 40.Stillwell WG, Kidd LC, Wishnok JW, Tannenbaum SR, Sinha R. Urinary excretion of unmetabolized and phase II conjugates of 2-amino-1-methyl-6-phenylimidazo[4,5-b]pyridine and 2-amino-3,8-dimethylimidazo[4,5-f]quinoxaline in humans: Relationship to cytochrome P450 1A2 and N-acetyltransferase actvity. Cancer Res. 1997;57:3457–64. [PubMed] [Google Scholar]
- 41.Guengerich FP, Turvy CG. Comparison of levels of several human microsomal cytochrome P-450 enzymes and epoxide hydrolase in normal and disease states using immunochemical analysis of surgical liver samples. J Pharmacol Exp Ther. 1991;256:1189–94. [PubMed] [Google Scholar]
- 42.Gu D, Neuman ZL, Modiano JF, Turesky RJ. Biomonitoring the cooked meat carcinogen 2-amino-1-methyl-6-phenylimidazo[4,5-b]pyridine in canine fur. J Agric Food Chem. 2012;60:9371–75. doi: 10.1021/jf302969h. [DOI] [PMC free article] [PubMed] [Google Scholar]