Abstract
Vibro-acoustography (VA) is an ultrasound-based imaging modality that uses radiation force produced by two cofocused ultrasound beams separated by a small frequency difference, Δf, to vibrate tissue at Δf. An acoustic field is created by the object vibration and measured with a nearby hydrophone. This method has recently been implemented on a clinical ultrasound system using one-dimensional (1D) linear array transducers. In this article, we discuss VA beamforming and image formation using a 1.75D array transducer. A 1.75D array transducer has several rows of elements in the elevation direction which can be controlled independently for focusing. The advantage of the 1.75D array over a 1D linear array transducer is that multiple rows of elements can be used for improving elevation focus for imaging formation. Six configurations for subaperture design for the two ultrasound beams necessary for VA imaging were analyzed. The point-spread functions for these different configurations were evaluated using a numerical simulation model. Four of these configurations were then chosen for experimental evaluation with a needle hydrophone as well as for scanning two phantoms. Images were formed by scanning a urethane breast phantom and an ex vivo human prostate. VA imaging using a 1.75D array transducer offers several advantages over scanning with a linear array transducer including improved image resolution and contrast due to better elevation focusing of the imaging point-spread function.
I. Introduction
Vibro-acoustography (VA) is an ultrasound-based imaging modality that creates images of the acoustic response of an object undergoing stimulation from a harmonic ultrasound radiation force [1, 2]. VA uses two beams of ultrasound at slightly different frequencies, f1 and f2, which are separated by a small difference frequency (Δf = f1-f2), and focuses these beams at a common location to produce a modulated ultrasound radiation force at Δf. The object vibrates locally at the intersection of the two ultrasound beams, which creates an acoustic field called acoustic emission at Δf. This acoustic emission is measured by a nearby hydrophone. The co-localization point of the ultrasound beams is scanned over the object to obtain acoustic emission measurements at multiple locations to form an image.
The VA images depend on different physical characteristics including the ultrasound reflectivity and attenuation as well as the mechanical frequency response of the object at Δf. The resolution of the VA images is related to focusing of the ultrasonic beams, but the images do not have the speckle artifact associated with ultrasound B-mode images. VA imaging has been used in numerous biomedical and nondestructive applications [3-10]. A thorough review of the applications of VA is provided by Urban et al [11]. VA has been used to image several types of ex vivo tissues such as breast, liver, prostate, arteries and thyroid [4, 6-8, 12, 13]. In vivo studies have been conducted in pigs with calcified arteries and human patients with breast cancer [3, 5, 14]. Most of the results for these previously published studies were acquired using a two-element, spherically focused confocal transducer that was mechanically scanned in a water tank.
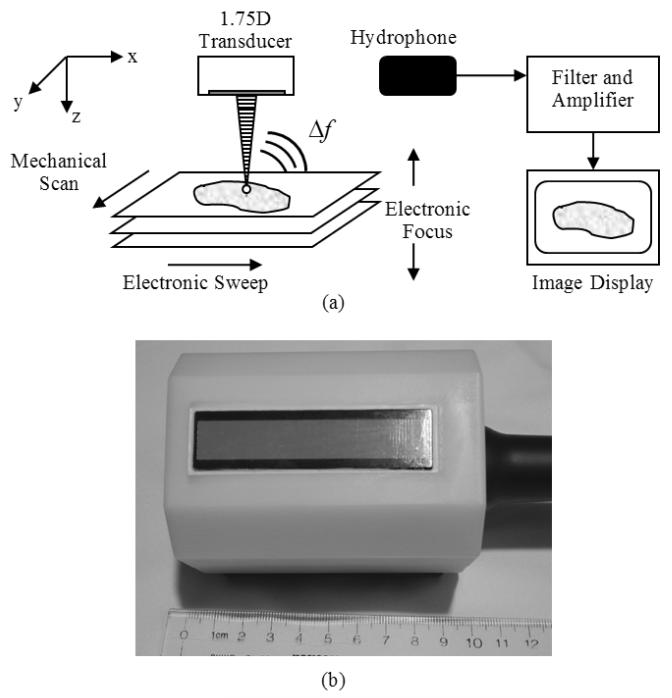
VA imaging has recently been implemented for use on a clinical ultrasound system, the General Electric (GE) Vivid 7 (GE Healthcare Ultrasound Cardiology, Horten, Norway) [15]. This implementation, which involved both hardware and software modifications, allows for generation and simultaneous transmission of two ultrasound beams of different frequencies using two separate subapertures. An illustration of the implementation of VA using an array transducer is shown in Fig. 1(a). Electronic focusing in a linear array transducer was used for steering the co-localization point of the two beams along the azimuthal direction (x-direction) of the transducer. The transducer was then moved in the elevation direction (y-direction) using a motorized probe holder to obtain subsequent lines for image formation because VA is inherently a C-scan modality. This design improved upon the most commonly used implementation of VA which requires the mechanical scanning of a two-element confocal transducer in two directions. The implementation of VA on the GE Vivid 7 allowed for decrease in the acquisition time to cover the same area with mechanical scanning of the confocal transducer by a factor of 4-5 [15]. Implementation with clinical one-dimensional (1D) linear arrays also moved the method closer towards clinical translation for VA imaging of the breast and thyroid because the transducer can be placed in contact with the skin instead of using a more complex system that requires a water tank to be coupled to the patient’s skin [5, 16].
Figure 1.
(a) Block diagram of vibro-acoustography performed with a 1.75D array transducer. The intersection of the two ultrasound beams is electronically swept in the azimuthal direction of the transducer and then mechanically scanned in the elevation direction of the transducer. The electronic focal depth can be changed to image different planes. The interaction of the two ultrasound beams in the tissue produces an acoustic signal at the difference frequency, Δf, between the two ultrasound beams. This acoustic emission is detected by a nearby hydrophone and the signal is filtered, amplified, digitized, and processed for image formation and display. (b) Photograph of 1.75D array transducer with white plastic casing.
Beamforming for VA has been studied extensively using different types of transducers. Different methods for generating the two ultrasound beams and making them intersect to produce the vibration at Δf have been studied. Chen et al., studied the use of a confocal transducer as well as using two separate transducers in an X-focal arrangement which created two intersecting co-planar beams and compared the point-spread functions (PSFs) that were produced by these configurations [17]. A few studies have been dedicated to exploring the use of two ultrasound beams produced by a linear array transducer for generating harmonic radiation force [15, 18, 19].
VA beamforming with a confocal transducer provides a symmetric PSF in the focal plane [17, 20]. Referring to Fig. 1(a), beamforming with a linear array transducer produces PSFs that are asymmetric, typically wider in the elevation direction (y-direction) as compared to the azimuthal (x-direction) focus. As a result, features in the object can appear elongated or blurred when mechanically scanning the linear array transducer in the elevation direction [15, 18]. An idealized PSF would have a symmetric or near-symmetric PSF in the focal plane, but we want to be able to generate this idealized PSF with an array transducer to take advantage of the electronic focusing capabilities and shorter scan times.
To generate such an idealized PSF with an array transducer, focusing in the elevation direction (y-direction) is necessary. Linear array transducers are typically manufactured with a fixed elevation lens. To achieve elevational focusing to varying degrees one can use 1.5D, 1.75D, and 2D array transducers [21]. Elevational focusing with these higher order array transducers can be employed by using electronic focusing techniques across the elements in different rows of the transducer. For a 1.5D array transducer, elevation aperture, shading, and focusing are variable but are symmetric about the elevation centerline. For the case of a 1.75D array, the symmetry condition is not held, but there are only a few elements in the elevation direction making symmetric focusing more difficult. In a 2D array transducer, elevation focusing capabilities are similar to that in the azimuthal direction (x-direction) and full electronic apodization, steering, and focusing are possible. A recent simulation study of the VA beam formation using a 2D reconfigurable array has been reported [22].
An improved VA method that uses an array transducer that produces a PSF that is symmetric or a nearly-symmetric in the focal plane could be useful for in vivo breast, thyroid, and prostate imaging. Towards this end we studied VA beamforming for a 1.75D transducer that could produce such a desired PSF. This study was focused on the use of a 1.75D array transducer and its ability to provide elevational focusing and implementing VA beamforming using the GE Vivid 7. We explored different ways to design the apertures for generating ultrasound beams with frequencies f1 and f2. We evaluated the PSFs created by these different configurations both numerically and experimentally. We tested these configurations for imaging a urethane breast phantom and an excised human prostate and compared these results to those obtained with a linear array transducer that has a fixed elevation lens.
II. Methods
We start with presenting VA beamforming theory to provide a foundation for evaluating different methods of designing different apertures for imaging. We introduce the 1.75D array transducer used for this study and its characteristics and limitations. Design approaches and criteria are presented, particularly with regards to the grating lobes associated with the particular transducer studied in this article. Lastly, numerical simulations and experiments were performed to evaluate the beamforming designs.
A. Vibro-acoustography Beamforming Theory
Though the theory has been presented in previous publications, we briefly present the beamforming theory for VA imaging for the benefit of the reader [2, 11, 15, 17]. The spatiotemporal definitions of the two ultrasound beams can be written as
| (1) |
| (2) |
where Pi(r) (i = 1, 2) is the spatial distribution of the pressure generated by the subaperture transmitting fi, φi(r) is the spatial distribution of the phase of the pressure, and r is defined as a spatial vector r = [x, y, z].
The two pressure beams will interact within the medium, which can mathematically be modeled by coherently combining the contributions of the two pressure fields
| (3) |
The radiation force produced by the combined pressure field is given as
| (4) |
where dr is the drag coefficient, S is the surface area of the object upon which the force is applied, and ⟨E⟩T is the short-term time average of the energy density, where energy density is defined as E = p2(r,t)/ρc2, where ρ is the medium density, c is the sound speed in the medium, and 1/f1 << T << 2/Δf [2]. We apply the short-term time average to the square of the total pressure. This mathematical step serves to filter out the high frequency terms leaving only dc terms and the term at Δf.
| (5) |
Thus, the second term in (5) is responsible for the dynamic component of F. This force interacts with an object and stimulates the creation of an acoustic field (acoustic emission) that is used to construct the VA image. The implication of (5) is that one can find the VA PSF if the spatial distributions P1(r) and P2(r) are known. This theoretical result provides a useful basis for performing simulations of the VA PSF.
B. Design of 1.75D Array Transducer
The 1.75D array transducer that we studied was designed by GE and manufactured by Tetrad, a subsidiary of W. L. Gore (Englewood, CO). A picture of the transducer is shown in Fig 1(b). The array has been encased in a plastic housing so that there is no metal touching a patient during contact scanning. The transducer has 12 rows and 70 columns of elements and each element is 0.9 × 0.9 mm. The total aperture size is 10.8 × 63.0 mm. The frequency range of the transducer is 5-8 MHz. As detailed by Urban et al. [15], the GE Vivid 7 can support transmission on 128 channels for VA. For our effective apertures for VA using the 1.75D transducer, we consider a 12 × 12 element square aperture to design our subapertures for f1 and f2. Out of the available 144 elements in this square, only 128 can be active and assigned a signal with frequency f1 or f2. The GE Vivid 7 allows for arbitrary assignment of the transmit signals to different channels, but the definition is the same for all beams. This ability to arbitrarily define the subapertures for f1 and f2, provides the flexibility to design different kinds of beams and PSFs. During scanning the active aperture is both steered and translated along the azimuthal direction over the total aperture of the transducer, similar to the method explained by Urban et al., for VA imaging with a linear array transducer [15].
1. Vibro-acoustography Point-Spread Function Criteria
One of the design criteria for VA beam formation is that the beams intersect in a predefined focal region. Ideally, the beams should be separated in space so that they only interact with each other at the specified focal region. This condition restricts the possible implementations that could be realized in designing the subapertures, but it also decreases the number of usable configurations, making evaluation of PSFs more streamlined.
As a result of these design criteria, it would not typically be desirable to interlace elements with different frequencies. This configuration creates beams that start to spatially interact very near the transducer surface. These ultrasound waves interact with each other and this phenomenon is known as scattering sound by sound or parametric mixing, which has been explored by Thuras, Westervelt, and others [23-26]. When two sound waves of different frequencies propagate together in a nonlinear medium, additional acoustic waves are produced at harmonics of the two original waves (2f1, 2f2) as well as at the sum (f1 + f2) and difference (f1 − f2) frequencies of the two different frequencies [27]. Water and soft tissue are both nonlinear media and can be characterized by the ratio of two coefficients, B and A, from the equation of state [28]. The B/A ratios for water and soft tissue are 5.0 and 6-11 [28], respectively, so this parametric mixing will occur at any location that the two waves exist. The signal from the parametric mixing occurs at the same frequency (f1 − f2) and approximately the same time as the acoustic emission originating from the intersection of the two beams, which makes it difficult to exactly differentiate the spatial location of the signal’s origin. This particular acoustic signal would not be spatially localized to the desired focal location. This ambiguity can lead to artifacts in the image that hinder image interpretation.
2. Grating Lobes with 1.75D Transducer
Another subject that must be addressed for this particular transducer is the large element size. At 8 MHz, assuming a sound speed of c = 1540 m/s, the wavelength is λ = 0.193 mm. With an element size of 0.9 mm (or 4.67λ) on a side, the array creates grating lobes in the field of interest. To avoid grating lobes, over the horizon-to-horizon angle range, the pitch of the elements in an array must be less than or equal to λ/2 [29], which for 8 MHz would be 0.096 mm. To avoid grating lobes altogether using the existing transducer with element size of 0.9 mm, the frequency would have to be set to 0.86 MHz, which is not feasible because the bandwidth of the transducer is not large enough, and the resolution at this frequency would not be acceptable.
To better understand the technical limitations associated with designing an optimal 1.75D transducer we consider various theoretical configurations. To achieve the same aperture size in the elevation direction (10.8 mm) while using square elements that have dimension λ/2, then assuming a frequency of 8 MHz we would need 113 elements on each side of the aperture. For the full 10.8 × 10.8 mm aperture currently considered it would require 12769 elements, which is far too many for current beamformers outside of using a reconfigurable array like that studied by Kamimura et al [22]. If a lower frequency that is within the bandwidth of the transducer is considered such as 5 MHz, it would still require a total of 5041 elements (71 × 71 elements) at λ/2 spacing (0.154 mm), which is still too large a number for individually addressing each element. The other approach is to consider a 12 element aperture at λ/2 spacing at either 5 or 8 MHz which would result in apertures that are only 1.85 or 1.16 mm, which is much too small for focusing beams and generating the intensity necessary for VA imaging. The 1.75D array studied here represents a compromise between aperture size and channel numbers, which results in the large element size.
Although grating lobes are present for ultrasound frequencies from 5-8 MHz, the advantage of being able to apply elevation focusing is reason to warrant the study of VA imaging with the 1.75D transducer. To mitigate the effects of the grating lobes, we studied the use of different ultrasound frequencies to drive the transducer. The effects of grating lobes are explored in later sections.
C. Vibro-acoustography Subaperture Design
The subaperture design process for VA beamforming with the 1.75D is somewhat restricted because we want to keep the beams separated. This restriction breaks down at some level, because we want to use the most elements possible to achieve as strong a radiation force as possible, which requires significant power. Therefore, we will have regions where elements having different frequencies will be adjacent. We used prior experience from VA beamforming studies with a confocal transducer and linear arrays to design the subapertures [2, 15, 18, 30].
Different subapertures producing P1(r) and P2(r) (see Eq. (5)) can be defined and simulated or implemented with the GE Vivid 7 and the resulting PSF can be evaluated numerically or experimentally. For more streamlined evaluation, simulations are useful as a preliminary step to rule out configurations that may not produce desirable PSFs.
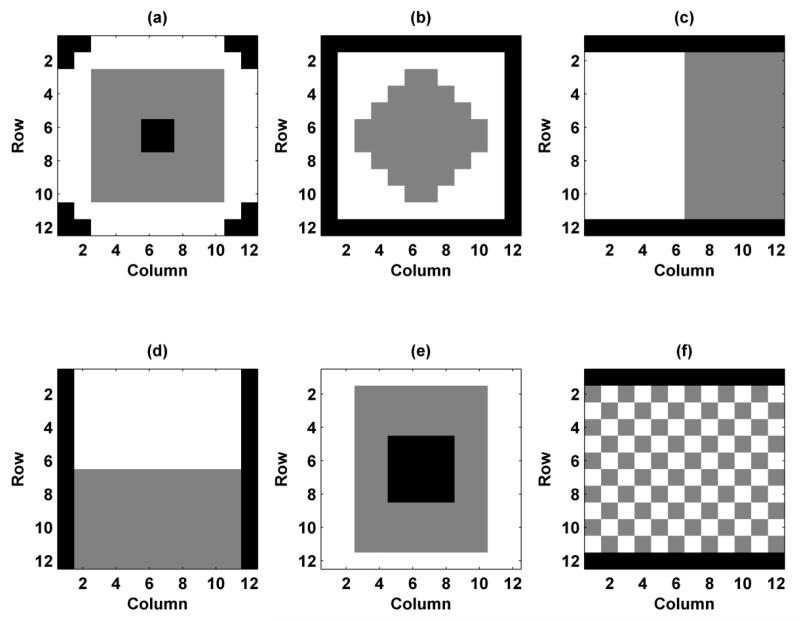
Though not shown in full, we evaluated many different configurations with preliminary simulations. In order to preserve brevity, we chose to more thoroughly study the six different configurations shown in Fig. 2. We labeled them as Configuration 1-6, where the white pixels represent elements assigned f1, the gray pixels represent elements assigned f2, and the black pixels represent inactive elements. Configuration 1 tries to mimic the confocal transducer that we have used in previous work with a central region defined as f1 and an outer ring defined as f2 [2]. Configuration 2 uses an inner diamond assigned to f1 and an outer region assigned to f2. Configurations 3 and 4 are split configurations in the horizontal and vertical directions, respectively. The horizontal split configuration has been studied for linear arrays both numerically and experimentally [15, 18, 19]. Configuration 5 has inactive elements in the middle and then two rings for frequencies f1 and f2. Configuration 6 has interlaced elements. In each of the configurations, the number of elements assigned to f1 and f2 are the same. Configurations 1-6 use 128, 100, 120, 120, 128, and 120 active elements, respectively. The time delays assigned to the elements are such that both beams at f1 and f2 focus at the joint focal point.
Figure 2.
Configurations for VA beamforming for 1.75D transducer. The white pixels represent elements assigned with f1, gray pixels represent elements assigned with f2, and black pixels represent inactive pixels. (a) Configuration 1, (b) Configuration 2, (c) Configuration 3, (d) Configuration 4, (e) Configuration 5, (f) Configuration 6.
D. Simulations
Simulations of the PSFs were performed using Field II [31, 32]. The different configurations shown in Fig. 2 were implemented in Field II using an apodization operation. Essentially, two apertures were defined, one for f1 and one for f2. For each spatial location that was evaluated, the pressure signals were simulated and synchronized based on the starting time given by Field II. The two pressure signals were added, and the sum was squared. A fast Fourier transform was applied to the squared total pressure, and the magnitude information at Δf was extracted from the frequency-domain representation of the signal. This quantity is proportional to the second term in (5), which is the dynamic component of the radiation force. As was discussed before, this force is proportional to the acoustic emission measured at the hydrophone, which is used to form the VA image.
Using this simulation platform, we evaluated the different configurations as well as the role of other parameters such as ultrasound frequency in image formation. We evaluated the PSFs in the azimuthal/axial (x-z) and azimuthal/elevation (x-y) planes, where the coordinate system is depicted in Fig. 1(a). All simulations were performed with resolution of Δx = Δy = 0.05 mm and Δz = 0.25 mm. The electronic focal distance was varied to values of zf = 15, 20, 25, 30, and 35 mm, which are suitable values for most VA applications such as breast or thyroid imaging. For each configuration we measured the resolution by finding the full-width at half maximum (FWHM) or −6 dB resolution for the x-, y-, and z-directions, and these values are denoted as Rx, Ry, and Rz, respectively. The resolution in the z-direction, Rz, can also be described as the imaging depth-of-field [33]. We explored the relative heights of the grating lobes at different ultrasound frequencies to determine an optimal trade-off for minimizing grating lobes while staying within the usable bandwidth of the transducer. While using Configuration 4 and setting Δf = 51.5 kHz, we varied the ultrasound frequency using values of 5.00, 6.00, 7.00, and 8.00 MHz. Based on the results from these preliminary simulations, which will be described later, we chose an ultrasound frequency of 5.00 MHz for the rest of the simulation results.
To assess the impact of the grating lobes on the PSF, we evaluated the intensity IΔf = ⟨p2(r,t)⟩Δf/ρc that would contribute to the radiation force at frequency Δf as the force and intensity are both proportional to ⟨p2(r,t)⟩Δf. We computed the power in the focal plane by evaluating the surface integral of IΔf.
| (6) |
We evaluated the power present in the central region of the PSF which includes the main lobe and nearby sidelobes and defined a ratio of the power contained within a central region to the total power measured in the focal plane. In typical VA imaging applications with confocal or linear array transducers, the image is formed by the main lobe and sidelobes. In the case of the 1.75D transducer we have the main lobe, sidelobes, and grating lobes, so we differentiate between the central region with the main lobe and sidelobes and the undesired peripheral grating lobes. We define PI,c as the power in the center and PI,T as the total power, where the boundary between the center and periphery is defined as the radial distance, rc, at the focal point. For these studies, rc = 3 mm. The power ratio, PR, is given by
| (7) |
This ratio grows closer to 1 as the influence of grating lobes decreases, because more of the beam power is contained in the center of the field with the main lobe.
Secondly, we compared relative levels of peak intensity between the different configurations and focal depths, so we calculated the maximum normalized intensity, MNI, which used the maximum value from each configuration, IΔf,n, and was normalized by the maximum value in the set of maxima from different configurations, {IΔf,1, IΔf,2,…, IΔf,N}.
| (8) |
Each configuration produces a different intensity distribution, but this metric assists in comparing the peak intensity of the main lobe between the different configurations considered. The MNI values were calculated for the whole data set including all focal depths.
We also define a scaled power ratio, SPR, which is the product of PR and the MNI.
| (9) |
This metric scales the PR according to the relative strength at the focus, which is represented by MNI. This metric incorporates both the power distribution and the peak intensity to provide a more comprehensive comparative metric. Lastly, we measured the grating lobe magnitude, GLM, with respect to the main lobe magnitude (units of dB) in the elevation, GLMy, and azimuthal, GLMx, directions in the focal plane.
E. Experiments
To validate the simulations, we performed needle hydrophone measurements with the same apertures used in the simulations as implemented with the GE Vivid 7. We then performed two phantom experiments with a urethane breast phantom and an excised human prostate embedded in gelatin which were used previously by Urban et al [15]. For the experimental tests, we used only Configurations 1-4, because Configurations 5 and 6 produced substantially higher grating lobes and lower values for the evaluation metrics. These characteristics will be demonstrated in the Results and Discussion.
1. Needle Hydrophone Measurements
We implemented Configurations 1-4 on the GE Vivid 7 using f1 = 5.0000 MHz and f2 = 4.9485 MHz such that Δf = 51.5 kHz and focused the beams at a depth of zf = 25 mm. We used an ultrasound needle hydrophone (HGL-0200, Onda Corporation, Sunnyvale, CA) having an active element with 0.200 mm diameter and a 20 dB preamplifier (AH-2000, Onda Corporation, Sunnyvale, CA) that was scanned in the azimuthal direction (x-direction) of the transducer in the focal plane and along the axial direction (z-direction) in the middle of the array (x = 0). The azimuthal and axial profiles obtained were compared with the simulation results for each configuration.
2. Phantom Imaging
A urethane breast phantom with multiple lesions (CIRS Model 013, Norfolk, CT) was mounted in a large water tank (100 × 64 × 36 cm) and scanned with the 1.75D array transducer. A schematic drawing of the phantom and the lesion locations is included with the imaging results. The subaperture was steered and translated electroncially across the larger physical aperture in the azimuthal direction for each line of the image and then was mechanically translated by a motorized stage over the phantom. The audio hydrophone (6050C, International Transducer Corporation, Santa Barbara, CA) was placed underneath the phantom and outside of the transmitted ultrasound beams. Acoustic emission data was filtered with a bandpass filter (SR650, Stanford Research Systems, Sunnyvale, CA) and digitized (ATS460, Alazartech, Montreal, QC, Canada). Images were acquired using Configurations 1-4. We analyzed the contrast of the lesions in the phantom using the contrast-to-noise ratio, CNR, which is defined as
| (10) |
where μo is the mean of the lesion, μb is the mean of the background, and σb is the standard deviation of the background.
A human cadaveric prostate gland was excised and used for this study. The use of this specimen was in compliance with a protocol approved by the Mayo Clinic Institutional Review Board. The prostate was fixed in formalin for one hour and then embedded in a gelatin mixture. The phantom material was made from 300 Bloom gelatin powder (Sigma-Aldrich, St. Louis, MO) and glycerol (Sigma-Aldrich, St. Louis, MO) with concentrations of 10% by volume. A preservative of potassium sorbate (Sigma-Aldrich, St. Louis, MO) was also added with a concentration of 10 g/L. To avoid the presence of bubbles in the gelatin, the prostate was degassed with the gelatin before being placed into a mold. The prostate was placed in a water tank in a similar manner as the breast phantom. VA images were acquired using Configurations 1-4, which were chosen for experimental evaluation. An X-ray image was also taken with a stereotactic mammography system (Mammotest™ System Fischer Imaging Inc., Broomfield, CO) with an imaging field of 50.0 × 50.0 mm. For comparison purposes, an image was also made using a linear array transducer (7L, GE Healthcare Ultrasound Cardiology, Horten, Norway). This transducer has 192 elements, element pitch of 0.243 mm and element height of 6 mm. A split aperture was used such that 64 elements were assigned a frequency of f1 = 3.64 MHz and the other 64 elements were assigned f2 = 3.58 MHz making Δf = 54.3 kHz. At each pixel location, for both the linear array and 1.75D array transducers, ultrasound tonebursts of 333 μs duration were transmitted and shaded by a 3 kHz raised sine wave [15]. The data acquisition was similar to that used for the scans with the 1.75D array transducer.
In our prior work we found that there is a variation in the amplitude of the acoustic emission signal along the azimuthal direction for which we have not been able to definitively identify the source [15]. As the transducer is mechanically scanned, these variations manifest as streaks in the elevational translation direction. The streaks are related to beam formation because as the focal depth or the configuration is changed, the streaks change in a deterministic way. We hypothesize that the possible causes may be inhomogeneity in element sensitivity, inaccuracy in steering of the beam, or a combination of these factors. We have devised a streak removal algorithm based on a moving window method that estimates the azimuthal amplitude variation profile and removes it from the image data. All the images shown have been corrected for this streak artifact.
A new algorithm for improving the contrast in VA images has been devised called complex background suppression [34]. The method uses the complex amplitude values derived from the magnitude and phase of the acoustic emission data to subtract the unwanted background signal. This method is a fast, linear approach to improving image quality. This algorithm was applied after streak correction was used.
III. Results
A. Simulations
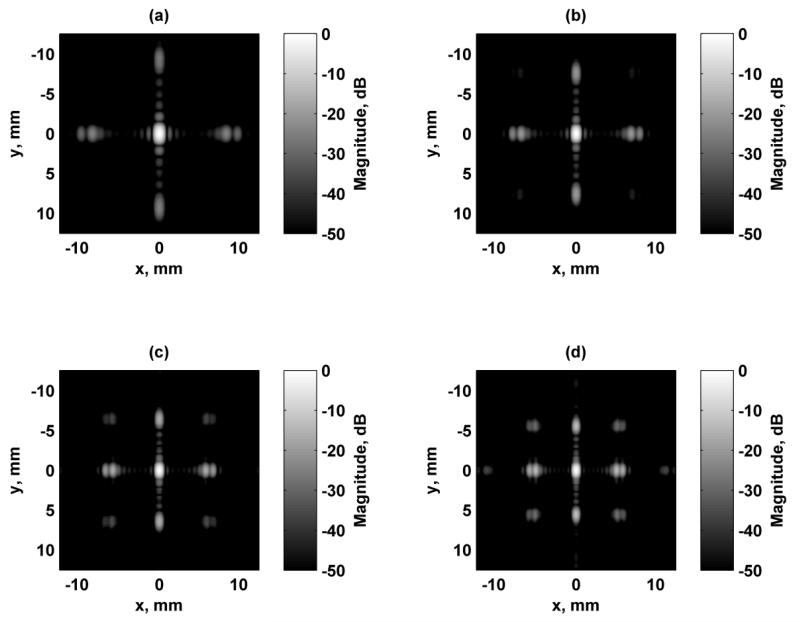
The first aspect of designing the beams formed using this 1.75D array transducer was addressing the presence of grating lobes because the elements were relatively large (0.9 × 0.9 mm) compared to the ultrasound wavelength. In order to reduce the influence of grating lobes, we simulated the response at several ultrasound frequencies. At the higher frequencies tested such as 7 and 8 MHz, the grating lobes are quite high. We simulated the responses in the focal plane when the transducer was focused at zf = 25 mm using Configuration 4, and those results are shown in Fig. 3. As the ultrasound frequency increases the grating lobes increase and move closer to the main lobe while the resolution of the PSF improves. The metrics discussed above were evaluated for each of these excitation fields and are summarized in Table I. The PR, MNI, SPR were maximal and the grating lobe heights were the lowest when 5 MHz was used for the ultrasound frequency. Even though the resolution is poorest at 5 MHz, the other parameters related to the grating lobes are improved, particularly the grating lobe heights. Configuration 4 was chosen as a representative configuration for this test. Though not shown, the trends for the other configurations are similar in terms of the grating lobe levels and location variation as the ultrasound frequency is changed. Because of these factors, particularly grating lobe heights, 5 MHz was used for all subsequent simulations.
Figure 3.
Comparison of simulated excitation fields in the focal plane (x-y) for different ultrasound frequencies using Configuration 4. All figures are independently normalized and displayed on a logarithmic scale for better visualization of the grating lobes. For all cases, Δf = 50 kHz. (a) f1 = 5 MHz, (b) f1 = 6 MHz, (c) f1 = 7 MHz, (d) f1 = 8 MHz.
Table I.
Evaluation metrics for VA beamforming with different ultrasound frequencies
| Frequency, MHz | Rx, mm | Ry, mm | Rz, mm | PR | MNI | SPR | GLMx, dB | GLMy, dB |
|---|---|---|---|---|---|---|---|---|
| 5 | 0.81 | 1.31 | 10.27 | 0.66 | 1.00 | 0.66 | −24.56 | −26.57 |
| 6 | 0.71 | 1.15 | 9.26 | 0.56 | 0.73 | 0.41 | −20.23 | −20.82 |
| 7 | 0.63 | 1.05 | 8.76 | 0.47 | 0.50 | 0.24 | −16.69 | −16.70 |
| 8 | 0.59 | 1.01 | 8.91 | 0.38 | 0.33 | 0.13 | −13.67 | −13.52 |
Rx, Ry, Rz: - 6 dB resolution in x-, y-, and z-directions; PR: Power Ratio, MNI: Maximum Normalized Intensity; SPR: Scaled Power Ratio; GLMx, GLMy: Grating Lobe Magnitude in x-, and y-directions.
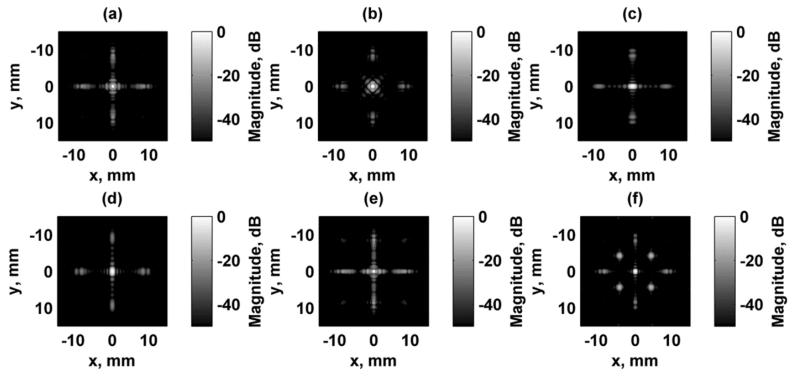
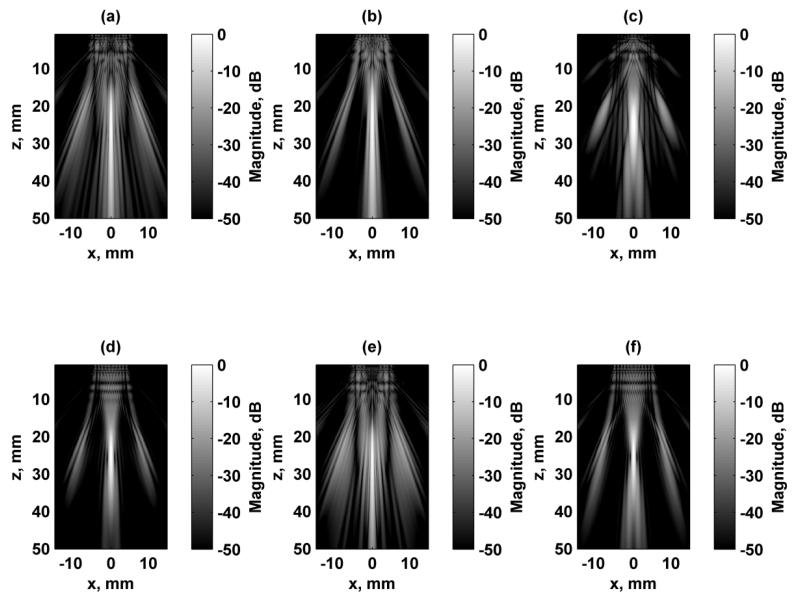
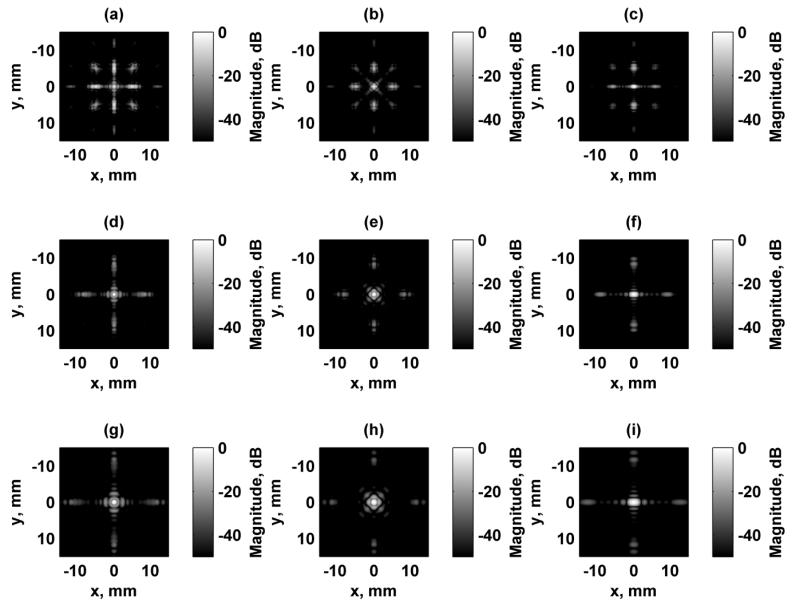
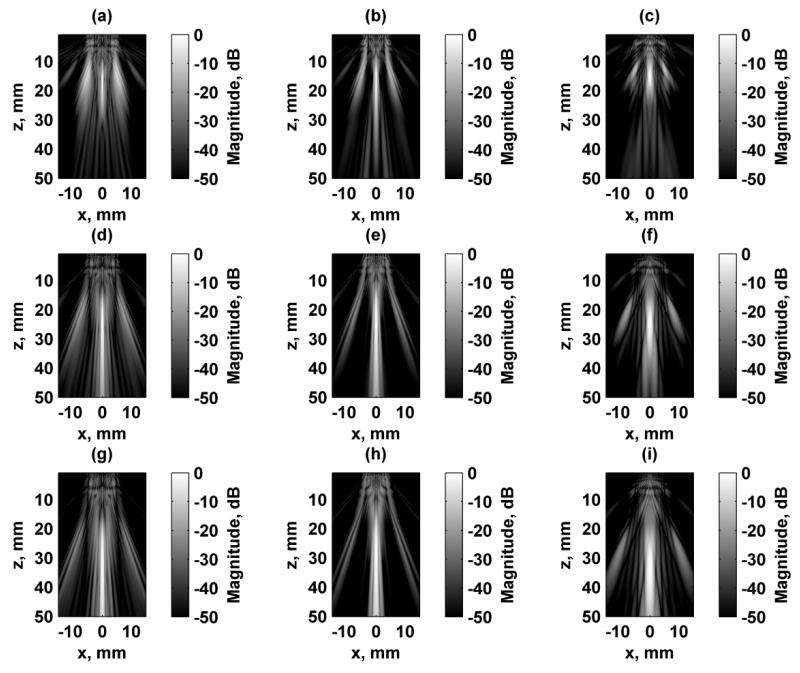
Simulation of the excitation fields for a focused excitation field at zf = 25 mm are shown in Figs. 4 and 5 for the focal plane (x-y) and azimuthal/axial (x-z) planes, respectively. Each of the fields were independently normalized and logarithmically scaled so that the grating lobes could be appreciated. The dynamic range of the images was 50 dB. Configurations 1, 2, and 6 produce a rotationally symmetric response when rotated by 90° as shown in Figs. 4(a), (b), and (f). Configurations 3 and 4 produce responses that are replicas of each other except for a 90° rotation. Figure 6 shows the focal plane PSF simulation results for Configurations 1, 2, and 3 at focal depths of zf = 15, 25, and 35 mm. The azimuthal/axial planes for the same configurations at zf = 15, 25, and 35 mm are shown in Fig. 7.
Figure 4.
Simulated focal plane (x-y) VA excitation fields. All figures are independently normalized and displayed on a logarithmic scale for better visualization of the grating lobes. (a) Configuration 1, (b) Configuration 2, (c) Configuration 3, (d) Configuration 4, (e) Configuration 5, (f) Configuration 6.
Figure 5.
Simulated axial-azimuthal plane (x-z) VA excitation fields. All figures are independently normalized and displayed on a logarithmic scale for better visualization of the grating lobes. (a) Configuration 1, (b) Configuration 2, (c) Configuration 3, (d) Configuration 4, (e) Configuration 5, (f) Configuration 6.
Figure 6.
Simulated focal plane (x-y) VA excitation fields. All figures are independently normalized and displayed on a logarithmic scale for better visualization of the grating lobes. (a) Configuration 1, zf = 15 mm, (b) Configuration 2, zf = 15 mm, (c) Configuration 3, zf = 15 mm, (d) Configuration 1, zf = 25 mm, (e) Configuration 2, zf = 25 mm, (f) Configuration 3, zf = 25 mm (g) Configuration 1, zf = 35 mm, (h) Configuration 2, zf = 35 mm, (i) Configuration 3, zf = 35 mm.
Figure 7.
Simulated axial-azimuthal (x-z) VA excitation fields. All figures are independently normalized and displayed on a logarithmic scale for better visualization of the grating lobes. (a) Configuration 1, zf = 15 mm, (b) Configuration 2, zf = 15 mm, (c) Configuration 3, zf = 15 mm, (d) Configuration 1, zf = 25 mm, (e) Configuration 2, zf = 25 mm, (f) Configuration 3, zf = 25 mm (g) Configuration 1, zf = 35 mm, (h) Configuration 2, zf = 35 mm, (i) Configuration 3, zf = 35 mm.
The evaluation metrics presented above are summarized in Table II for the six configurations and five different focal depths. The PR and SPR were consistently the best for Configurations 3 and 4. The MNI values were highest when zf = 20 mm and were computed for the whole data set including all configurations and focal depths. The grating lobe heights reduced as the focal distance increased. The grating lobe heights were consistently larger for Configurations 5 and 6 compared to the other configurations. The resolution metrics increase with increased focal depth. The in-plane resolution was consistently the best for Configuration 5. The depth-of-field, Rz, was lowest for Configurations 3, 4, and 6, and largest for Configuration 2. Because of the consistently high grating lobes for Configurations 5 and 6, and particularly because of the interlacing for Configuration 6, these configurations were not used for the experimental evaluations.
Table II.
Evaluation metrics for VA beamforming with different configurations at different focal depths (zf) at 5 MHz
|
zf, mm |
Configuration |
Rx, mm |
Ry, mm |
Rz, mm |
PR | MNI | SPR |
GLMx, dB |
GLMy, dB |
Active Elements |
|---|---|---|---|---|---|---|---|---|---|---|
| 15 | 1 | 0.46 | 0.46 | 7.75 | 0.15 | 0.47 | 0.07 | −5.53 | −5.53 | 128 |
| 2 | 0.53 | 0.53 | 9.15 | 0.31 | 0.71 | 0.22 | −14.04 | −14.04 | 100 | |
| 3 | 1.01 | 0.59 | 5.43 | 0.41 | 0.81 | 0.34 | −14.35 | −18.21 | 120 | |
| 4 | 0.59 | 1.01 | 5.43 | 0.41 | 0.81 | 0.34 | −18.21 | −14.35 | 120 | |
| 5 | 0.40 | 0.47 | 6.63 | 0.12 | 0.25 | 0.03 | −1.40 | −0.45 | 128 | |
| 6 | 0.56 | 0.59 | 5.43 | 0.14 | 0.81 | 0.11 | −8.05 | −8.05 | 120 | |
|
| ||||||||||
| 20 | 1 | 0.56 | 0.56 | 12.45 | 0.36 | 0.93 | 0.33 | −15.80 | −15.80 | 128 |
| 2 | 0.66 | 0.66 | 13.68 | 0.51 | 0.84 | 0.43 | −21.22 | −21.22 | 100 | |
| 3 | 1.13 | 0.69 | 7.40 | 0.56 | 1.00 | 0.56 | −20.24 | −22.02 | 120 | |
| 4 | 0.69 | 1.13 | 7.40 | 0.56 | 1.00 | 0.56 | −22.02 | −20.24 | 120 | |
| 5 | 0.49 | 0.54 | 10.35 | 0.28 | 0.68 | 0.19 | −12.44 | −12.53 | 128 | |
| 6 | 0.62 | 0.69 | 7.40 | 0.23 | 1.00 | 0.23 | −11.59 | −11.59 | 120 | |
|
| ||||||||||
| 25 | 1 | 0.69 | 0.69 | 17.10 | 0.50 | 0.98 | 0.49 | −21.41 | −21.41 | 128 |
| 2 | 0.81 | 0.81 | 18.18 | 0.62 | 0.74 | 0.46 | −25.86 | −25.86 | 100 | |
| 3 | 1.34 | 0.82 | 10.30 | 0.66 | 0.95 | 0.62 | −24.57 | −25.25 | 120 | |
| 4 | 0.82 | 1.34 | 10.30 | 0.66 | 0.95 | 0.62 | −25.25 | −24.57 | 120 | |
| 5 | 0.60 | 0.64 | 14.45 | 0.41 | 0.80 | 0.33 | −18.20 | −18.61 | 128 | |
| 6 | 0.71 | 0.82 | 10.30 | 0.31 | 0.95 | 0.29 | −13.48 | −13.48 | 120 | |
|
| ||||||||||
| 30 | 1 | 0.81 | 0.81 | 21.68 | 0.58 | 0.88 | 0.51 | −25.37 | −25.37 | 128 |
| 2 | 0.95 | 0.95 | 22.60 | 0.69 | 0.62 | 0.43 | −29.23 | −29.23 | 100 | |
| 3 | 1.57 | 0.96 | 13.73 | 0.72 | 0.82 | 0.59 | −27.97 | −28.02 | 120 | |
| 4 | 0.96 | 1.57 | 13.73 | 0.72 | 0.82 | 0.59 | −28.02 | −27.97 | 120 | |
| 5 | 0.72 | 0.75 | 18.80 | 0.49 | 0.77 | 0.37 | −22.24 | −22.74 | 128 | |
| 6 | 0.82 | 0.96 | 13.73 | 0.37 | 0.82 | 0.30 | −14.56 | −14.56 | 120 | |
|
| ||||||||||
| 35 | 1 | 0.94 | 0.94 | 25.83 | 0.64 | 0.75 | 0.48 | −28.42 | −28.42 | 128 |
| 2 | 1.11 | 1.11 | 26.53 | 0.72 | 0.50 | 0.36 | −31.86 | −31.86 | 100 | |
| 3 | 1.81 | 1.11 | 17.53 | 0.75 | 0.68 | 0.51 | −30.71 | −27.76 | 120 | |
| 4 | 1.11 | 1.81 | 17.53 | 0.75 | 0.68 | 0.51 | −27.76 | −30.71 | 120 | |
| 5 | 0.83 | 0.86 | 23.30 | 0.54 | 0.68 | 0.37 | −25.42 | −23.34 | 128 | |
| 6 | 0.94 | 1.11 | 17.53 | 0.41 | 0.68 | 0.28 | −15.11 | −15.11 | 120 | |
B. Experimental Results
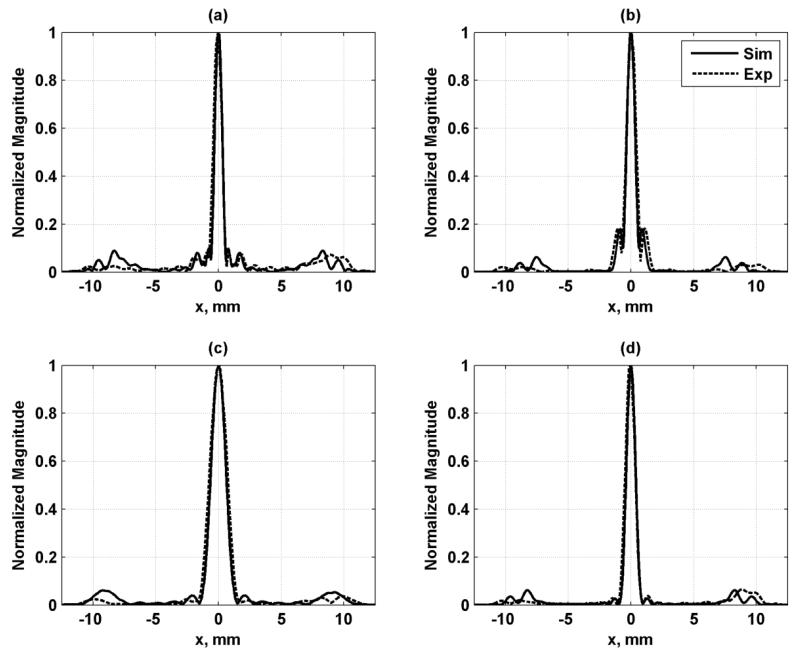
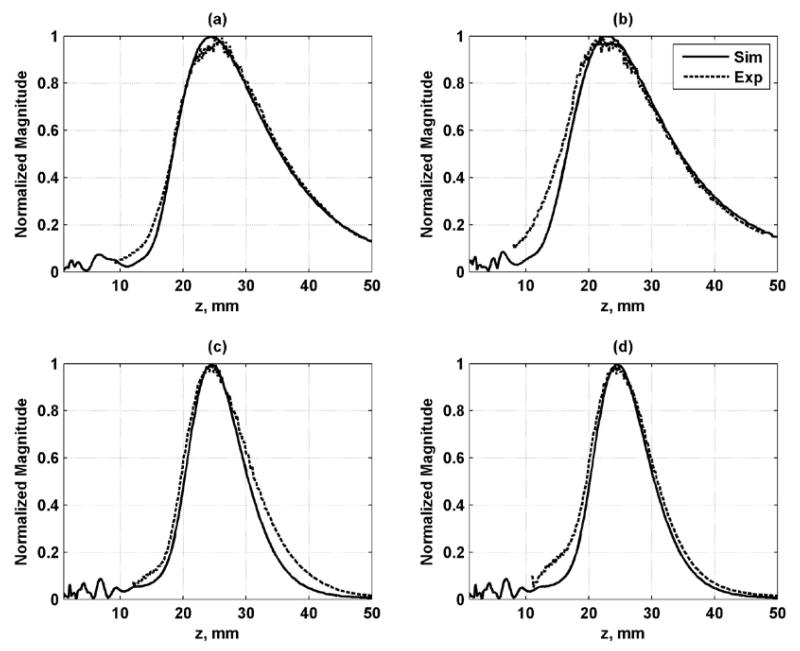
Needle hydrophone measurements were performed to validate the simulation results. Good agreement between the simulation and experimental results was found in azimuthal and axial profiles as shown in Figs. 8 and 9, respectively. These simulations provide an evaluation of the resolution of the PSF as well as the levels of the grating lobes.
Figure 8.
Azimuthal profiles for each configuration in the focal plane. The solid line is the simulation result and dashed line is the experimental result. (a) Configuration 1, (b) Configuration 2, (c) Configuration 3, (d) Configuration 4.
Figure 9.
Axial profiles for each configuration along beam axis at x = y = 0. The solid line is the simulation result and dashed line is the experimental result. (a) Configuration 1, (b) Configuration 2, (c) Configuration 3, (d) Configuration 4.
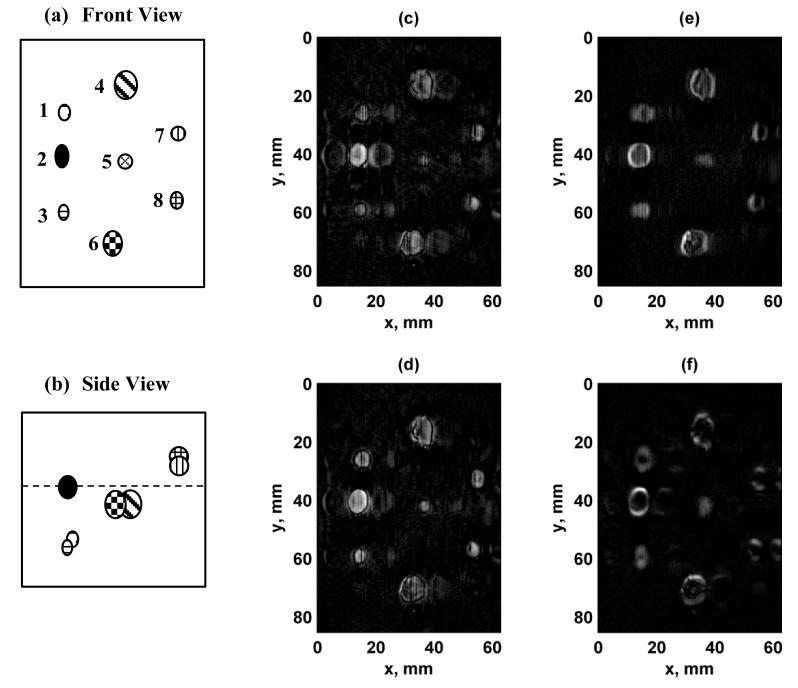
We evaluated the implementation of VA imaging using two phantoms, a urethane breast phantom and an ex vivo human prostate. The vertical dimension of the images corresponds to mechanical translation of the transducer, while the horizontal direction corresponds to the electronic scanning along the azimuthal direction of the transducer. Figure 10 shows the results from scanning the urethane breast phantom. The contrast is high in all of the images, but “ghost” images, caused by the grating lobes, of some of the lesions within the phantom can be detected, particularly for using Configurations 1 and 2, while hints of the “ghosts” can be seen using Configuration 4 on the left side of the image. Another aspect that was observed for Configurations 3 and 4 was that the borders were brighter in one direction versus another. This characteristic was not present in the images formed with Configurations 1 or 2 because of the symmetric nature of the PSF.
Figure 10.
Images of breast phantom with different configurations. (a) Front view schematic of breast phantom lesions. The lesions are labeled from 1-8. The scale is the same as panels (c)-(f), (b) Side view of breast phantom lesions. The front surface of the phantom corresponds to the top edge of the image, and the dashed line represents the focal plane at zf = 25 mm. (c) Configuration 1, (d) Configuration 2, (e) Configuration 3, (f) Configuration 4. The azimuthal direction of the 1.75D transducer corresponds to the horizontal axis of the image and the mechanical translation of the transducer in the elevation direction corresponds to the vertical axis. [Images in (a) and (b) were adapted from [15]. © 2011 IEEE.]
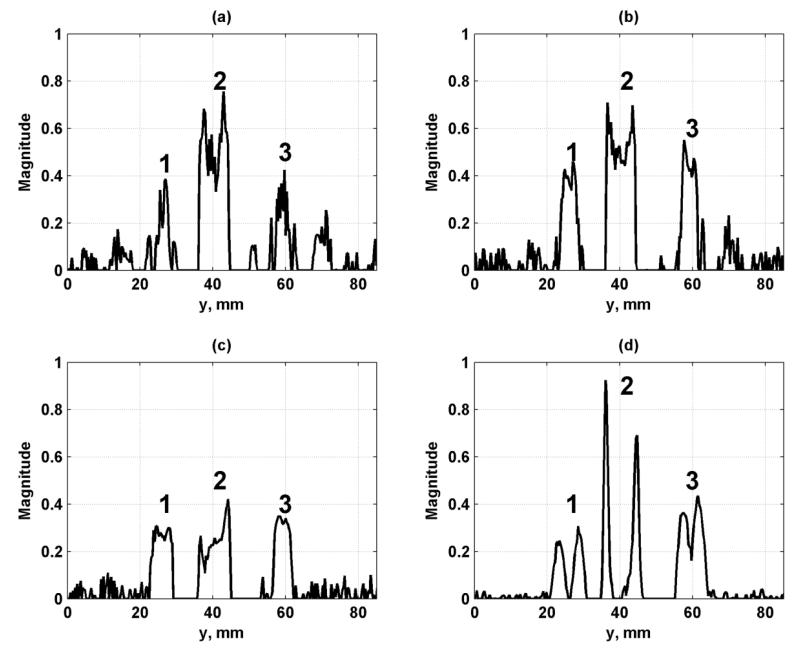
We analyzed a set of profiles through the row of lesions on the left of the images in Fig. 10(c)-(f) at x = 14.1 mm and these profiles are shown in Fig. 11. The topmost lesion, referred to as lesion 1, in the row in Figs. 10(c)-(f) corresponds to the leftmost lesion in the plots in Fig. 11. The other lesions from left to right in the plots in Fig. 11 are referred to as lesions 2 and 3, respectively. We quantified the CNR of the three lesions from the profiles in Fig. 11. The CNR values were tabulated in Table III and showed consistently high contrast for Configurations 2 and 3.
Figure 11.
Profiles of simulated lesions from Fig. 10 at x = 14.1 mm. (a) Configuration 1, (b) Configuration 2, (c) Configuration 3, (d) Configuration 4. The lesions are referred to in the text as lesions 1-3, moving from left to right, and follow the labeling in Fig. 10(a).
Table III.
Contrast-to-noise ratio for breast phantom lesions
| Configuration | ||||
|---|---|---|---|---|
| Lesion |
|
|||
| 1 | 2 | 3 | 4 | |
| 1 | 2.36 | 6.19 | 9.42 | 1.37 |
| 2 | 8.86 | 10.52 | 8.68 | 2.05 |
| 3 | 2.99 | 7.29 | 9.62 | 3.29 |
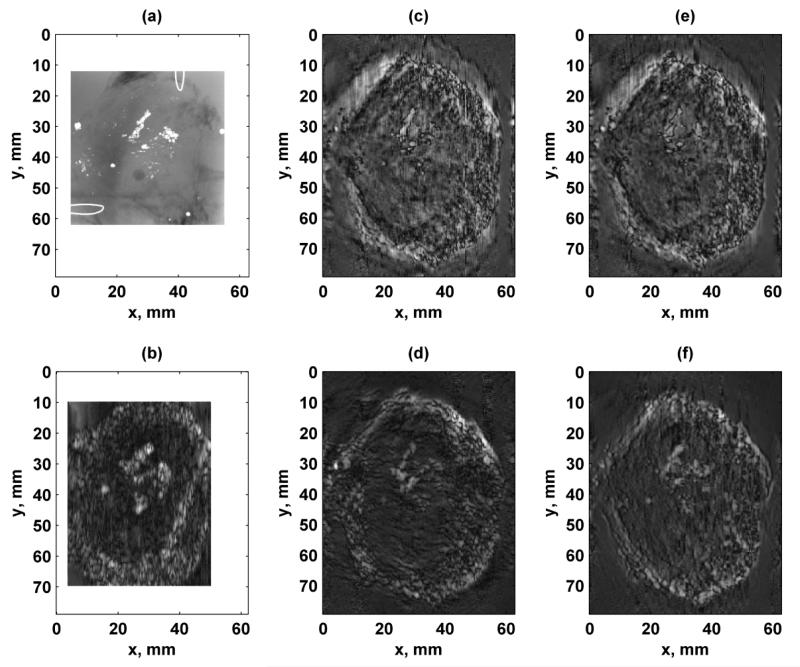
Images of an ex vivo human prostate are shown in Fig. 12. For comparison, an X-ray image and an image formed using VA with a linear array transducer are shown in Fig. 12(a)-(b), respectively. The X-ray image shows different clusters of calcifications. The image formed using the linear array transducer was able to depict the calcifications, but the calcifications appear larger. White borders were placed around the X-ray and linear array images to compare with the 1.75D array images that had a larger field of view. The images formed using the 1.75D array transducer using the different configurations (Figs. 12(c)-(f)) also show the calcifications with well-defined edges. The interior of the prostate called the central zone which had a smooth texture can be differentiated from the peripheral zone of the gland which had a more coarse texture. The edges seemed to be sharper when Configuration 1 or 2 was used (Figs. 12(c)-(d)), due to the symmetry of the PSFs. The contrast was higher in the images formed using Configurations 3 and 4 (Figs. 12(e)-(f)).
Figure 12.
Images of ex vivo human prostate with different configurations. (a) X-ray of prostate where calcium clusters are white. Wire loops in upper right and lower left corners are fiducial markers. The X-ray image is 50.0 × 50.0 mm, (b) VA image acquired using linear array transducer with f1 = 3.64 MHz and Δf = 54.3 kHz. White borders were placed around the X-ray and linear array images to make the full images of a comparable size with the images formed with the 1.75D array, (c) Configuration 1, (d) Configuration 2, (e) Configuration 3, (f) Configuration 4. The azimuthal direction of the linear and 1.75D array transducers corresponds to the horizontal axis of the image and the mechanical translation of the transducer in the elevation direction corresponds to the vertical axis. [Images in (a) and (b) were adapted from [15]. © 2011 IEEE.]
IV. Discussion
Numerical simulations were used to determine the optimal ultrasound frequency to use in this study. The decision to use 5 MHz was based on the larger grating lobes found when frequencies 6-8 MHz were used. Further beamforming simulation studies examined the PSFs produced by six different subaperture designs. The GE system allows for arbitrary assignment of apertures for the two ultrasound frequencies, which provides a great deal of flexibility to design the PSFs for VA imaging. These different configurations were quantitatively evaluated using several metrics including spatial resolution and metrics related to the energy in the main lobe of the beam compared to the energy in the grating lobes (see Table II). The PR, MNI, and SPR metrics were highest in the focal range of 20-30 mm. The spatial resolution was best at shallower focal depths while the grating lobe heights were diminished the most at deeper focal depths.
The confocal-like, diamond shaped, and interlaced configurations (Configurations 1, 2, and 6) were symmetric and produced rotationally symmetric PSFs. The horizontal and vertical split and dual ring configurations (Configurations 3, 4, and 5) were asymmetric and as a result produced asymmetric PSFs. The symmetry mentioned above will not hold if the beam is steered. When scanning is performed, the active aperture is both steered and translated along the total aperture of the transducer. With the relatively small apertures used for this transducer, the maximum amount of steering will be 5.4 mm from the center of the aperture or the width of six elements. However, this will only occur near the edges of the image. In the majority of the image, the maximum steering distance will be only 0.45 mm, or half an element width. Therefore, the PSFs should not drastically change when being electronically scanned as the 12 × 12 element aperture is sequentially stepped across the full aperture.
The simulation results and needle hydrophone measurements for Configurations 1-4 agreed well (see Figs. 8 and 9), which was a validation of the simulation model that was first presented by Urban et al [15] for VA imaging for linear arrays. This simulation platform for two-dimensional array structures provides the capability to test different subaperture designs for PSF evaluation, which would be much more efficient than testing different beamforming designs experimentally.
To judge the usefulness of this transducer we conducted two phantom imaging studies, in a synthetic breast phantom and ex vivo prostate tissue. Using a horizontal split configuration (Configuration 3) produced an image (Fig. 10(e)) of the breast phantom that had high contrast between the lesions and background and was devoid of “ghost” artifacts that were present in images made with Configurations 1 and 2. The CNR was highest for Configuration 3 in the smaller lesions that were examined, while the diamond shaped configuration (Configuration 2) provided the highest CNR for the larger middle lesion. The vertical split configuration (Configuration 4) provided low CNR values because only the edges were depicted well.
The images looked more similar to those formed using a confocal transducer [4, 5, 14] in past VA studies than those formed with a linear array transducer [15]. The calcifications are defined with sharper edges in images made with a confocal transducer compared to ones made with a linear array transducer. The images formed using the linear array transducer (Fig. 12(b)) could depict the calcifications in the tissue sample, but the detail was significantly improved using the 1.75D transducer used in this study (Figs. 12(c)-(f)). The diamond shaped aperture design (Configuration 2) produced the best image in the prostate sample (Fig. 12(d)), particularly in separating the different calcifications to depict them like the X-ray image. One reason for the sharper features in the images formed with the 1.75D transducer compared to the image obtained with the linear array transducer could be the ultrasound frequency difference: 3.6 MHz for the linear array and 5.0 MHz for the 1.75D transducer. The higher ultrasound frequency used by the 1.75D array provides better in-plane resolution, and therefore can differentiate some of the minute calcifications better than the linear array.
When examining the images formed in the breast phantom we observed some differences between the images formed by the horizontal and vertical split configurations (Configurations 3 and 4) even though the configurations are only dissimilar by a 90° rotation. For the image formed with Configuration 3, the vertical borders were brighter and wider because the PSF is wider in the azimuthal direction than in the elevation direction. For the image formed with Configuration 4, the horizontal borders are brighter and wider because the PSF is wider in the elevation direction compared to the azimuthal direction. Additionally, even though Configurations 3 and 4 have the same PSF with a 90° rotation, they produce different images because of the asymmetric in-plane resolution.
The time for VA scanning with an array transducer is directly proportional to the number of pixels in the images. The minimum time that can be used with the GE Vivid 7 system is 2 ms for each pixel location, so the minimum time for the breast phantom images (285 × 192 pixels) and prostate images (265 × 192 pixels) was 109.4 and 101.8 s, respectively.
In this study, all measurements and imaging was performed in a water tank. The gelatin that was used for embedding the prostate did not have any ultrasound absorption. Real tissues exhibit ultrasound attenuation and reduce the intensity levels used for the VA beams, which could reduce the signal-to-noise ratio of the resulting images. We measured the spatial peak pulse average intensities (Isppa) for Configurations 1-4 with a needle hydrophone and found that they ranged from 33-38 W/cm2 when focused at zf = 25 mm. When these values were derated by 0.3 dB/cm/MHz, as advised for acoustic output testing by the Food and Drug Administration [35], the range was reduced to values of 14-16 W/cm2.
The main advantage of implementing VA imaging using a 1.75D array transducer was the finer focusing capability in the elevation direction and the ability to make the PSF in the focal plane more symmetric as compared to that produced by a linear array transducer where the in-plane resolution was reported to be 0.57 × 1.44 mm [15], which is more asymmetric than reported for the configurations studied here. The in-plane resolution for the 1.75D compared well with that of the linear array, and has the advantage of being much more symmetric as the values in Table II indicate.
One of the disadvantages of this particular transducer is the large element dimensions, which give rise to grating lobes. We recognized from the outset of this study that using this transducer would produce grating lobes, but this transducer offered an acceptable compromise between aperture size and the number of channels that the GE Vivid 7 had available to test the feasibility of VA imaging with better elevation focusing using an array transducer. The grating lobe effects can be minimized for this transducer by using lower ultrasound frequencies as demonstrated by the simulation results in Fig. 3, but only to a limit because of the finite bandwidth of the transducer. For this reason, we used 5 MHz because the grating lobes were lower, and the power was high enough to make images with adequate signal. The grating lobes give rise to “ghost” images that are artifacts from imaging real objects. The “ghost” images were observed in imaging of the breast phantom, but were not clearly observed in the imaging results from the prostate gland. This point needs to be analyzed further, but the addition of ultrasound attenuation and scatterers in tissue may be one factor to consider. The breast phantom matrix has low ultrasound attenuation and no ultrasound scatterers. These “ghost” replicas could be eliminated by using a 1.75D or 2D transducer where the elements are small enough to avoid grating lobes.
We have recently reported a simulation study of VA beamforming using a 2D reconfigurable array with elements of size 0.2 × 0.2 mm [22]. This type of transducer had elements that were small enough to greatly minimize the effects of grating lobes and would be able to focus and steer beams both in the azimuthal and elevational directions. The 1.75D array transducer was studied to examine the potential benefits of having a two-dimensional aperture with elements that could be independently assigned different frequencies both from a numerical and experimental perspective. This was an intermediate step between the linear array transducers that are very common in clinical ultrasound and the more sophisticated 2D reconfigurable array transducers. We hope to experimentally test this type of reconfigurable array transducer for VA beamforming in future studies.
The imaging results in the ex vivo human prostate were meant for demonstrative purposes in order to show the levels of contrast and detail possible to distinguish calcifications and different areas of soft tissue. The VA images demonstrate that different tissue features can be identified, and that has been confirmed in other ex vivo and in vivo studies. In a recently reported study performed in human breast with a confocal transducer, sensitivity for the presence or absence of a lesion was 97% and specificity of malignant versus benign lesions was ≥ 94% for three reviewers [14]. VA is particularly useful for qualitative detection of lesions in contrast to quantitative characterization by methods such as shear wave elastography [36-38]. Future studies will be devoted to evaluating how a 1.75D array transducer might visualize lesions in human patients.
Additionally, one of the features of VA imaging that was not changed extensively in this study with the 1.75D array transducer was the value of Δf. Previous studies have shown that the contrast in the image can vary based on Δf due to variations in the mechanical response of the tissue [8, 39, 40]. Although the value of Δf can affect the image contrast, the dominant features in the images remain visible. The values for Δf used in this study were 51.5 and 54.3 kHz because the hydrophone that was used is most sensitive near 50 kHz. In future studies, we will also explore using multiple values of Δf to evaluate the effects on image contrast.
This transducer would not be suitable for in vivo VA imaging of the prostate gland unless this type of transducer could be packaged into a transrectal ultrasound transducer. Additionally, a smaller version of this transducer could be used for thyroid imaging. The current size of the probe in the azimuthal (x-direction) is prohibitory for scanning the thyroid with a motorized carriage due to space constraints. This transducer is suitable for in vivo contact scanning of the breast and will be used in future in vivo imaging studies of breast cancer patients to examine the detectability of benign and malignant lesions.
V. Conclusions
We presented results from a beamforming study for implementation of VA imaging using a 1.75D array transducer. This transducer offers the ability to focus the excitation field used for VA imaging in the elevation direction better than a 1D array transducer. We evaluated six configurations for beamforming both through numerical simulations and experimental evaluation. Based on these results we experimentally evaluated four of those configurations with ultrasound field measurements and phantom imaging studies. We observed different advantages and disadvantages associated with the different configurations related to grating lobes, resolution, and contrast in the images based on the simulation and experimental tests. The horizontal split configuration (Configuration 3) was found to provide low grating lobe levels and produce images with well-defined borders in the breast phantom. The diamond shaped configuration (Configuration 2) was able to depict the calcifications in the prostate with good fidelity and with no appreciable “ghost” artifacts. Implementation of VA on a 1.75D array transducer can produce images that have better focused fields than a 1D array transducer, and could be useful for in vivo imaging applications in the breast and thyroid.
Acknowledgments
The authors acknowledge the laboratory assistance of Randall R. Kinnick, computer support of Thomas M. Kinter, and administrative support of Jennifer L. Milliken. We also acknowledge the assistance of Douglas Wildes in designing and constructing the plastic probe housing. This work was supported in part by grants CA121579, CA127235, and CA091956 from the National Institutes of Health. The content is solely the responsibility of the authors and does not necessarily represent the official views of the National Cancer Institute or the National Institutes of Health. Mayo Clinic does not endorse the products mentioned in this article.
Footnotes
Disclosure of Conflict of Interest: Mayo Clinic and some of the authors have a potential financial interest related to the technology referenced in this paper.
References
- [1].Fatemi M, Greenleaf JF. Ultrasound-stimulated vibro-acoustic spectrography. Science. 1998 Apr 3;280:82–5. doi: 10.1126/science.280.5360.82. [DOI] [PubMed] [Google Scholar]
- [2].Fatemi M, Greenleaf JF. Vibro-acoustography: An imaging modality based on ultrasound-stimulated acoustic emission. Proc. Natl. Acad. Sci. U. S. A. 1999 Jun 8;96:6603–8. doi: 10.1073/pnas.96.12.6603. [DOI] [PMC free article] [PubMed] [Google Scholar]
- [3].Pislaru C, Kantor B, Kinnick RR, Anderson JL, Aubry MC, Urban MW, Fatemi M, Greenleaf JF. In vivo vibroacoustography of large peripheral arteries. Invest. Radiol. 2008 Apr;43:243–252. doi: 10.1097/RLI.0b013e31816085fc. [DOI] [PMC free article] [PubMed] [Google Scholar]
- [4].Alizad A, Fatemi M, Wold LE, Greenleaf JF. Performance of vibro-acoustography in detecting microcalcifications in excised human breast tissue: a study of 74 tissue samples. IEEE Trans. Med. Imaging. 2004 Mar;23:307–12. doi: 10.1109/TMI.2004.824241. [DOI] [PubMed] [Google Scholar]
- [5].Alizad A, Whaley DH, Greenleaf JF, Fatemi M. Critical issues in breast imaging by vibro-acoustography. Ultrasonics. 2006 Dec 22;44(Suppl 1):e217–20. doi: 10.1016/j.ultras.2006.06.021. [DOI] [PubMed] [Google Scholar]
- [6].Mitri FG, Davis BJ, Alizad A, Greenleaf JF, Wilson TM, Mynderse LA, Fatemi M. Prostate cryotherapy monitoring using vibroacoustography: preliminary results of an ex vivo study and technical feasibility. IEEE Trans. Biomed. Eng. 2008 Nov;55:2584–2592. doi: 10.1109/TBME.2008.2001284. [DOI] [PMC free article] [PubMed] [Google Scholar]
- [7].Mitri FG, Davis BJ, Urban MW, Alizad A, Greenleaf JF, Lischer GH, Wilson TM, Fatemi M. Vibro-acoustography imaging of permanent prostate brachytherapy seeds in an excised human prostate - Preliminary results and technical feasibility. Ultrasonics. 2009 Mar;49:389–394. doi: 10.1016/j.ultras.2008.10.011. [DOI] [PMC free article] [PubMed] [Google Scholar]
- [8].Alizad A, Wold LE, Greenleaf JF, Fatemi M. Imaging mass lesions by vibro-acoustography: modeling and experiments. IEEE Trans. Med. Imaging. 2004 Sep;23:1087–93. doi: 10.1109/TMI.2004.828674. [DOI] [PubMed] [Google Scholar]
- [9].Mitri FG, Fatemi M. Improved vibroacoustography imaging for nondestructive inspection of materials. J. Appl. Phys. 2005 Dec;98:114901. [Google Scholar]
- [10].Mitri FG, Eberlein U, Fatemi M. Surface roughness imaging using the acoustic emission induced by the dynamic radiation force of ultrasound. Appl. Phys. Lett. 2006 Jun;88:234105. [Google Scholar]
- [11].Urban MW, Alizad A, Aquino W, Greenleaf JF, Fatemi M. A review of vibro-acoustography and its applications in medicine. Curr. Med. Imaging Rev. 2011;7:350–359. doi: 10.2174/157340511798038648. [DOI] [PMC free article] [PubMed] [Google Scholar]
- [12].Alizad A, Fatemi M, Whaley DH, Greenleaf JF. Application of vibro-acoustography for detection of calcified arteries in breast tissue. J. Ultrasound Med. 2004 Feb;23:267–73. doi: 10.7863/jum.2004.23.2.267. [DOI] [PubMed] [Google Scholar]
- [13].Alizad A, Mitri FG, Kinnick RR, Greenleaf JF, Fatemi M. Vibro-acoustography of thyroid. Journal of the Acoustical Society of America. 2007:3026. [Google Scholar]
- [14].Alizad A, Whaley DH, Urban MW, Carter RE, Kinnick RR, Greenleaf JF, Fatemi M. Breast vibro-acoustography: initial results show promise. Breast Cancer Res. 2012;14:R128. doi: 10.1186/bcr3323. [DOI] [PMC free article] [PubMed] [Google Scholar]
- [15].Urban MW, Chalek C, Kinnick RR, Kinter TM, Haider B, Greenleaf JF, Thomenius K, Fatemi M. Implementation of vibro-acoustography on a clinical ultrasound system. IEEE Trans. Ultrason. Ferrorelect. Freq. Control. 2011;58:1169–1181. doi: 10.1109/TUFFC.2011.1927. [DOI] [PMC free article] [PubMed] [Google Scholar]
- [16].Alizad A, Fatemi M. Breast vibro-acoustography. In: Hirsekon AW, editor. Emerging Technologies in Breast Imaging and Mammography. American Scientific Publishers; Stevenson Ranch, CA: 2005. pp. 197–205. [Google Scholar]
- [17].Chen S, Fatemi M, Kinnick R, Greenleaf JF. Comparison of stress field forming methods for vibro-acoustography. IEEE Trans. Ultrason. Ferroelectr. Freq. Control. 2004 Mar;51:313–21. [PubMed] [Google Scholar]
- [18].Silva GT, Greenleaf JF, Fatemi M. Linear arrays for vibro-acoustography: a numerical simulation study. Ultrason. Imaging. 2004 Jan;26:1–17. doi: 10.1177/016173460402600101. [DOI] [PubMed] [Google Scholar]
- [19].Heikkila J, Hynynen K. Investigation of optimal method for inducing harmonic motion in tissue using a linear ultrasound phased array--a simulation study. Ultrason Imaging. 2006 Apr;28:97–113. doi: 10.1177/016173460602800203. [DOI] [PubMed] [Google Scholar]
- [20].Silva GT, Chen S, Frery AC, Greenleaf JF, Fatemi M. Stress field forming of sector array transducers for vibro-acoustography. IEEE Trans. Ultrason. Ferroelectr. Freq. Control. 2005 Nov;52:1943–51. doi: 10.1109/tuffc.2005.1561663. [DOI] [PubMed] [Google Scholar]
- [21].Wildes DG, Chiao RY, Daft CMW, Rigby KW, Smith LS, Thomenius KE. Elevation performance of 1.25D and 1.5D transducer arrays. IEEE Trans. Ultrason. Ferroelectr. Freq. Control. 1997;44:1027–1037. [Google Scholar]
- [22].Kamimura HAS, Urban MW, Carneiro AAO, Fatemi M, Alizad A. Vibro-acoustography beam formation with reconfigurable arrays. IEEE Trans. Ultrason. Ferroelectr. Freq. Control. 2012;59:1421–1431. doi: 10.1109/TUFFC.2012.2343. [DOI] [PMC free article] [PubMed] [Google Scholar]
- [23].Thuras AL, Jenkins RT, O’Neil HT. Extraneous frequencies generated in air carrying intense sound waves. J. Acoust. Soc. Am. 1935;6:173–180. [Google Scholar]
- [24].Westervelt PJ. Scattering of sound by sound. J. Acoust. Soc. Am. 1957;29:199–203. [Google Scholar]
- [25].Westervelt PJ. Parametric acoustic array. J. Acoust. Soc. Am. 1963;35:535–537. [Google Scholar]
- [26].Dean LW., III Interactions between sound waves. J. Acoust. Soc. Am. 1962;34:1039–1044. [Google Scholar]
- [27].Silva GT, Chen S, Viana LP. Parametric amplification of the dynamic radiation force of acoustic waves in fluids. Phys. Rev. Letters. 2006 Jun 16;96 doi: 10.1103/PhysRevLett.96.234301. [DOI] [PubMed] [Google Scholar]
- [28].Hamilton MF, Blackstock DT. Nonlinear Acoustics. Academic Press; San Diego: 1998. [Google Scholar]
- [29].Cobbold RSC. Foundations of Biomedical Ultrasound. Oxford University Press; New York, NY: 2007. [Google Scholar]
- [30].Fatemi M, Greenleaf JF. Probing the dynamics of tissue at low frequencies with the radiation force of ultrasound. Phys. Med. Biol. 2000 Jun;45:1449–64. doi: 10.1088/0031-9155/45/6/304. [DOI] [PubMed] [Google Scholar]
- [31].Jensen JA, Svendsen NB. Calculation of pressure fields from arbitrarily shaped, apodized, and excited ultrasound transducers. IEEE Trans. Ultrason. Ferroelectr. Freq. Control. 1992;39:262–267. doi: 10.1109/58.139123. [DOI] [PubMed] [Google Scholar]
- [32].Jensen JA. Field: A program for simulating ultrasound systems. 10th Nordic-Baltic Conference on Biomedical Imaging. 1996:351–353. [Google Scholar]
- [33].Silva GT, Frery AC, Fatemi M. Image formation in vibro-acoustography with depth-of-field effects. Comput. Med. Imaging Graph. 2006 Jul;30:321–7. doi: 10.1016/j.compmedimag.2006.08.001. [DOI] [PubMed] [Google Scholar]
- [34].Urban MW, Fatemi M. Complex background subtraction for vibro-acoustography images. 2012. In review. [DOI] [PMC free article] [PubMed] [Google Scholar]
- [35].Herman BA, Harris GR. Models and regulatory considerations for transient temperature rise during diagnostic ultrasound pulses. Ultrasound Med. Biol. 2002;28:1217–24. doi: 10.1016/s0301-5629(02)00558-6. [DOI] [PubMed] [Google Scholar]
- [36].Sarvazyan AP, Rudenko OV, Swanson SD, Fowlkes JB, Emelianov SY. Shear wave elasticity imaging: a new ultrasonic technology of medical diagnostics. Ultrasound Med. Biol. 1998 Nov;24:1419–35. doi: 10.1016/s0301-5629(98)00110-0. [DOI] [PubMed] [Google Scholar]
- [37].Bercoff J, Tanter M, Fink M. Supersonic shear imaging: a new technique for soft tissue elasticity mapping. IEEE Trans. Ultrason. Ferroelectr. Freq. Control. 2004 Apr;51:396–409. doi: 10.1109/tuffc.2004.1295425. [DOI] [PubMed] [Google Scholar]
- [38].Chen S, Urban MW, Pislaru C, Kinnick R, Zheng Y, Yao A, Greenleaf JF. Shearwave dispersion ultrasound vibrometry (SDUV) for measuring tissue elasticity and viscosity. IEEE Trans. Ultrason. Ferroelectr. Freq. Control. 2009 Jan;56:55–62. doi: 10.1109/TUFFC.2009.1005. [DOI] [PMC free article] [PubMed] [Google Scholar]
- [39].Urban MW, Silva GT, Fatemi M, Greenleaf JF. Multifrequency vibro-acoustography. IEEE Trans. Med. Imaging. 2006 Oct;25:1284–95. doi: 10.1109/tmi.2006.882142. [DOI] [PubMed] [Google Scholar]
- [40].Urban MW, Alizad A, Fatemi M. Vibro-acoustography and multifrequency image compounding. Ultrasonics. 2011;51:689–696. doi: 10.1016/j.ultras.2011.02.001. [DOI] [PMC free article] [PubMed] [Google Scholar]


