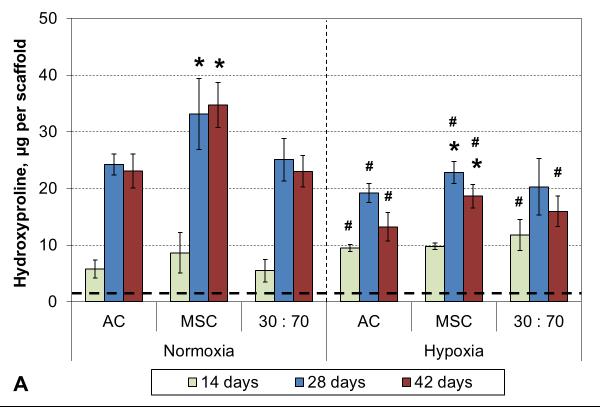
Figure 3.
HYP content (A) and synthetic activity (B) with various cell types and oxygen tensions. Results are presented as mean ± SD with n = 4. The dashed line represents the cell stocks used to seed the scaffolds. # and * denote statistically significant difference to the corresponding normoxic culture condition (same cell type) and AC group (same oxygen tension), respectively (p < 0.05).


