

Abstract
Background
Alcohol and nicotine co-dependence can be considered as a more severe subtype of alcohol dependence. A portion of its risk may be attributable to genetic factors.
Methods
We searched for significant risk genomic regions specific for this disorder using a genome-wide association study (GWAS). A total of 8,847 subjects underwent gene-disease association analysis, including (i) a discovery cohort of 818 European-American cases with alcohol and nicotine co-dependence and 1,396 European-American controls, (ii) a replication cohort of 5,704 Australian family subjects with 907 affected offspring, and (iii) a replication cohort of 449 African-American cases and 480 African-American controls. Additionally, a total of 38,714 subjects of European or African descent in 18 independent cohorts with 10 other non-alcoholism neuropsychiatric disorders were analyzed as contrast. Furthermore, 90 unrelated HapMap CEU individuals, 93 European brain tissue samples and 80 European peripheral blood mononuclear cell (PBMC) samples underwent cis-acting expression quantitative locus (cis-eQTL) analysis.
Results
We identified a significant risk region for alcohol and nicotine co-dependence between IPO11 and HTR1A on chromosome 5q that was reported to be suggestively associated with alcohol dependence previously. In the European-American discovery cohort, 381 SNPs in this region were nominally associated with alcohol and nicotine co-dependence (p<0.05); 57 associations of them survived region- and cohort-wide correction (α=3.6×10⁻⁶); and the top SNP (rs7445832) was significantly associated with alcohol and nicotine co-dependence at the genome-wide significance level (p=6.2×10⁻⁹). Furthermore, associations for 34 and 11 SNPs were replicated in the Australian and African-American replication cohorts, respectively. Among these replicable associations, 4 reached genome-wide significance level in the meta-analysis of European-Americans and European-Australians: rs7445832 (p=9.6×10⁻¹⁰), rs13361996 (p=8.2×10⁻⁹), rs62380518 (p=2.3×10⁻⁸) and rs7714850 (p=3.4×10⁻⁸). Cis-eQTL analysis showed that many risk SNPs in this region had nominally significant cis-acting regulatory effects on HTR1A or IPO11 mRNA expression. Finally, no markers were significantly associated with any other neuropsychiatric disorder examined.
Conclusions
We speculate that this IPO11-HTR1A region might harbor a causal variant for alcohol and nicotine co-dependence.
Keywords: GWAS, alcohol and nicotine co-dependence, cis-eQTL, IPO11, HTR1A
Introduction
Alcohol and nicotine are the most commonly misused substances in the United States. Nearly 20 million Americans are alcohol abusing or dependent, and almost 50 million Americans smoke cigarettes (Substance Abuse and Mental Health Services Administration (SAMHSA), 2010). Alcohol dependence and nicotine dependence frequently co-occur in the same individuals. Furthermore, nicotine dependent individuals are four times more likely than the general population to be alcohol dependent, and people who drink are three times more likely than the general population to smoke (Grant et al., 2004). Identical twins are twice as likely as fraternal twins to become alcohol and nicotine dependent if the other twin is dependent (Carmelli et al., 1993; Swan et al., 1997). Alcohol and nicotine may enhance motivation to use either drug by activating common brain targets that are responsible for their reinforcing effects. They may also exert synergistic effects on behaviors which may contribute to their concurrent use.
Alcohol and nicotine co-dependence may represent a more severe subtype of alcohol dependence. A large number of risk loci have been associated with both alcohol dependence and nicotine dependence by candidate gene approach, including many genes that are involved in the dopaminergic, serotoninergic, GABAergic, glutamatergic, cholinergic, opioid and endocannabinoid systems. However, none of these genes have been confirmed by recent genome-wide association studies (GWASs) of alcohol dependence (Treutlein et al., 2009; Bierut et al., 2010; Edenberg et al., 2010; Heath et al., 2011; Johnson et al., 2011). Only two of them (CHRNA6-CHRNB3 (Thorgeirsson et al., 2010) and CHRNA5-CHRNA3-CHRNB4 (Liu et al., 2010)) were confirmed by meta-analysis GWASs of nicotine dependence. GWASs of alcohol dependence or alcohol consumption reported multiple other potential risk loci (Treutlein et al., 2009; Bierut et al., 2010; Edenberg et al., 2010; Heath et al., 2011; Schumann et al., 2011), so did most GWASs of nicotine dependence. To date, there has been only one GWAS (Lind et al., 2010) directly studying the phenotype of alcohol and nicotine co-dependence. That study identified three risk genes including ARHGAP10, MARK1 and DDX6. However, those findings have not been replicated independently yet.
In the present study, we searched for significant risk genomic regions for alcohol and nicotine co-dependence using a GWAS. A European-American cohort was used as the discovery one, and a European-Australian cohort and an African-American cohort were used as the replication ones. Additionally, we used three independent samples of European descent to detect expression quantitative trait locus (eQTL) signals in this risk genomic region, to see if the risk variants were functional. Finally, as contrast, we tested gene-disease associations in 18 additional independent cohorts with 10 other non-alcoholism neuropsychiatric disorders, to see whether the risk regions were specific for alcohol and nicotine co-dependence or not.
Materials and Methods
Subjects
A total of 8,847 subjects underwent gene-disease association analysis, including (i) a discovery cohort of 818 European-American cases with alcohol and nicotine co-dependence (476 males and 342 females; 38.3±10.2 years) and 1,396 European-American controls (422 males and 974 females; 39.4±10.4 years), (ii) a replication cohort of 5,704 European-Australian family subjects (1,856 families; 2,620 males and 3,084 females; 46.0±10.0 years; 907 affected offspring with alcohol and nicotine co-dependence including 366 females), and (iii) a replication cohort of 449 African-American cases (260 males and 189 females; 40.3±7.8 years) with alcohol and nicotine co-dependence and 480 African-American controls (170 males and 310 females; 39.6±8.6 years). Additionally, a total of 38,714 subjects of European or African descent in 18 independent case-control or family-based cohorts with 10 other neuropsychiatric disorders were analyzed. These neuropsychiatric disorders included schizophrenia, autism, attention deficit hyperactivity disorder (ADHD), major depression, bipolar disorder, Alzheimer’s disease, amyotrophic lateral sclerosis (ALS), early onset stroke, ischemic stroke, and Parkinson’s disease (Supplemental Tables S1a and S1b).
The European-American discovery cohort and the African-American replication cohort came from the dataset of the Study of Addiction - Genetics and Environment (SAGE) (dbGaP study accession phs000092.v1.p1) (Bierut et al., 2010), and the Australian replication cohort came from the dataset of the Australian twin-family study of alcohol use disorder (OZ-ALC) (dbGaP study accession phs000181.v1.p1) (Lind et al., 2010; Heath et al., 2011). (All subjects with alcohol and nicotine co-dependence in another dataset of the Collaborative Study on the Genetics of Alcoholism (COGA) (dbGaP: phs000125.v1.p1) (Edenberg et al., 2010) have been included in this SAGE dataset). These datasets were originally collected to study alcohol dependence alone. SAGE subjects were recruited from 8 different study sites in 7 states and the District of Columbia; the majority of subjects were recruited in Missouri (Bierut et al., 2010). All subjects were interviewed using the Semi-Structured Assessment for the Genetics of Alcoholism (SSAGA) (Bucholz et al., 1994). Affected subjects met lifetime DSM-IV criteria for both alcohol and nicotine dependence (American Psychiatric Association, 1994). Affected subjects were excluded if they had schizophrenia or other psychotic illnesses. Controls were defined as individuals who had been exposed to alcohol and nicotine (and possibly to other drugs), but had never become dependent on these substances. Additionally, controls were also screened to exclude individuals with major axis I disorders, including schizophrenia, mood disorders, and anxiety disorders. The Australian subjects included twins and their parents, siblings, spouses, children and other family members. The index cases reported a history of alcohol dependence and nicotine dependence (DSM-IV). More detailed demographic information is available elsewhere (Edenberg et al., 2005; Bierut et al., 2010; Edenberg et al., 2010; Heath et al., 2011). The European-American discovery cohort and the African-American replication cohort were genotyped on the Illumina Human 1M beadchip and the Australian cohort was genotyped on the Illumina CNV370v1 beadchip.
Detailed demographic information, including sample sizes, ethnicity and diagnosis of the 18 cohorts with other neuropsychiatric disorders, is shown in Supplemental Table S1 or is available in dbGaP database (http://www.ncbi.nlm.nih.gov/gap). These subjects were genotyped on different Illumina or Affymetric microarray beadchip platforms. All subjects gave written informed consent to participating in protocols approved by the relevant institutional review boards (IRBs). All subjects were de-identified in this study that was approved by Yale IRB.
Imputation
After we identified a significant risk genomic region in the European-American discovery cohort, we imputed that entire region (1.5 Mb at Chr5: 61,708,573-63,257,546 from the transcript start site (TSS) of IPO11 to the TSS of HTR1A) in all samples of 21 cohorts using the same strategy as previously (Zuo et al., 2012). Rare variants with minor allele frequencies (MAF) < 0.05 were excluded.
Data analysis
Before the association analysis, we strictly cleaned the phenotype and genotype data of all datasets (see the Supplemental Materials and Methods). We tested gene-disease associations in the European-American discovery cohort first, to identify the significant risk genomic regions at genome-wide significance level, and then we imputed and carefully examined this region across 21 cohorts.
Genome-wide association tests in the European-American discovery cohort: The allele frequencies of all cleaned markers across the genome were compared between cases and controls using genome-wide logistic regression analysis implemented in the program PLINK (Purcell et al., 2007). Diagnosis served as the dependent variable, alleles served as the independent variables, and sex, age, the first 10 principal components and the most significant marker (i.e., rs7445832) served as the covariates. The principal component scores of our samples were derived from all autosomal SNPs across the genome using principal component analysis (PCA) implemented in the software package EIGENSTRAT (Price et al., 2006). Each individual received scores on each principal component. These principal components reflected the population structure of our samples. The first principal component (PC1) separated the self-identified European-American and African-American subjects very well, which was highly consistent with a previous report (Bierut et al., 2010). The second principal component (PC2) separated the self-identified Hispanic subjects from the non-Hispanic subjects. Other principal components also accounted for very small fractions of the total variance. The first 10 principal component scores accounted for >95% of variance. These PCs serving as covariates in the regression model can control for the population stratification and admixture effects on association analysis. The p-values derived from these association analyses are illustrated in Figure 1. Furthermore, similar association analysis was performed on the imputed data (see below). The top-ranked (p<10−5) risk markers are listed in Table 1. To mitigate false positive rates, genome-wide associations in the discovery cohort were corrected for multiple testing by Bonferroni correction (α=5×10⁻⁸).
Association tests for the imputed genotype data in all samples in 21 cohorts: To analyze the associations between neuropsychiatric diseases and all imputed markers in the case-control samples, we used the logistic regression analysis described above. For the family samples, we tested associations using the program FBAT (Horvath et al., 2001). Association results were corrected for multiple comparisons by the effective number of SNPs within the IPO11-HTR1A region and the number of cohorts examined (i.e., n=21). The effective marker numbers were calculated using the program SNPSpD (Li and Ji, 2005). In the present study, the effective genetic marker number was 669 in the IPO11-HTR1A region; thus, the region- and cohort-widely corrected α was set at 3.6×10⁻⁶. The associations that were replicable between the discovery and replication cohorts are shown in Tables 2 and 3. Meta-analysis was performed on these replicable associations, to derive the combined p values using the program METAL.
Cis-acting genetic regulation of expression analysis in the lymphoblastoid cell lines: To examine relationships between all available SNPs in the IPO11-HTR1A region and mRNA expression levels of local genes (i.e., HTR1A and IPO11) in the lymphoblastoid cell lines, we performed cis-acting expression quantitative locus (cis-eQTL) analysis. Expression array data of 14,925 transcripts (14,072 genes) in 90 unrelated HapMap CEU individuals were assessed (Stranger et al., 2005). Differences in the distribution of mRNA expression levels between SNP genotypes were compared using a Wilcoxon-type trend test. The risk SNPs that were associated with disease in the discovery cohort and had p < 0.05 in this cis-eQTL analysis are shown in the Supplemental Table S2.
Cis-eQTL analysis on all available SNPs in the IPO11-HTR1A region in the brain tissue samples and the peripheral blood mononuclear cell (PBMC) samples: To examine whether the SNPs in the risk region influence the local gene expression changes, we also tested the associations between the genotypes and the expression levels of exons and transcripts of local genes (i.e., HTR1A and IPO11) in two additional European samples (Table S2). Expression array data in 93 autopsy-collected frontal cortical brain tissue samples with no defined neuropsychiatric condition and 80 PBMC samples collected from living healthy donors obtained from a study (Heinzen et al., 2008) at Duke University were evaluated. Each of these associations was analyzed using a linear regression model by correcting for age, sex, source of tissues, and principle component scores of ancestry. The expression array data have been confirmed by quantitative RT-PCR previously (Heinzen et al., 2008).
Figure 1. Manhattan plot for the p-values in European-American discovery cohort.
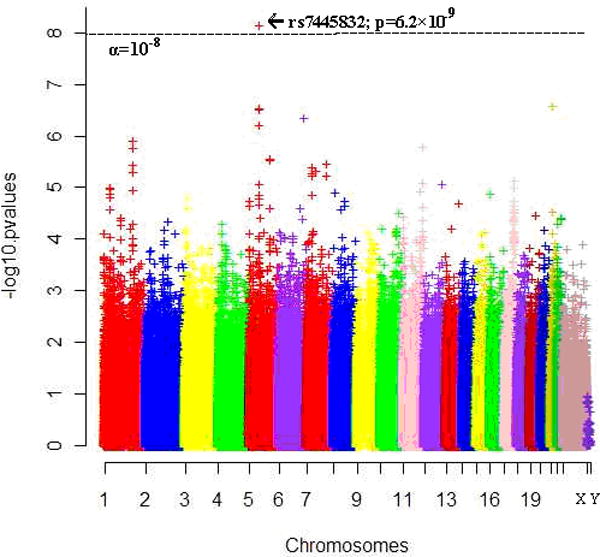
[Y-axis: −log0.05=1.3; −log10−5=5; −log(5×10⁻⁸)=7.3. X-axis: Chr1-22=Autosomes; X=ChrX; Y=ChrY; SNPs were ordered by physical distance within each chromosome/region]
Table 1.
P-values for top-ranked (p<10−5) risk SNPs in IPO11-HTR1A region in the discovery cohort
| SNP | Position | risk allele | OR | p-values | SNP | Position | risk allele | OR | p-values |
|---|---|---|---|---|---|---|---|---|---|
| rs7445832 | 62622057 | A | 1.53 | 6.2×10⁻⁹ | rs6873148 | 62695568 | A | 1.52 | 1.0×10⁻⁶ |
| rs1494578 | 62622185 | G | 1.47 | 4.7×10⁻⁷ | rs6873152 | 62695579 | A | 1.52 | 1.0×10⁻⁶ |
| rs10471577 | 62623023 | C | 1.47 | 4.7×10⁻⁷ | rs10939966 | 62696069 | C | 1.37 | 6.8×10⁻⁶ |
| rs7702856 | 62630122 | G | 1.47 | 4.3×10⁻⁷ | rs10805382 | 62696495 | C | 1.38 | 5.1×10⁻⁶ |
| rs4700575 | 62631732 | G | 1.48 | 2.8×10⁻⁷ | rs10939967 | 62696691 | C | 1.52 | 1.0×10⁻⁶ |
| rs346425 | 62632000 | T | 1.36 | 3.2×10⁻⁶ | rs73119677 | 62698022 | G | 1.53 | 9.0×10⁻⁷ |
| rs73761305 | 62632087 | T | 1.43 | 4.1×10⁻⁶ | rs4590141 | 62698797 | C | 1.37 | 7.0×10⁻⁶ |
| rs1319474 | 62634947 | G | 1.46 | 7.4×10⁻⁷ | rs55701004 | 62699567 | C | 1.37 | 7.0×10⁻⁶ |
| rs1017776 | 62635216 | G | 1.47 | 6.7×10⁻⁷ | rs6860119 | 62700122 | T | 1.53 | 7.9×10⁻⁷ |
| rs1462460 | 62649397 | T | 1.53 | 8.3×10⁻⁶ | rs6860278 | 62700179 | T | 1.53 | 7.9×10⁻⁷ |
| rs7444332 | 62680629 | C | 1.47 | 5.9×10⁻⁷ | rs6860501 | 62700377 | T | 1.53 | 7.9×10⁻⁷ |
| rs4403132 | 62681092 | T | 1.39 | 4.8×10⁻⁶ | rs73119687 | 62701503 | T | 1.53 | 7.9×10⁻⁷ |
| rs7718679 | 62687582 | C | 1.54 | 6.7×10⁻⁷ | rs6893950 | 62704479 | T | 1.51 | 4.2×10⁻⁶ |
| rs73119652 | 62688162 | T | 1.54 | 5.1×10⁻⁷ | rs62380518 | 63020823 | A | 1.68 | 1.5×10⁻⁷ |
| rs57363006 | 62689707 | G | 1.50 | 2.8×10⁻⁶ | rs74829400 | 63027037 | T | 1.64 | 1.2×10⁻⁷ |
| rs57361220 | 62689740 | T | 1.50 | 2.8×10⁻⁶ | rs62380521 | 63028029 | C | 1.41 | 8.1×10⁻⁶ |
| rs59544801 | 62689880 | T | 1.52 | 1.1×10⁻⁶ | rs6887027 | 63046909 | C | 1.38 | 9.9×10⁻⁶ |
| rs7714594 | 62690438 | A | 1.53 | 6.1×10⁻⁷ | rs62380555 | 63070602 | C | 1.47 | 1.5×10⁻⁶ |
| rs7735086 | 62692417 | A | 1.52 | 1.0×10⁻⁶ | rs7714850 | 63072093 | C | 1.43 | 2.7×10⁻⁷ |
| rs7735004 | 62692558 | G | 1.38 | 6.2×10⁻⁶ | rs10042862 | 63072461 | G | 1.47 | 1.5×10⁻⁶ |
| rs7735451 | 62692702 | A | 1.52 | 1.0×10⁻⁶ | rs13354185 | 63073747 | A | 1.48 | 1.1×10⁻⁶ |
| rs4302532 | 62694427 | C | 1.55 | 4.4×10⁻⁷ | rs72766222 | 63074411 | A | 1.46 | 7.3×10⁻⁶ |
| rs4455508 | 62694538 | A | 1.54 | 5.7×10⁻⁷ | rs13361996 | 63075996 | A | 1.65 | 6.9×10⁻⁸ |
All markers are in Hardy-Weinberg Equilibrium (HWE), common variants and ordered by chromosome position; all risk alleles are minor alleles. The markers underlined are non-imputed markers. The bold are the genome-wide significant markers with p < 5×10⁻⁸ in meta-analysis (see Table 2).
Table 2.
P-values for replicable risk SNPs between European-American discovery and Australian replication cohorts
| SNP | Position | Risk Allele | European-Americans | Australians | Meta-analysis | |||
|---|---|---|---|---|---|---|---|---|
| OR | p | OR | p | z | p | |||
| rs6861297 | 62212972 | T | 1.62 | 0.024 | 2.67 | 0.008 | 2.57 | 0.010 |
| rs6884324 | 62213017 | C | 1.60 | 0.026 | 2.67 | 0.008 | 2.54 | 0.011 |
| rs350306 | 62469018 | T | 1.38 | 0.012 | 1.56 | 0.005 | 3.18 | 0.001 |
| rs1494622 | 62491395 | T | 1.27 | 0.021 | 1.17 | 0.009 | 2.92 | 0.004 |
| rs1494623 | 62493473 | C | 1.20 | 0.037 | 1.18 | 0.004 | 2.82 | 0.005 |
| rs691234 | 62496771 | C | 1.37 | 0.003 | 1.23 | 0.013 | 3.48 | 0.001 |
| rs690957 | 62502634 | C | 1.38 | 0.008 | 1.67 | 0.001 | 3.20 | 0.001 |
| rs681342 | 62507733 | T | 1.28 | 0.012 | 1.18 | 0.015 | 3.04 | 0.002 |
| rs181156 | 62509099 | A | 1.39 | 0.002 | 1.23 | 0.007 | 3.66 | 2.6×10⁻⁴ |
| rs350309 | 62509354 | T | 1.38 | 0.002 | 1.23 | 0.007 | 3.66 | 2.6×10⁻⁴ |
| rs350311 | 62510417 | C | 1.39 | 0.003 | 1.17 | 0.019 | 3.43 | 0.001 |
| rs350312 | 62511201 | A | 1.37 | 0.004 | 1.17 | 0.019 | 3.34 | 0.001 |
| rs690816 | 62514088 | G | 1.38 | 0.003 | 1.17 | 0.020 | 3.43 | 0.001 |
| rs114705639 | 62536627 | A | 1.35 | 0.022 | 1.46 | 0.019 | 2.71 | 0.007 |
| rs17481124 | 62574713 | G | 1.23 | 0.048 | 1.21 | 0.048 | 2.30 | 0.021 |
| rs72758793 | 62588647 | A | 1.37 | 0.018 | 1.80 | 0.046 | 2.62 | 0.009 |
| rs55860379 | 62593868 | A | 1.36 | 0.010 | 1.78 | 0.034 | 2.85 | 0.004 |
| rs72760718 | 62615268 | G | 1.35 | 0.016 | 1.80 | 0.027 | 2.67 | 0.008 |
| rs7445832 | 62622057 | A | 1.53 | 6.2×10⁻⁹ | 1.15 | 0.049 | 6.12 | 9.6×10⁻¹⁰ |
| rs9291778 | 62622713 | A | 1.51 | 4.0×10⁻⁵ | 2.08 | 0.012 | 4.50 | 6.7×10⁻⁶ |
| rs56051136 | 62630434 | A | 1.41 | 0.003 | 3.33 | 0.001 | 3.51 | 4.6×10⁻⁴ |
| rs60685959 | 62630435 | C | 1.41 | 0.003 | 3.33 | 0.001 | 3.51 | 4.6×10⁻⁴ |
| rs73761304 | 62632086 | T | 1.37 | 4.7×10⁻⁴ | 2.37 | 0.001 | 4.14 | 3.4×10⁻⁵ |
| rs6882265 | 62702209 | T | 1.28 | 0.001 | 1.58 | 0.026 | 3.82 | 1.3×10⁻⁴ |
| rs62380518 | 63020823 | A | 1.68 | 1.5×10⁻⁷ | 1.33 | 0.028 | 5.59 | 2.3×10⁻⁸ |
| rs7714850 | 63072093 | C | 1.43 | 2.7×10⁻⁷ | 1.27 | 0.042 | 5.52 | 3.4×10⁻⁸ |
| rs10042862 | 63072461 | G | 1.47 | 1.5×10⁻⁶ | 1.24 | 0.039 | 5.18 | 2.2×10⁻⁷ |
| rs13354185 | 63073747 | A | 1.48 | 1.1×10⁻⁶ | 1.33 | 0.034 | 5.21 | 1.9×10⁻⁷ |
| rs13361996 | 63075996 | A | 1.65 | 6.9×10⁻⁸ | 1.78 | 0.002 | 5.76 | 8.2×10⁻⁹ |
| rs17180095 | 63104352 | C | 1.52 | 0.001 | 1.64 | 0.033 | 3.69 | 2.2×10⁻⁴ |
| rs10061598 | 63113748 | T | 1.14 | 0.048 | 1.59 | 0.033 | 2.51 | 0.012 |
| rs989049 | 63114801 | C | 1.19 | 0.012 | 1.73 | 0.039 | 2.94 | 0.003 |
| rs2202266 | 63117281 | G | 1.14 | 0.049 | 1.79 | 0.039 | 2.44 | 0.015 |
| rs1478493 | 63119942 | G | 1.26 | 0.008 | 1.53 | 0.011 | 3.60 | 3.2×10⁻⁴ |
The bold are the genome-wide significant markers with p < 5×10⁻⁸ in meta-analysis.
Table 3.
P-values for replicable risk SNPs between European-American discovery and African-American replication cohorts
| SNP | Position | Risk Allele | European-American | African-American | Meta-analysis | |||
|---|---|---|---|---|---|---|---|---|
| OR | P | OR | P | OR | P | |||
| rs10514949 | 62068672 | C | 1.15 | 0.042 | 0.78 | 0.049 | 1.05 | 0.376 |
| rs58617906 | 62332704 | A | 1.24 | 0.020 | 0.61 | 0.032 | 1.12 | 0.185 |
| rs690957 | 62502634 | C | 1.38 | 0.008 | 0.64 | 0.047 | 1.16 | 0.177 |
| rs10042968 | 63069474 | G | 1.41 | 8.1×10⁻⁶ | 1.54 | 0.041 | 1.42 | 8.0×10⁻⁷ |
| rs7700448 | 63124338 | A | 1.17 | 0.025 | 0.81 | 0.048 | 1.05 | 0.407 |
| rs17795292 | 63125355 | G | 1.17 | 0.018 | 0.81 | 0.036 | 1.04 | 0.424 |
| rs35393059 | 63125728 | C | 1.17 | 0.020 | 0.81 | 0.044 | 1.05 | 0.369 |
| rs13159097 | 63125873 | A | 1.17 | 0.022 | 0.81 | 0.044 | 1.05 | 0.381 |
| rs6876878 | 63127666 | A | 1.17 | 0.016 | 0.81 | 0.045 | 1.06 | 0.333 |
| rs2365875 | 63128094 | G | 1.17 | 0.019 | 0.80 | 0.040 | 1.05 | 0.363 |
| rs10939982 | 63128760 | G | 1.17 | 0.018 | 0.82 | 0.048 | 1.05 | 0.378 |
Results
We scanned the genome in the European-American discovery cohort and identified a significant risk region between HTR1A and IPO11 on chromosome 5q at genome-wide significance level (Figures 1, 2 and 3), with the most significant SNP rs7445832 (p=6.2×10⁻⁹). We examined the 10Mb range surrounding this SNP, which covered the entire IPO11-HTR1A region (1.5Mb), in the discovery cohort, and found a total of 13 SNPs that had association signals for alcohol and nicotine co-dependence with p<10−4 (i.e., 6.2×10⁻⁹ ≤ p ≤ 9.1×10⁻⁵). These SNPs were concentrated within a narrow region (0.5Mb) surrounding the most significant SNP between IPO11 and HTR1A (Figure 2A).
Figure 2. Regional association plots.
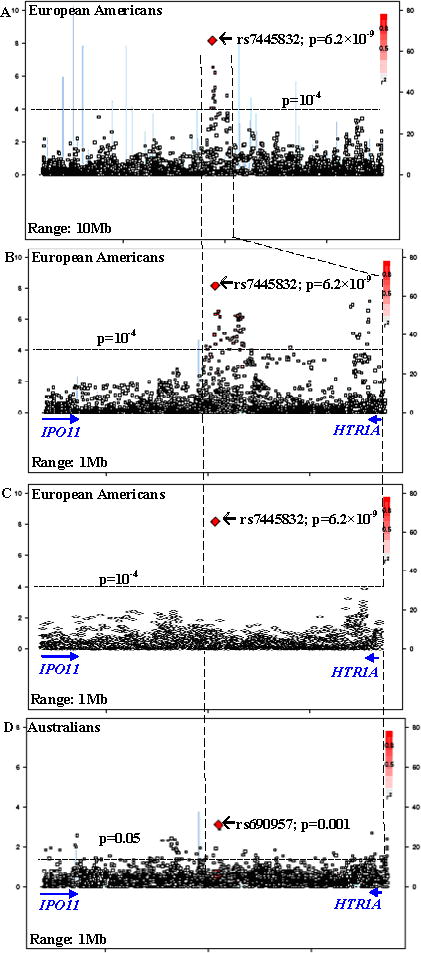
[Left Y-axis corresponds to −log(p) value; right Y-axis corresponds to recombination rates; quantitative color gradient corresponds to r2; red squares represent peak SNPs. (A) regional association plot in European-American discovery cohort for a 10Mb region around the peak association SNP (rs7445832); (B) regional association plot in European-American discovery cohort for a 1Mb region around the peak association SNP (rs7445832) [without conditioning on rs7445832]; (C) regional association plot in European-American discovery cohort for a 1Mb region around the peak association SNP (rs7445832) [conditional on rs7445832]; (D) regional association plot in Australian replication cohort for a 1Mb region around the peak association SNP (rs7445832)]
Figure 3. QQ-plot for the p-values in European-American discovery cohort.

[X-axis: expected −log(P) values; Y-axis: observed −log(P) values; P-values correspond to associations between SNPs and alcohol and nicotine co-dependence; λ=1.03]
We further examined the entire IPO11-HTR1A region (1.5Mb) in multiple populations, and detected many association and functional signals (Tables 1, 2, 3 and S2). In the European-American discovery cohort, among 2,726 SNPs including 261 originally-genotyped SNPs and 2,465 imputed SNPs, 381 SNPs were nominally associated with alcohol and nicotine co-dependence (p<0.05) (Table 4); 57 SNPs were significantly associated with alcohol and nicotine co-dependence after region- and cohort-wide correction (α=3.6×10⁻⁶). As mentioned, one of the SNP showed evidence for genome-wide significance (rs7445832; p=6.2×10⁻⁹). All risk alleles of these markers were minor alleles (f<0.5). If conditional on the most significant SNP (i.e., rs7445832), all of the associations with other SNPs became less significant (all p>10−4; Figure 2C). In the Australian replication cohort, 100 SNPs were nominally associated with alcohol and nicotine co-dependence (0.001 ≤ p ≤ 0.049; data not shown). Thirty-four associations in the discovery cohort (6.2×10⁻⁹ ≤ p ≤ 0.049) were replicated in the Australian replication cohort (0.001 ≤ p ≤ 0.049) (Table 2 and Figure 2D), with the same directions of gene effects in both cohorts. Meta-analysis showed that all of these 34 replicable SNPs were associated with disease (9.6×10⁻¹⁰ ≤ p ≤ 0.021; Table 2), including four genome-wide significant SNPs, i.e., rs7445832 (p=9.6×10⁻¹⁰), rs13361996 (p=8.2×10⁻⁹), rs62380518 (p=2.3×10⁻⁸) and rs7714850 (p=3.4×10⁻⁸). In the African-American replication cohort, 77 SNPs were nominally associated with alcohol and nicotine co-dependence (0.002 ≤ p ≤ 0.049; data not shown). Eleven risk SNPs in the discovery cohort (8.1×10⁻⁶ ≤ p ≤ 0.042) were also risk SNPs in the African-American replication cohort (0.032 ≤ p ≤ 0.049) (Table 3). However, all of these 11 SNPs but one had opposite directions of gene effects between the discovery cohort and the African-American cohort. Meta-analysis showed that only this exceptional one SNP was associated with disease (rs10042968: OR=1.41, p=8.1×10⁻⁶ in European-Americans; OR=1.54, p=0.041 in African-Americans; OR=1.42, p=8.0×10⁻⁷ in meta-analysis; Table 3). Among these SNPs, rs690957 was a risk SNP across three cohorts (p=0.008, 0.004 and 0.047 in European-Americans, European-Australians and African-Americans, respectively). Rs690957 was also the most significant one in European-Australians (Table 4). In other 18 independent cohorts, 9-261 SNPs were nominally associated with diseases, but none of them survived region- and cohort-wide correction for multiple comparisons (Table 4).
Table 4.
Associations between IPO-11-HTR1A gene region and different neuropsychiatric disorders
| Human Diseases | Dataset # | SNP # (total) | SNP # (p<0.05) | Minimal p value | Most sig. SNP | Gene | Minor allele frequency | |
|---|---|---|---|---|---|---|---|---|
| Affected | Unaffected | |||||||
| AD+ND | 1 | 2726 | 381 | 6.2×10⁻⁹ | rs7445832 | Sig. region | 0.289 | 0.211 |
| AD+ND | 2 | 2605 | 100 | 0.001 | rs690957 | Intergenic | 0.084 | 0.076 |
| AD+ND | 3 | 2901 | 77 | 0.002 | rs1353270 | Intergenic | 0.184 | 0.126 |
| ADHD | 4 | 2716 | 67 | 2.8×10⁻⁴ | rs1478498 | Intergenic | 0.229 | 0.236 |
| Schizophrenia | 5 | 2087 | 216 | 0.001 | rs923963 | Intergenic | 0.372 | 0.326 |
| Schizophrenia | 6 | 1997 | 62 | 0.001 | rs9283703 | Intergenic | 0.392 | 0.493 |
| Schizophrenia | 7 | 2013 | 126 | 0.001 | rs7707596 | Sig. region | 0.059 | 0.094 |
| Autism | 8 | 2587 | 86 | 0.003 | rs1319474 | Sig. region | 0.128 | 0.134 |
| Major Depression | 9 | 2743 | 143 | 0.005 | rs16892399 | Intergenic | 0.255 | 0.226 |
| Bipolar Disorder | 10 | 2015 | 9 | 0.018 | rs35509126 | Intergenic | 0.101 | 0.068 |
| Bipolar Disorder | 11 | 2015 | 164 | 0.001 | rs347670 | Sig. region | 0.093 | 0.060 |
| Bipolar Disorder | 12 | 1948 | 95 | 0.002 | rs260991 | Intergenic | 0.052 | 0.117 |
| Alzheimer’s Disease | 13 | 2678 | 170 | 3.0×10⁻⁴ | rs4449492 | Intergenic | 0.473 | 0.457 |
| Alzheimer’s disease | 14 | 1570 | 175 | 0.001 | rs1160346 | Intergenic | 0.216 | 0.119 |
| ALS | 15 | 2492 | 143 | 0.002 | rs1422301 | Sig. region | 0.197 | 0.281 |
| Early Onset Stroke | 16 | 2559 | 79 | 0.002 | rs16891019 | Intergenic | 0.196 | 0.140 |
| Early Onset Stroke | 17 | 2817 | 144 | 0.001 | rs56280615 | Sig. region | 0.054 | 0.118 |
| Ischemic Stroke | 18 | 2435 | 261 | 1.2×10⁻⁴ | rs13186191 | Intergenic | 0.319 | 0.184 |
| Parkinson’s Disease | 19 | 2614 | 95 | 0.001 | rs1851333 | Intergenic | 0.109 | 0.135 |
| Parkinson’s Disease | 20 | 2572 | 149 | 3.1×10⁻⁴ | rs34606485 | Sig. region | 0.070 | 0.132 |
| Parkinson’s Disease | 21 | 2683 | 95 | 0.004 | rs6888308 | Intergenic | 0.324 | 0.278 |
Cis-eQTL analysis showed that, among the risk SNPs for alcohol and nicotine co-dependence, 30 SNPs had nominal cis-acting regulatory effects on expression of HTR1A or IPO11 mRNA in the brain, PBMC or lymphoblastoid cell lines (2.3×10⁻¹³ ≤ p ≤ 0.05); among all of the 65 SNPs within this region that were genotyped for eQTL analysis, 43 (66.2%) were risk markers for alcohol and nicotine co-dependence (6.2×10⁻⁹ ≤ p ≤ 0.048) (Table S2). Cis-regulatory effects on IPO11 expression were much stronger than those on HTR1A expression. All of the risk alleles for alcohol and nicotine co-dependence increased the expression of HTR1A. However, some of the risk alleles increased the expression of IPO11 but the others decreased it.
Additionally, a total of 2,058 SNPs in ARHGAP10, MARK1, DDX6, KIAA1409, CTBP2, GRM3, TBC1D2B, BACH2 and CNTNA that were significant risk genes for alcohol dependence, alcohol and nicotine co-dependence or nicotine dependence identified by Lind et al. (2010) were also tested in our samples. We listed all p values <0.01 in the Supplemental Table S3. We found that none of these markers were significantly associated with alcohol and nicotine co-dependence in our samples after Bonferroni correction.
Discussion
In the European-American population, we identified a genome-wide significant risk marker at the IPO11-HTR1A region specific for alcohol and nicotine co-dependence. The region surrounding this marker was enriched with many association signals and functional signals. We speculated that this region might harbor a causal variant for alcohol and nicotine co-dependence.
Several pieces of evidence supported our conclusion. First, within 10Mb range surrounding this genome-wide significant risk SNP, all association signals for alcohol and nicotine co-dependence with p<10−4 were concentrated within a narrow region surrounding this SNP. This region was completely located between HTR1A and IPO11. It is, thus, highly likely that the putative causal variant for alcohol and nicotine co-dependence was located within this region. Second, many risk SNPs in this region had significant cis-acting regulatory effects on mRNA expression both in the PBMC and in the brain, increasing the possibility that the IPO11-HTR1A region plays a direct functional role in the disorder. Third, many associations discovered in European-Americans were replicated in European-Australians, and meta-analysis showed that four SNPs reached the genome-wide significance level. Some associations in European-Americans were also replicated in African-Americans. Finally, this region was specific for alcohol and nicotine co-dependence, not for any other non-alcoholism neuropsychiatric disorder examined. This region has been suggestively associated with alcohol dependence (75.6% nicotine dependence) in the same dataset before (p=2.3×10⁻⁶ by Bierut et al. 2010; p=2.8×10⁻⁷ by Zuo et al. 2011), but not genome-wide significant (α=5×10⁻⁸). The association was genome-wide significant only in the subgroup with alcohol and nicotine co-dependence (p=6.2×10⁻⁹), which might suggest that this region is associated with a more severe subtype of alcohol dependence.
It is worth noting that the “causal” variants may not be identical to the “risk” markers, which is actually a common limitation of most association studies. There were other reasons for this inconsistency between the “causal” variants and the “risk” markers implicated in the current study. First, none of the risk SNPs presented here were non-synonymous. Rather, they appeared to have implications for risk and function by virtue of their being in LD with a putative causal variant and/or due to their location in the regulatory region that may in turn regulated transcription of the causal variant. Second, the SNPs employed by GWAS are common, but not rare, variants. Numerous studies have shown that many gene-disease associations are not due to a single common variant, but rather due to a constellation of more rare, regionally concentrated, disease-causing variants. Thus, the signals of association credited to our common SNPs might be synthetic associations resulting from the contributions of multiple rare SNPs in the IPO11-HTR1A region, which needs to be identified by sequencing. Third, the associations in the European-American discovery cohort, the associations in the replication cohorts, and the functional signals in the eQTL analysis did not perfectly match, which was probably because these risk markers were not the causal variants per se, but rather in LD with a common putative causal variant. Fourth, current evidence, including the effect sizes and the significance strength of associations, was not sufficient to fine-map the putative causal variant to any one of the four genome-wide significant risk markers, although the most significant one (i.e., rs7445832) was most likely. Sequencing is warranted to detect the actual causal variant. Finally, after conditioning on rs7445832, all association signals for other markers were significantly reduced, which might suggest there exists only one putative causal locus in this region.
Our study is the first to detect the association between HTR1A and alcohol and nicotine co-dependence at a genome-wide significance level. HTR1A is located in 5q11.2-q13. It encodes the 5-HT1A receptor that binds the endogenous neurotransmitter serotonin (5-hydroxytryptamine, 5-HT). This receptor is a G protein-coupled receptor (GPCR) that is coupled to Gi/Go and mediates inhibitory neurotransmission. In the central nervous system, 5-HT1A receptors exist in the cerebral cortex, hippocampus, septum, amygdala, and raphe nucleus in high densities. The activation of 5-HT1A receptor has been shown to increase dopamine release in the medial prefrontal cortex, striatum, and hippocampus, to impair cognition, learning, and memory by inhibiting the release of glutamate and acetylcholine in various areas of the brain, or to increase impulsivity and inhibition of addictive behaviors. This activation is therefore likely to be related to the development of alcohol dependence or nicotine dependence. This is consistent with our findings that the risk alleles of the variants in the IPO11-HTR1A region for alcohol and nicotine co-dependence increased the expression of HTR1A. Additionally, a well-known and functional promoter SNP of HTR1A, C-1016G (rs6295), displays differential binding to repressors and affects transcription (Lemonde et al., 2003; Strobel et al., 2003). Its minor allele G has been reported to increase risk for alcohol dependence (Lee et al., 2009) or increase the relapse rate of alcohol dependence (Wojnar et al., 2006), which is consistent with our conclusion that minor alleles in this region are risk alleles.
IPO11 is a flanking gene of HTR1A. It encodes the importin 11 that is a member of the karyopherin/importin-beta family of transport receptors. This receptor mediates nucleocytoplasmic transport of protein and RNA cargoes (Plafker and Macara, 2000). It has been reported that, in mice, IPO11 expression was significantly regulated by ethanol in the prefrontal cortex (Kerns et al., 2005) and in the whole embryos (Zhou et al., 2011). In the present study, we found many alcohol and nicotine co-dependence-associated markers had significant cis-acting regulatory effects on IPO11 mRNA expression both in the brain and the PBMC. Thus, IPO11 might play important roles in alcohol and nicotine co-dependence too.
Among CHRNA6-CHRNB3 and CHRNA5-CHRNA3-CHRNB4 regions that have been widely associated to both alcohol and nicotine dependence before (Edenberg et al., 2004; Bierut et al., 2007; Saccone et al., 2007; Ray et al., 2009; Liu et al., 2010; Thorgeirsson et al., 2010), we only found that CHRNA6^rs6474421 was modestly associated with alcohol and nicotine co-dependence in the European-American discovery cohort (p=0.005). Furthermore, this modest association was not replicated in the Australian and African-American replication cohorts, nor did the marker make the top-ranked gene list in the present study, consistent with previous results using the same SAGE dataset (Bierut et al., 2010; Wang et al., 2011). Additionally, the risk genes identified by Lind et al. (2010) were not significantly associated with alcohol and nicotine co-dependence in our samples after Bonferroni correction. Critical difference between the study of Lind et al. (2010) and ours might result from the sample heterogeneity. Finally, in the present study, only the region between the TSS of IPO11 and the TSS of HTR1A was studied. The 5′ regulatory regions, which boundaries are hard to defined, of both genes were excluded. Some information in these 5′ regulatory regions might be lost.
Supplementary Material
Acknowledgments
We thank for Dr. Weissbecker’s helpful comments. This work was supported in part by National Institute on Drug Abuse (NIDA) grants K01 DA029643 and R01DA016750, National Institute on Alcohol Abuse and Alcoholism (NIAAA) grants R01 AA016015 and R21 AA020319 and the National Alliance for Research on Schizophrenia and Depression (NARSAD) Award 17616 (L.Z.). We thank NIH GWAS Data Repository, the Contributing Investigator(s) who contributed the phenotype and genotype data from his/her original study (e.g., Drs. Bierut, Edenberg, Heath, Singleton, Hardy, Foroud, Myers, Gejman, Faraone, Sonuga-Barke, Sullivan, Nurnberger, Devlin, Monaco, etc.), and the primary funding organization that supported the contributing study. Funding and other supports for phenotype and genotype data were provided through the National Institutes of Health (NIH) Genes, Environment and Health Initiative (GEI) (U01HG004422, U01HG004436 and U01HG004438); the GENEVA Coordinating Center (U01HG004446); the NIAAA (U10AA008401, R01AA013320, P60AA011998); the NIDA (R01DA013423); the National Cancer Institute (P01 CA089392); the Division of Neuroscience, the NIA National Institute of Neurological Disorders and Stroke (NINDS); the NINDS Human Genetics Resource Center DNA and Cell Line Repository; the NIH contract “High throughput genotyping for studying the genetic contributions to human disease” (HHSN268200782096C); the Center for Inherited Disease Research (CIDR); a Cooperative Agreement with the Division of Adult and Community Health, Centers for Disease Control and Prevention; the NIH Office of Research on Women’s Health (ORWH) (R01NS45012); the Department of Veterans Affairs; the University of Maryland General Clinical Research Center (M01RR165001), the National Center for Research Resources, NIH; the National Institute of Mental Health (R01MH059160, R01MH59565, R01MH59566, R01MH59571, R01MH59586, R01MH59587, R01MH59588, R01MH60870, R01MH60879, R01MH61675, R01MH62873, R01MH081803, R01MH67257, R01MH81800, U01MH46276, U01MH46282, U01MH46289, U01MH46318, U01MH79469, U01MH79470 and R01MH67257); the NIMH Genetics Initiative for Bipolar Disorder; the Genetic Association Information Network (GAIN); the Genetic Consortium for Late Onset Alzheimer’s Disease; the Autism Genome Project, the MARC: Risk Mechanisms in Alcoholism and Comorbidity; the Molecular Genetics of Schizophrenia Collaboration; the Medical Research Council (G0601030) and the Wellcome Trust (075491/Z/04), University of Oxford; the Netherlands Scientific Organization (904-61-090, 904-61-193, 480-04-004, 400-05-717, NWO Genomics, SPI 56-464-1419) the Centre for Neurogenomics and Cognitive Research (CNCR-VU); Netherlands Study of Depression and Anxiety (NESDA) and the Netherlands Twin Register (NTR); and the European Union (EU/WLRT-2001-01254), ZonMW (geestkracht program, 10-000-1002). Assistance with phenotype harmonization and genotype cleaning, as well as with general study coordination, was provided by the Genetic Consortium for Late Onset Alzheimer’s Disease, the GENEVA Coordinating Center (U01 HG004446), and the National Center for Biotechnology Information. Genotyping was performed at the Johns Hopkins University Center for Inherited Disease Research, and GlaxoSmithKline, R&D Limited. The datasets used for the analyses described in this manuscript were obtained from dbGaP at http://www.ncbi.nlm.nih.gov/sites/entrez?Db=gap through dbGaP accession numbers listed in Table S1. XL had full access to all of the data in the study and takes responsibility for the integrity of the data and the accuracy of the data analysis.
Footnotes
Conflict of Interest: I have read the journal’s policy and have the following conflicts. Dr. Krystal has been a paid consultant for Aisling Capital, LLC, AstraZeneca Pharmaceuticals, Brintnall & Nicolini, Inc., Easton Associates, Gilead Sciences, Inc., GlaxoSmithKline, Janssen Pharmaceuticals, Lundbeck Research USA, Medivation, Inc., Merz Pharmaceuticals, MK Medical Communications, F. Hoffmann-La Roche Ltd, SK Holdings Co., Ltd, Sunovion Pharmaceuticals, Inc., Takeda Industries and Teva Pharmaceutical Industries, Ltd. He serves as a member of Scientific Advisory Boards for Abbott Laboratories, Bristol-Myers Squibb, Eisai, Inc., Eli Lilly and Co., Forest Laboratories, Inc., Lohocla Research Corporation, Mnemosyne Pharmaceuticals, Inc., Naurex, Inc., Pfizer Pharmaceuticals and Shire Pharmaceuticals. He is the Editor for Biological Psychiatry, a member of Board of Directors of Coalition for Translational Research in Alcohol and Substance Use Disorders, and the President Elect for American College of Neuropsychopharmacology. He also gets support from Tetragenex Pharmaceuticals.
Other authors have no conflict of interest.
References
- American Psychiatric Association. Diagnostic and statistical manual of mental disorders. 4. American Psychiatric Press; Washington, DC: 1994. [Google Scholar]
- Bierut LJ, Agrawal A, Bucholz KK, Doheny KF, Laurie C, Pugh E, Fisher S, Fox L, Howells W, Bertelsen S, Hinrichs AL, Almasy L, Breslau N, Culverhouse RC, Dick DM, Edenberg HJ, Foroud T, Grucza RA, Hatsukami D, Hesselbrock V, Johnson EO, Kramer J, Krueger RF, Kuperman S, Lynskey M, Mann K, Neuman RJ, Nothen MM, Nurnberger JI, Jr, Porjesz B, Ridinger M, Saccone NL, Saccone SF, Schuckit MA, Tischfield JA, Wang JC, Rietschel M, Goate AM, Rice JP. A genome-wide association study of alcohol dependence. Proc Natl Acad Sci U S A. 2010;107:5082–5087. doi: 10.1073/pnas.0911109107. [DOI] [PMC free article] [PubMed] [Google Scholar]
- Bierut LJ, Madden PA, Breslau N, Johnson EO, Hatsukami D, Pomerleau OF, Swan GE, Rutter J, Bertelsen S, Fox L, Fugman D, Goate AM, Hinrichs AL, Konvicka K, Martin NG, Montgomery GW, Saccone NL, Saccone SF, Wang JC, Chase GA, Rice JP, Ballinger DG. Novel genes identified in a high-density genome wide association study for nicotine dependence. Hum Mol Genet. 2007;16:24–35. doi: 10.1093/hmg/ddl441. [DOI] [PMC free article] [PubMed] [Google Scholar]
- Bucholz KK, Cadoret R, Cloninger CR, Dinwiddie SH, Hesselbrock VM, Nurnberger JI, Jr, Reich T, Schmidt I, Schuckit MA. A new, semi-structured psychiatric interview for use in genetic linkage studies: a report on the reliability of the SSAGA. J Stud Alcohol. 1994;55:149–158. doi: 10.15288/jsa.1994.55.149. [DOI] [PubMed] [Google Scholar]
- Carmelli D, Swan GE, Robinette D. The relationship between quitting smoking and changes in drinking in World War II veteran twins. J Subst Abuse. 1993;5:103–116. doi: 10.1016/0899-3289(93)90055-g. [DOI] [PubMed] [Google Scholar]
- Edenberg HJ, Bierut LJ, Boyce P, Cao M, Cawley S, Chiles R, Doheny KF, Hansen M, Hinrichs T, Jones K, Kelleher M, Kennedy GC, Liu G, Marcus G, McBride C, Murray SS, Oliphant A, Pettengill J, Porjesz B, Pugh EW, Rice JP, Rubano T, Shannon S, Steeke R, Tischfield JA, Tsai YY, Zhang C, Begleiter H. Description of the data from the Collaborative Study on the Genetics of Alcoholism (COGA) and single-nucleotide polymorphism genotyping for Genetic Analysis Workshop 14. BMC Genet. 2005;6(Suppl 1):S2. doi: 10.1186/1471-2156-6-S1-S2. [DOI] [PMC free article] [PubMed] [Google Scholar]
- Edenberg HJ, Dick DM, Xuei X, Tian H, Almasy L, Bauer LO, Crowe RR, Goate A, Hesselbrock V, Jones K, Kwon J, Li TK, Nurnberger JI, Jr, O’Connor SJ, Reich T, Rice J, Schuckit MA, Porjesz B, Foroud T, Begleiter H. Variations in GABRA2, encoding the alpha 2 subunit of the GABA(A) receptor, are associated with alcohol dependence and with brain oscillations. Am J Hum Genet. 2004;74:705–714. doi: 10.1086/383283. [DOI] [PMC free article] [PubMed] [Google Scholar]
- Edenberg HJ, Koller DL, Xuei X, Wetherill L, McClintick JN, Almasy L, Bierut LJ, Bucholz KK, Goate A, Aliev F, Dick D, Hesselbrock V, Hinrichs A, Kramer J, Kuperman S, Nurnberger JI, Jr, Rice JP, Schuckit MA, Taylor R, Todd Webb B, Tischfield JA, Porjesz B, Foroud T. Genome-wide association study of alcohol dependence implicates a region on chromosome 11. Alcohol Clin Exp Res. 2010;34:840–852. doi: 10.1111/j.1530-0277.2010.01156.x. [DOI] [PMC free article] [PubMed] [Google Scholar]
- Grant BF, Hasin DS, Chou SP, Stinson FS, Dawson DA. Nicotine dependence and psychiatric disorders in the United States: results from the national epidemiologic survey on alcohol and related conditions. Arch Gen Psychiatry. 2004;61:1107–1115. doi: 10.1001/archpsyc.61.11.1107. [DOI] [PubMed] [Google Scholar]
- Heath AC, Whitfield JB, Martin NG, Pergadia ML, Goate AM, Lind PA, McEvoy BP, Schrage AJ, Grant JD, Chou YL, Zhu R, Henders AK, Medland SE, Gordon SD, Nelson EC, Agrawal A, Nyholt DR, Bucholz KK, Madden PA, Montgomery GW. A quantitative-trait genome-wide association study of alcoholism risk in the community: findings and implications. Biol Psychiatry. 2011;70:513–518. doi: 10.1016/j.biopsych.2011.02.028. [DOI] [PMC free article] [PubMed] [Google Scholar]
- Heinzen EL, Ge D, Cronin KD, Maia JM, Shianna KV, Gabriel WN, Welsh-Bohmer KA, Hulette CM, Denny TN, Goldstein DB. Tissue-specific genetic control of splicing: implications for the study of complex traits. PLoS Biol. 2008;6:e1. doi: 10.1371/journal.pbio.1000001. [DOI] [PMC free article] [PubMed] [Google Scholar]
- Horvath S, Xu X, Laird NM. The family based association test method: strategies for studying general genotype--phenotype associations. Eur J Hum Genet. 2001;9:301–306. doi: 10.1038/sj.ejhg.5200625. [DOI] [PubMed] [Google Scholar]
- Johnson C, Drgon T, Walther D, Uhl GR. Genomic Regions Identified by Overlapping Clusters of Nominally-Positive SNPs from Genome-Wide Studies of Alcohol and Illegal Substance Dependence. PLoS One. 2011;6:e19210. doi: 10.1371/journal.pone.0019210. [DOI] [PMC free article] [PubMed] [Google Scholar]
- Kerns RT, Ravindranathan A, Hassan S, Cage MP, York T, Sikela JM, Williams RW, Miles MF. Ethanol-responsive brain region expression networks: implications for behavioral responses to acute ethanol in DBA/2J versus C57BL/6J mice. J Neurosci. 2005;25:2255–2266. doi: 10.1523/JNEUROSCI.4372-04.2005. [DOI] [PMC free article] [PubMed] [Google Scholar]
- Lee YS, Choi SW, Han DH, Kim DJ, Joe KH. Clinical manifestation of alcohol withdrawal symptoms related to genetic polymorphisms of two serotonin receptors and serotonin transporter. Eur Addict Res. 2009;15:39–46. doi: 10.1159/000173008. [DOI] [PubMed] [Google Scholar]
- Lemonde S, Turecki G, Bakish D, Du L, Hrdina PD, Bown CD, Sequeira A, Kushwaha N, Morris SJ, Basak A, Ou XM, Albert PR. Impaired repression at a 5-hydroxytryptamine 1A receptor gene polymorphism associated with major depression and suicide. J Neurosci. 2003;23:8788–8799. doi: 10.1523/JNEUROSCI.23-25-08788.2003. [DOI] [PMC free article] [PubMed] [Google Scholar]
- Li J, Ji L. Adjusting multiple testing in multilocus analyses using the eigenvalues of a correlation matrix. Heredity (Edinb) 2005;95:221–227. doi: 10.1038/sj.hdy.6800717. [DOI] [PubMed] [Google Scholar]
- Lind PA, Macgregor S, Vink JM, Pergadia ML, Hansell NK, de Moor MH, Smit AB, Hottenga JJ, Richter MM, Heath AC, Martin NG, Willemsen G, de Geus EJ, Vogelzangs N, Penninx BW, Whitfield JB, Montgomery GW, Boomsma DI, Madden PA. A genomewide association study of nicotine and alcohol dependence in Australian and Dutch populations. Twin Res Hum Genet. 2010;13:10–29. doi: 10.1375/twin.13.1.10. [DOI] [PMC free article] [PubMed] [Google Scholar]
- Liu JZ, Tozzi F, Waterworth DM, Pillai SG, Muglia P, Middleton L, Berrettini W, Knouff CW, Yuan X, Waeber G, Vollenweider P, Preisig M, Wareham NJ, Zhao JH, Loos RJ, Barroso I, Khaw KT, Grundy S, Barter P, Mahley R, Kesaniemi A, McPherson R, Vincent JB, Strauss J, Kennedy JL, Farmer A, McGuffin P, Day R, Matthews K, Bakke P, Gulsvik A, Lucae S, Ising M, Brueckl T, Horstmann S, Wichmann HE, Rawal R, Dahmen N, Lamina C, Polasek O, Zgaga L, Huffman J, Campbell S, Kooner J, Chambers JC, Burnett MS, Devaney JM, Pichard AD, Kent KM, Satler L, Lindsay JM, Waksman R, Epstein S, Wilson JF, Wild SH, Campbell H, Vitart V, Reilly MP, Li M, Qu L, Wilensky R, Matthai W, Hakonarson HH, Rader DJ, Franke A, Wittig M, Schafer A, Uda M, Terracciano A, Xiao X, Busonero F, Scheet P, Schlessinger D, St Clair D, Rujescu D, Abecasis GR, Grabe HJ, Teumer A, Volzke H, Petersmann A, John U, Rudan I, Hayward C, Wright AF, Kolcic I, Wright BJ, Thompson JR, Balmforth AJ, Hall AS, Samani NJ, Anderson CA, Ahmad T, Mathew CG, Parkes M, Satsangi J, Caulfield M, Munroe PB, Farrall M, Dominiczak A, Worthington J, Thomson W, Eyre S, Barton A, Mooser V, Francks C, Marchini J. Meta-analysis and imputation refines the association of 15q25 with smoking quantity. Nat Genet. 2010;42:436–440. doi: 10.1038/ng.572. [DOI] [PMC free article] [PubMed] [Google Scholar]
- Plafker SM, Macara IG. Importin-11, a nuclear import receptor for the ubiquitin-conjugating enzyme, UbcM2. Embo J. 2000;19:5502–5513. doi: 10.1093/emboj/19.20.5502. [DOI] [PMC free article] [PubMed] [Google Scholar]
- Price AL, Patterson NJ, Plenge RM, Weinblatt ME, Shadick NA, Reich D. Principal components analysis corrects for stratification in genome-wide association studies. Nat Genet. 2006;38:904–909. doi: 10.1038/ng1847. [DOI] [PubMed] [Google Scholar]
- Purcell S, Neale B, Todd-Brown K, Thomas L, Ferreira MA, Bender D, Maller J, Sklar P, de Bakker PI, Daly MJ, Sham PC. PLINK: a tool set for whole-genome association and population-based linkage analyses. Am J Hum Genet. 2007;81:559–575. doi: 10.1086/519795. [DOI] [PMC free article] [PubMed] [Google Scholar]
- Ray R, Tyndale RF, Lerman C. Nicotine dependence pharmacogenetics: role of genetic variation in nicotine-metabolizing enzymes. J Neurogenet. 2009;23:252–261. doi: 10.1080/01677060802572887. [DOI] [PMC free article] [PubMed] [Google Scholar]
- Saccone SF, Hinrichs AL, Saccone NL, Chase GA, Konvicka K, Madden PA, Breslau N, Johnson EO, Hatsukami D, Pomerleau O, Swan GE, Goate AM, Rutter J, Bertelsen S, Fox L, Fugman D, Martin NG, Montgomery GW, Wang JC, Ballinger DG, Rice JP, Bierut LJ. Cholinergic nicotinic receptor genes implicated in a nicotine dependence association study targeting 348 candidate genes with 3713 SNPs. Hum Mol Genet. 2007;16:36–49. doi: 10.1093/hmg/ddl438. [DOI] [PMC free article] [PubMed] [Google Scholar]
- Schumann G, Coin LJ, Lourdusamy A, Charoen P, Berger KH, Stacey D, Desrivieres S, Aliev FA, Khan AA, Amin N, Aulchenko YS, Bakalkin G, Bakker SJ, Balkau B, Beulens JW, Bilbao A, de Boer RA, Beury D, Bots ML, Breetvelt EJ, Cauchi S, Cavalcanti-Proenca C, Chambers JC, Clarke TK, Dahmen N, de Geus EJ, Dick D, Ducci F, Easton A, Edenberg HJ, Esko T, Fernandez-Medarde A, Foroud T, Freimer NB, Girault JA, Grobbee DE, Guarrera S, Gudbjartsson DF, Hartikainen AL, Heath AC, Hesselbrock V, Hofman A, Hottenga JJ, Isohanni MK, Kaprio J, Khaw KT, Kuehnel B, Laitinen J, Lobbens S, Luan J, Mangino M, Maroteaux M, Matullo G, McCarthy MI, Mueller C, Navis G, Numans ME, Nunez A, Nyholt DR, Onland-Moret CN, Oostra BA, O’Reilly PF, Palkovits M, Penninx BW, Polidoro S, Pouta A, Prokopenko I, Ricceri F, Santos E, Smit JH, Soranzo N, Song K, Sovio U, Stumvoll M, Surakk I, Thorgeirsson TE, Thorsteinsdottir U, Troakes C, Tyrfingsson T, Tonjes A, Uiterwaal CS, Uitterlinden AG, van der Harst P, van der Schouw YT, Staehlin O, Vogelzangs N, Vollenweider P, Waeber G, Wareham NJ, Waterworth DM, Whitfield JB, Wichmann EH, Willemsen G, Witteman JC, Yuan X, Zhai G, Zhao JH, Zhang W, Martin NG, Metspalu A, Doering A, Scott J, Spector TD, Loos RJ, Boomsma DI, Mooser V, Peltonen L, Stefansson K, van Duijn CM, Vineis P, Sommer WH, Kooner JS, Spanagel R, Heberlein UA, Jarvelin MR, Elliott P. Genome-wide association and genetic functional studies identify autism susceptibility candidate 2 gene (AUTS2) in the regulation of alcohol consumption. Proc Natl Acad Sci U S A. 2011;108:7119–7124. doi: 10.1073/pnas.1017288108. [DOI] [PMC free article] [PubMed] [Google Scholar]
- Stranger BE, Forrest MS, Clark AG, Minichiello MJ, Deutsch S, Lyle R, Hunt S, Kahl B, Antonarakis SE, Tavare S, Deloukas P, Dermitzakis ET. Genome-wide associations of gene expression variation in humans. PLoS Genet. 2005;1:e78. doi: 10.1371/journal.pgen.0010078. [DOI] [PMC free article] [PubMed] [Google Scholar]
- Strobel A, Gutknecht L, Rothe C, Reif A, Mossner R, Zeng Y, Brocke B, Lesch KP. Allelic variation in 5-HT1A receptor expression is associated with anxiety- and depression-related personality traits. J Neural Transm. 2003;110:1445–1453. doi: 10.1007/s00702-003-0072-0. [DOI] [PubMed] [Google Scholar]
- Substance Abuse and Mental Health Services Administration (SAMHSA) NSDUH Series H-37, HHS Publication No SMA 10-4472. Office of Applied Studies; Rockville, MD: 2010. State Estimates of Substance Use from the 2007–2008 National Surveys on Drug Use and Health. [Google Scholar]
- Swan GE, Carmelli D, Cardon LR. Heavy consumption of cigarettes, alcohol and coffee in male twins. J Stud Alcohol. 1997;58:182–190. doi: 10.15288/jsa.1997.58.182. [DOI] [PubMed] [Google Scholar]
- Thorgeirsson TE, Gudbjartsson DF, Surakka I, Vink JM, Amin N, Geller F, Sulem P, Rafnar T, Esko T, Walter S, Gieger C, Rawal R, Mangino M, Prokopenko I, Magi R, Keskitalo K, Gudjonsdottir IH, Gretarsdottir S, Stefansson H, Thompson JR, Aulchenko YS, Nelis M, Aben KK, den Heijer M, Dirksen A, Ashraf H, Soranzo N, Valdes AM, Steves C, Uitterlinden AG, Hofman A, Tonjes A, Kovacs P, Hottenga JJ, Willemsen G, Vogelzangs N, Doring A, Dahmen N, Nitz B, Pergadia ML, Saez B, De Diego V, Lezcano V, Garcia-Prats MD, Ripatti S, Perola M, Kettunen J, Hartikainen AL, Pouta A, Laitinen J, Isohanni M, Huei-Yi S, Allen M, Krestyaninova M, Hall AS, Jones GT, van Rij AM, Mueller T, Dieplinger B, Haltmayer M, Jonsson S, Matthiasson SE, Oskarsson H, Tyrfingsson T, Kiemeney LA, Mayordomo JI, Lindholt JS, Pedersen JH, Franklin WA, Wolf H, Montgomery GW, Heath AC, Martin NG, Madden PA, Giegling I, Rujescu D, Jarvelin MR, Salomaa V, Stumvoll M, Spector TD, Wichmann HE, Metspalu A, Samani NJ, Penninx BW, Oostra BA, Boomsma DI, Tiemeier H, van Duijn CM, Kaprio J, Gulcher JR, McCarthy MI, Peltonen L, Thorsteinsdottir U, Stefansson K. Sequence variants at CHRNB3-CHRNA6 and CYP2A6 affect smoking behavior. Nat Genet. 2010;42:448–453. doi: 10.1038/ng.573. [DOI] [PMC free article] [PubMed] [Google Scholar]
- Treutlein J, Cichon S, Ridinger M, Wodarz N, Soyka M, Zill P, Maier W, Moessner R, Gaebel W, Dahmen N, Fehr C, Scherbaum N, Steffens M, Ludwig KU, Frank J, Wichmann HE, Schreiber S, Dragano N, Sommer WH, Leonardi-Essmann F, Lourdusamy A, Gebicke-Haerter P, Wienker TF, Sullivan PF, Nothen MM, Kiefer F, Spanagel R, Mann K, Rietschel M. Genome-wide association study of alcohol dependence. Arch Gen Psychiatry. 2009;66:773–784. doi: 10.1001/archgenpsychiatry.2009.83. [DOI] [PMC free article] [PubMed] [Google Scholar]
- Wang KS, Liu X, Zhang Q, Pan Y, Aragam N, Zeng M. A meta-analysis of two genome-wide association studies identifies 3 new loci for alcohol dependence. J Psychiatr Res. 2011;45:1419–1425. doi: 10.1016/j.jpsychires.2011.06.005. [DOI] [PubMed] [Google Scholar]
- Wojnar M, Brower KJ, Jakubczyk A, Zmigrodzka I, Burmeister M, Matsumoto H, Wozny E, Sliwerska E, Hegedus AM, Husar A, Slufarska A, Lipinski M, Zucker RA. Influence of impulsivity, suicidality and serotonin genes on treatment outcomes in alcohol dependence. Psychiatr Pol. 2006;40:985–994. [PubMed] [Google Scholar]
- Zhou FC, Zhao Q, Liu Y, Goodlett CR, Liang T, McClintick JN, Edenberg HJ, Li L. Alteration of gene expression by alcohol exposure at early neurulation. BMC Genomics. 2011;12:124. doi: 10.1186/1471-2164-12-124. [DOI] [PMC free article] [PubMed] [Google Scholar]
- Zuo L, Zhang CK, Wang F, Li CS, Zhao H, Lu L, Zhang XY, Lu L, Zhang H, Zhang F, Krystal JH, Luo X. A novel, functional and replicable risk gene region for alcohol dependence identified by genome-wide association study. PLoS One. 2011;6:e26726. doi: 10.1371/journal.pone.0026726. [DOI] [PMC free article] [PubMed] [Google Scholar]
- Zuo L, Zhang H, Malison RT, Li CS, Zhang XY, Wang F, Lu L, Lu L, Wang X, Krystal JH, Zhang F, Deng HW, Luo X. Rare ADH variant constellations are specific for alcohol dependence. Alcohol Alcohol. 2012 doi: 10.1093/alcalc/ags104. doi: 10.1093/alcalc/ags104. [DOI] [PMC free article] [PubMed] [Google Scholar]
Associated Data
This section collects any data citations, data availability statements, or supplementary materials included in this article.