

Abstract
A number of clinical and biochemical studies demonstrate that obesity and insulin resistance are associated with increases in oxidative stress and inflammation. Paradoxically, insulin sensitivity can be enhanced by oxidative inactivation of cysteine residues of phosphatases, and inflammation can be reduced by S-glutathionylation with formation of protein-glutathione mixed disulfides (PSSG). Although oxidation of protein-bound thiols (PSH) is increased in multiple diseases, it is not known whether there are changes in PSH oxidation species in obesity. In this work, we tested the hypothesis that obesity is associated with decreased levels of proteins containing oxidized protein thiols. We examined tissue levels of protein sulfenic acids (PSOH) and PSSG in liver, visceral adipose tissue, and skeletal muscle derived from glucose intolerant, obese-prone Sprague-Dawley rats. Our data indicate that decreases in PSSG content occurred in liver (44%) and adipose (26%) but not skeletal muscle in obese rats fed a 45% fat-calorie diet versus lean rats fed a 10% fat-calorie diet. PSOH content did not change in the tissue between the two groups. The activity of the enzyme glutaredoxin (GLRX) responsible for reversal of PSSG formation did not change in muscle and liver between the two groups. However, levels of GLRX1 were elevated 70% in the adipose tissue of the obese, 45% fat calorie-fed rats. These are the first data to link changes in S-glutathionylation and GLRX1 to adipose tissue in the obese and demonstrate that redox changes in thiol status occur in adipose tissue as a result of obesity.
Keywords: Glutaredoxin, Glutathione, Obesity, Adipose, Sulfenic Acid
Introduction
Obesity and its ensuing co-morbidities such as insulin resistance are of great national and international concern. Several studies indicate that obesity leads to an elevation in oxidative stress 1-4. While obesity is linked to oxidative stress, several lines of evidence indicate that generation of reactive oxygen species (ROS), for example hydrogen peroxide, and protein oxidation are necessary for enhancement of insulin signaling. Studies by Wu and colleagues indicate that insulin treatment leads to reversible, thiol-mediated decreases in PTP activity in adipocytes and that generation of hydrogen peroxide as a result of NADPH-oxidase 4 activity enhances insulin sensitivity 5, 6. Kobayashi and colleagues demonstrates that insulin resistance adipocytes have elevated glutathione (GSH) and that elevated GSH impairs insulin signaling7. Transgenic mice that are deficient in the peroxide clearance enzyme glutathione peroxidase-1 (GPX1; EC 1.11.1.9) have elevated insulin sensitivity; whereas GPX1 overexpressing mice demonstrate insulin resistance8-10. Other data indicate that inflammation, a sequalae of obesity, is downregulated by the S-glutathionylation of NF-κB pathway proteins 11-13. However, scant data exist regarding protein thiol modifications oxidation in the obese state.
The regulation of enzyme activity and protein-protein interaction by the oxidation state of protein thiols (PSH) is a rapidly growing field of study. In particular interest has gathered owing to thiol oxidation as a redox switch that reversibly regulates protein function. In a simplified scheme (Figure 1), the thiolate form of the PSH reacts with hydrogen peroxide to yielding a sulfenic acid14. The sulfenic acid (PSOH) may be further oxidized to a sulfinic or sulfonic acid (PSO2H and PSO3H, respectively)15. PSOH is a divergent point such that PSOH may react with another protein-bound thiol to yield intra/intermolecular disulfides (PSSP) or GSH (i.e. S-glutathionylation) to yield a mixed protein-GSH (PSSG)16. In the case of protein tyrosine phosphatase (PTP1B), the active Cys215 oxidizes to PSOH and then reacts with the amide nitrogen of Ser216 to form a sulfenyl amide17. While direct enzymatic reversal of PSOH to PSH is not documented, the glutaredoxin (GLRX; EC 1.20.4.1) and thioredoxin (Txn; EC 1.8.1.9) family of enzymes are able to reduce the PSSG and PSSP to PSH, respectively18.
Figure 1.

Oxidation scheme of protein bound thiols (PSH). PSH can be oxidized to form sulfenic acid (PSOH). PSOH is a center point as it can react with other thiols such as glutathione (GSH) to form protein-GSH mixed disulfides (PSSG) or with another PSH to form intermolecular or intramolecular disulfides (PSSP). PSOH may react with an amide nitrogen to form a sulfenyl amide (PSN). PSOH may be further oxized to a sulfinic acid (PSO2H) and finally to a sulfonic acid (PSO3H). PSSG and PSSP may be reversed back to PSH via the action of glutaredoxins (GLRX) and thioredoxins (TXN), respectively.
In this work, we tested the hypothesis that obesity induces selective decreases in the content of proteins containing oxidized protein thiols. We examined tissue levels of PSOH and PSSG in liver, visceral adipose tissue, and skeletal muscle derived from glucose intolerant, obese-prone Sprague-Dawley rats. Our data indicate that PSSG content decreased in liver and adipose but not skeletal muscle and that GLRX1 content was elevated in visceral adipose tissue. In addition we introduce the novel use of N-methyl-2-vinylpyridine (M2VP) as a thiol derivatization agent for use in thiol proteomic studies.
Methods and Procedures
Chemicals
N-ethylmaleimide (NEM,), 5,5′-dithio-bis-(2-nitro-benzoic acid) (DTNB), 5,5-dimethyl-1,3-cyclohexanedione (dimedone/DMD), iodoacetic acid (IAA,) protease inhibitor cocktail (PI), Triton® X-100, guanidine hydrochloride, sodium dodecyl sulfate (SDS), diethylenetriaminepentaacetic acid (DEPA) and 2,6-di-tert-butyl-4-methy phenol (BHT) were purchased from Sigma/Aldrich (St. Louis, MO), Dithiothreitol (DTT) was purchased from Research Products International Corp. (Mount Prospect, IL).
Preparation of M2VP
Synthesis of M2VP was performed by the Core Synthesis Facility at North Dakota State University. Under nitrogen atmosphere, 0.95 equivalents of methyl trifluoromethanesulfonate were added slowly to the solution of 2-vinyl pyridine in dry hexane (3mL/mmol) at −10 °C. After stirring for another 3 hour at −10 °C, collected formed white solid by filtration and washed with hexane. Then dried the solid under vacuum for 2 hours and the product was obtained in 82% yield as a white solid.
Mass spectral analysis of the resulting product by Ion Trap-Time of Flight hybrid MSn (Shimadzu SSI, USA) showed a primary ion in positive mode of 120 m/z, with the major fragment ion elicited at 92 m/z. The triflate counterion was evident in negative mode at 149 m/z.
The 1H NMR spectrum of the resulting compound was recorded on a Bruker AVANCE 500 MHz NMR spectrometer. Chemical shifts, δ are reported in ppm relative to SiMe4 in D2O. 1H NMR (D2O, δ): 4.23 (s, 3H, NCH3), 6.07 (d, J = 10 Hz, 1H, =CH), 6.30 (d, J = 17 Hz, 1H, =CH), 7.09 (dd, J1 = 17 Hz, J2 = 10 Hz, 1H, =CH), 7.81 (m, 1H, Harom), 8.13 (m, 1H, Harom), 8.39 (m, 1H, Harom), 8.62 (m, 1H, Harom).
Animal experiments
Obesity model
All experiments were performed in accordance with the NIH guidelines for use of live animals and were approved by the Institutional Animal Care and Use Committee of the USDA/Agricultural Research Service, Grand Forks Human Nutrition Research Center. Obese prone male rats (Crl:OP(CD) strain code: 463; Charles River Laboratories International Inc.) up to 4 weeks of age were placed on a low fat (10% fat calorie) AIN93-based powdered diet for 4 weeks.
At the end of 4 weeks animals were regrouped by in vivo fat/lean body mass ratio with half of the animals placed on a high fat (45% fat calorie) AIN93-based diet (n = 5) and the remaining animals continuing on the 10% fat calorie diet (n = 5). Diet composition is previously published 19. Animals remained on their respective diets for the remaining 12 weeks. Food consumption and weights per animal were recorded daily. Whole body composition analysis was accomplished using an EchoMRI-700 whole body composition analyzer (Echo Medical Systems, LLC, Houston, TX) 20. Animals were euthanized with a 1.37:1 mixture of ketamine (100 mg/ml):xylazine (100 mg/ml) at 1 mL/kg body weight, i.p. and exsanguinated by descending vena cava blood draw. Tissues were quickly removed, frozen in liquid nitrogen, and stored at −80°C until use.
Glucose tolerance tests
Oral glucose tolerance testing (OGTT) was conducted following 10 weeks on the normal fat and high fat diet. OGTT were performed following the recommendations of the Vanderbilt-NIH Mouse Metabolic Phenotyping Center for glucose tolerance testing 21. Animals were fasted for 15 hours and then given glucose (1.34 g/kg lean body mass) orally as a solution dissolved in deionized water. Blood was drawn from the tail artery at baseline (pre glucose challenge), 7, 14, 21, 30, 60, and 90 minutes post glucose challenge. Immediately after each draw whole blood glucose was measured in duplicate with glucose test strips (OneTouch® Ulta® LifeScan, Milpitas, CA).
Determination of thiol content
A six-fold volume of ice-cold methanol was added to protein solutions on ice followed by centrifugation at 14,000 × g for 15 minutes at 4°C. The resulting pellet was washed with 1 mL of cold methanol twice with centrifugation. The final pellet was resuspended by sonication in a 1 mL solution of 1% (w/v) of SDS in homogenizing buffer. A portion of the resuspended sample was used for determination of protein-bound thiol content using DTNB. Another portion was used for determination of protein content. Protein content for all assays was determined using Protein Assay Dye Reagent (Bio-Rad Laboratories, Inc., Hercules, CA) with bovine serum albumin as the standard.
Processing of tissue for PSOH and PSSG content
Sodium acetate buffer (25 mM, pH 5.0) containing 1 mM DTPA and 0.05 mM BHT was used in all experiments unless otherwise noted. Buffers were sparged with argon gas to reduced dissolved O2 content. O2 content was monitored using a Milwaukee 600 dissolved oxygen probe (Milwaukee Instruments Inc., Rocky Mount, NC). The dissolved O2 content of the buffers were reduced from 7.9 mg/L to at least 0.2 mg/L or less and is comparable to results from others 22. Following de-oxygenation of the buffer, Triton® X-100 (0.5% final concentration w/v) M2VP (100 mM final), DMD (25 mM final), and protease inhibitors (1.0% final concentration v/v) were added followed by further argon sparging. M2VP was used to alkylate thiol residues, and DMD was used to derivatize PSOH residues. Tissues were sonicated using a Model 150I sonic dismembrator (Thermo Fisher Scientific Inc., Waltham, MA) with amplitude power setting at 50%. Hepatic tissue samples were sonicated in homogenizing buffer (10X w/v), and added 1:1 with 2X SDS-PAGE sample loading buffer.
Adipose tissue samples were sonicated in homogenizing buffer (1:2 weight/volume), centrifuged at 5000 × g for 10 minutes at 4°C. In order to concentrate adipose proteins, proteins were precipitated using cold acetone. Briefly, the liquid infranatant layer between the fat layer and pelleted material was removed, sonicated, and centrifuged at 10000 × g for 10 minutes at 4°C. A 9-fold volume of ice cold acetone was added to the supernatant which was then vortexed and incubated on ice for 15 minutes, centrifuged at 2000 × g for 10 minutes at 4°C. The supernatant was removed and the pellet was resuspended in 250 μL homogenizing buffer.
Muscle tissue samples were sonicated in homogenizing buffer containing 6 M guanidine hydrochloride (5X w/v) for 1 minute on an ice water bath. Guanidine was included to allow for complete solubilization of muscle proteins. Samples were cooled in ice for 3 minutes and then sonicated again for 30 seconds, centrifuged 10,000 × g for 15 minutes at 4°C. Supernatant was incubated at 37°C for 15 minutes with vortexing every 5 minutes. 50 μl of sample was added to 200 μL 2X SDS loading buffer.
GLRX activity
GLRX activity was measured in liver homogenates using cysteinyl-glutathione disulfide (CySSG) as a substrate coupled to the formation of GSSG and the oxidation of NADPH (A340nm, ε = 6,200 M−1) 23. In experiments studying the effects of NEM and M2VP on GLRX activity, liver homogenates were passed through a 10-fold volume G10 sephadex column in order to remove M2VP and NEM. In other experiments, tissue levels GLRX activity were measured in the intact homogenate. Tissue homogenization by either mechanically by Dounce homogenizer or by brief sonication (50% amplitude for less than 30 seconds) provided similar GLRX activity in liver homogenate. In the experiments presented, tissue samples were mechanically homogenized in buffer (1:10 w/v), and centrifuged 10,000 × g for 5 m at 4°C.
Immunoblotting
Proteins from tissues were separated by SDS-PAGE using 10% or 12% polyacrylamide gels (Invitrogen Corporation, Carlsbad, CA). Protein samples were added 1:1 with 2X loading buffer or 3:1 with 4X loading buffer (v/v). Following electrophoresis, proteins were transferred to a 0.45 μm PVDF membrane and the resulting membrane was blocked in 5% non-fat dry milk (NFDM) dissolved in Tris-buffered saline (TBS) for 2 hours at 20°C. Antibodies were diluted in 5% NFDM in TBS containing 0.1% Tween 20 (TBST) and incubated overnight at 4°C. Following washing of the blots they were incubated for 2 hours at 20°C in the appropriate anti-mouse or anti-rabbit secondary antibody (Promega, Madison, WI) conjugated to horseradish peroxidase diluted in 5% NFDM in TBST (1:6000) . Blots were developed using Pierce® ECL western blotting substrate (Thermo Fisher Scientific Inc., Waltham, MA) imaged on a Biospectrum® 500 imaging system and quantified using Vision Works™LS Image Acquisition and Analysis Software (UVP, Upland, CA).
The following antibodies were used: mouse anti-GSH antibody (1:2000 dilution; Chemicon/Millipore, Temecula, CA), rabbit anti-PS-DMD antibody (1:3,000 dilution; Chemicon/Millipore, Temecula, CA), rabbit anti-GLRX1 antibody (1:2000 dilution; Sigma, St. Louis, MO), and rabbit anti-glutathione-S-transferase Pi (GSTP; 1:2000 dilution; Enzo Life Sciences, Plymouth Meeting, PA).
Dot blotting
Dot blot analysis of liver, gastrocnemius and perirenal adipose tissue samples prepared with DMD and M2VP provided saturable binding curves with anti-GSH and anti-DMD (not shown). Protein concentrations of 0.30 μg (liver) or 0.50 μg (gastrocnemius, perirenal adipose tissue) per well were utilized as these concentrations were in the middle of the linear portion of the saturation curves. Proteins were diluted in TBS and loaded onto a 0.45 μm PVDF membrane using a Bio-Dot™ Apparatus (Bio-Rad Laboratories Inc.). Membranes were washed with TBS on the blotting apparatus, removed, and blocked in 5% NFDM/TBS. Antibody dilutions and incubations conducted as described above.
Determination of hepatic and adipose GSH content
GSH and GSSG content were determined using a modification of the method reported by Dringen and colleagues 24. Tissue samples were sonicated in 5% sulfosalicylic acid (SSA) in a ratio of 1:5 (w/v) for liver and 1:4 (w/v) for peri-renal adipose tissue. Homogenates were centrifuged at 12000 × g for 10 minutes. The liver supernatant was removed and assayed for GSH and GSSG activity. Adipose samples sonicated in the presence of SSA did not yield a distinct protein pellet as the large majority of the protein appeared to be associated with the floating lipid layer. The SSA containing liquid layer was carefully removed by pipet, leaving a lipid/protein pellet. For GSH determination liver supernatants were diluted 1:800 with 0.1 M sodium phosphate dibasic pH 7.4 containing 1 mM EDTA. Peri-renal adipose supernatants were diluted 1:5. Diluted supernatant (50 μL) was combined with 100 μL of the assay reaction mixture [0.3 mM NADPH, 0.24 mM DTNB, 2.24 units glutathione reductase]. Absorbance was read at 405 nm at 25°C over a 2 minute period. GSSG content was determined by pipetting 10 μL of SSA sample into 10 μL of 6 mM M2VP then adding 80 μL of 100 mM sodium carbonate, followed by incubation for 2 min at room temperature. 50 μL of M2VP treated liver sample [1:20 final dilution] or 50 μl M2VP treated adipose [1:10 final dilution] were then assayed with the same reaction mix concentrations used in the GSH assay. Standard curves were performed with GSH or GSSG as appropriate. The liver pellet was frozen and later dissolved in 0.5 N NaOH for protein analysis by Bio-Rad protein assay with final results being expressed GSH and GSSG content per mg protein. We attempted to acetone extract the lipid/protein floating layer to recover adipose proteins. However, this method did not yield a distinct protein pellet for protein determination. Thus, GSH and GSSG content for adipose is normalized to gram wet weight of starting tissue.
Statistics
Data were analyzed using one-way ANOVA, two-way ANOVA or Student’s t-test as appropriate using GraphPad Prism version 5.00 for Windows (GraphPad Software, San Diego California USA, www.graphpad.com). Statistical significance was taken as p ≤ 0.05.
Results
The initial portion of this work was to develop a facile method for the preparation of multiple tissues for analysis of thiol oxidation (PSOH, PSSG) on proteins. In addition to limiting dissolved O2, alkylation of thiol groups by agents such as NEM and IAA is used to prevent artifactual oxidation of thiols. We compared the ability of NEM, IAA, and M2VP (Figure 2A) to cause thiol depletion at pH 5.0. We tested M2VP as an alternate thiol alkylating agent owing to studies indicating that 2-vinylpyridine derivatives have favorable thiol alkylation properties below neutral pH 25. Furthermore, the aromatic quaternary amine moiety of M2VP allowed for satisfactory solubility at concentrations ≥ 100 mM in aqueous solution. NEM and M2VP had similar thiol depletion characteristics upon liver homogenate with approximately 50% of protein-bound thiols being alkylated. On the other hand, IAA produced little thiol alkylation at pH 5.0. These results comparing NEM and IAA are similar to those obtained by Rogers and colleagues 26. Because of the poor alkylation results of IAA we did not examine IAA further.
Figure 2. M2VP alkylates protein thiols and blocks GLRX activity.

(A) M2VP alkylates protein-bound thiols. Liver homogenates (pH 5.0) were treated with increasing concentrations of thiol alkylators M2VP, NEM, or IAA for 15 minutes on ice before MEOH precipitation and thiol content determined with DTNB. Note: Total free thiol content could not be completely abolished. There was no difference between NEM or M2VP as determined by two-way ANOVA. (B) M2VP and NEM prevent PSOH formation. Liver homogenates (sodium acetate, pH 5.0) were added to tubes ± DMD (25 mM final) ± M2VP or NEM (100 mM each) and incubated for 15 minutes on ice. Samples were analyzed by western blot for PSOH content. A representative blot is shown. Quantitation of signal demonstrated that the inclusion of M2VP with DMD blocked formation of the DMD alone signal by 95%. Note that NEM caused the formation of different immunoreactive proteins (encircled) than with M2VP. (C) Samples in (B) were analyzed for PSSG content by dot blot. PSSG content was significantly increased with the inclusion of M2VP and NEM. * p < 0.05 compared to control samples with nothing added using one-way ANOVA. Similar results are shown by western blot for PSSG (D). (E) M2VP abolishes GLRX activity. Liver were homogenized with 100 mM NEM or 100 mM M2VP followed by G10 sephadex separation and determination of GLRX activity. N.D. = not detectable. * p <0.05 comparing NEM to control using Student’s t-test. Data presented are the mean ± S.D. (n =3) of experiments performed in triplicate on three separate days.
While NEM and M2VP were not able to completely alkylate all protein thiols, we compared the ability of NEM and M2VP to prevent the oxidation of thiols to PSOH (Figure 2B). PSOH is derivatized with dimedone (DMD) to form an immunoreactive adduct (PS-DMD) recognized by antibodies 14, 27. Our data indicated that formation of PSOH residues occurs on proteins likely as a consequence of tissue preparation since no exogenous oxidants were added to generate PSOH residues. DMD reactivity was blocked by sodium arsenite, confirming that SOH residues were present and were reacting with DMD to form the immunoreactive adduct (not shown)14. Both M2VP and NEM potently prevented PSOH formation in homogenized liver samples (Figure 2B). However some NEM treated proteins had immunoreactivity towards the SOH/DMD antibody (Figure 2B). This cross reactivity may be the result of NEM and DMD both possessing cyclic diketone moieties.
S-Glutathionylation is recognized as a modulator of protein function. We hypothesized that similar to the increase in PSOH formation upon tissue homogenization, levels of PSSG would increase and that increases in PSSG content would be blocked by the thiol alkylators NEM and M2VP. In contrast to our hypothesis, our data indicated that NEM and M2VP increased the levels on PSSG on selective proteins (Figure 2C,D). This finding may be the result of GLRX activity cleaving the GSH residue from the target protein. The active site thiol residue of GLRX responsible for the cleavage of the GSH residue has a pKa of approximately 3.5, and thus GLRX may be active even in our acidic buffer system 23. Our data show that NEM and M2VP both inhibited GLRX activity in liver homogenates (Figure 2E).
In order to determine the degree to which levels of proteins with PSOH and PSSG were changed in obese animals, we utilized the obese-prone Sprague-Dawley rat 28-30. These rats became glucose intolerant, gained more total body weight, gained additional adipose, and gained significantly, but slightly, more lean body mass when fed a high-fat (45% fat derived calories from lard) diet versus a 10% fat calorie diet (Figure 3A-D). Our data are comparable to those by Louis and colleagues demonstrating that obese-prone Sprague-Dawley rats become hyperglycemic and insulinemic 28. Feeding data are provided in supplementary data S1.
Figure 3. Elevated fat intake causes glucose intolerance and increased adiposity.
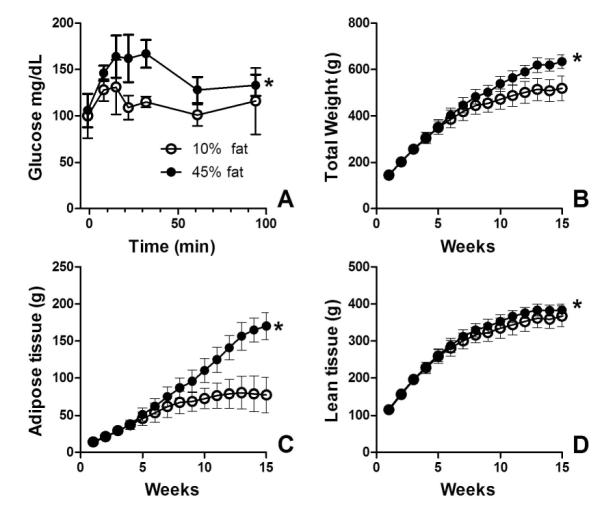
Obese-prone Sprague-Dawley rats were fed a 10% fat calorie or 45% fat calorie diet. (A) Rats fed the 45% fat calorie diet have higher plasma glucose levels than those fed a 10% fat calorie diet following oral glucose challenge. Higher fat intake induces yields a higher body mass (B) elevated adiposity (C) and elevated lean body mass (D). Data are the mean ± S.D.; n = 5. Data 10% fat calorie and 45% fat calorie groups were compared with two-way ANOVA. * p < 0.05 for fat effect.
From these animals, we analyzed liver, visceral (peri-renal) adipose tissue, and the gastrocnemius muscle (as a model skeletal muscle) as these tissues are relevant to the development of obesity and insulin resistance. We analyzed tissues for content of PSSG and PSOH by use of dot blot for total signal and western blot for analysis of specific proteins. We chose both methods as the dot blot would provide quantitative information and the western blot would provide information regarding protein masses.
We first analyzed PSSG content owing to data indicating that PSSG is regulated through formation and reversal. Content of PSSG was significantly reduced in the peri-renal adipose (26%) and liver (44%) of animals fed the 45% fat calorie diet compared to the 10% fat-fed animals (Figure 4). Western blot analyses of the samples demonstrated decreases in the intensity of GSH-modified proteins rather than changes protein targets. No changes in PSSG content or protein targets were observed in gastrocnemius muscle. Easily visualized proteins were abundant high molecular weight species; however, we recognize that changes in less abundant proteins may have occurred.
Figure 4. PSSG content is reduced in adipose and liver from obese rats.

Peri-renal adipose (A), liver (B), and skeletal muscle (C) were isolated from rats fed a 10% fat calorie diet or 45% fat calorie diet and analyzed for PSSG content by dot blot for total content (left panel) or by western blot for protein masses (right panel). Data are the mean ± S.D.; n = 5. Data 10% fat calorie and 45% fat calorie groups were compared with student’s t-test. * p < 0.05. 15 μg of protein (liver and gastrocnemius) and 10 μg of protein for adipose were loaded per lane for western blots.
PSOH is a precursor to PSSG, and thus PSOH content and PSOH-modified proteins were studied (Figure 5)16, 31, 32. No changes in total PSOH content by dot blot were observed in the tissues studied from 10% fat and 45% fat animals. There were no apparent changes in PSOH-modified targets in liver and muscle. There were differences in PSOH target proteins in adipose; however these differences were not consistent. Unlike PSSG, multiple proteins in all the tissues contained PSOH residues.
Figure 5. PSOH content is not altered by obesity.

Peri-renal adipose (A) , liver (B) and skeletal muscle (C) were isolated from rats fed a 10% fat calorie diet or 45% fat calorie diet and analyzed for PSOH content by dot blot for total content (left panel) or by western blot for protein masses (right panel). Data are the mean ± S.D.; n = 5. Data 10% fat calorie and 45% fat calorie groups were compared with student’s t-test. * p < 0.05. 15 μg of protein (liver and gastrocnemius) and 10 μg of protein for adipose were loaded per lane for western blots.
A decrease in the content PSSG proteins may be the result of a decrease in GSTP, or an increase in GLRX activity. Recent data indicate that GSTP is able to catalyze the formation of PSSG with PSOH and GSH as substrates16, 32. We tested the extent to which GSTP protein was altered by obesity. However, there was no difference between lean and obese animals in liver, peri-renal adipose, or gastrocnemius muscle (data not shown).
The decreases in PSSG may also be the result of elevated GLRX. We examined tissues for GLRX1 content owing to newer data implicating GLRX1 in inflammation and vascular dysfunction 11-13, 33-36 (Figure 6). A 70% increase in GLRX1 protein was observed in the peri-renal adipose tissue of obese rats compared to the lean controls (Figure 6A). No changes in GLRX1 were observed in liver from lean versus obese rats (Figure 6B). A single, 25 kD GLRX1 immunoreactive protein was observed in gastrocnemius muscle (not shown). While this immunoreactive protein did not change with diet, we are unsure as to its identity as GLRX1. Analysis of total GLRX activity in liver or gastrocnemius muscle demonstrated no obesity-induced changes (Figure 6C). GLRX activity was below the level of detection in peri-renal adipose under our assay conditions.
Figure 6. GLRX1 is elevated in visceral adipose of obese rats.

Peri-renal adipose, liver and gastrocnemius (Gastroc) muscle were isolated from rats fed a 10% fat calorie diet or 45% fat calorie diet and analyzed for GLRX1 protein content by western blot or total GLRX activity. Western blot and blot quantitations are shown for adipose (A) and liver (B). GLRX activity for liver and skeletal muscle are presented in (C). Note: GLRX activity in peri-renal adipose was below the limit of detection with the method used. Data are the mean ± S.D.; n = 5. Data 10% fat calorie and 45% fat calorie groups were compared with student’s t-test. * p < 0.05. 10μg of protein was loaded per lane for western blots. Recombinant GLRX1 (1 ng) was used for the adipocyte blot and 0.5 ng of GLRX1 for the liver blot.
We tested whether the decreases in PSSG content in liver and visceral adipose would be reflected by changes in GSH and GSSG content. However, there were no significant differences in GSH and GSSG content or GSH:GSSG ratios in liver or adipose between lean and obese animals (Table 1). However, there was a remarkable difference (approximately 10-fold) in the GSH:GSSG ratios when comparing liver to visceral adipose in either lean or obese animals.
Table 1.
GSH, GSSG, and GSH/GSSG in lean and obese rat liver and visceral adipose.
| Liver* | Peri-renal Adipose** | |||||
|---|---|---|---|---|---|---|
| 10% Fat | 45% Fat | 10% Fat | 45% Fat | |||
| Free GSH | Mean | 117.8 | 100.1 | Mean | 26.6 | 26.6 |
| SD | 17.8 | 9.0 | SD | 7.5 | 6.3 | |
| GSSG | Mean | 1.0 | 0.9 | Mean | 2.6 | 2.3 |
| SD | 0.1 | 0.1 | SD | 0.4 | 0.7 | |
| GSH/GSSG | Mean | 122.3 | 118.7 | Mean | 11.4† | 13.5† |
| SD | 7.4 | 14.4 | SD | 3.9 | 5.2 | |
Liver values are nmol/protein mg; n = 5 for each group
Adipose values are nmol/gram wet weight; n = 4 for each group
significantly (p < 0.05) different from corresponding liver value using Student’s t-test
Discussion
Obesity in humans is associated with increases in oxidative stress markers such as isoprostanes and protein-bounds carbonyls in adipose tissue1-4. On the other hand, data indicate adipocytic insulin resistance is the result of elevated GSH content in the adipocytes7. Whole animal studies indicate that depletion of GSH prevents obesity-induced insulin resistance 37. Thus, alterations in the redox state of protein thiols may play a role in adipose dysfunction. In this work, we tested the hypothesis that obesity induces tissue selective decreases in the content of proteins containing oxidized protein thiols, specifically those containing PSOH and PSSG, and residues. Our major findings are that decreases in S-glutathionylation of hepatic and adipose proteins occurred in obese versus lean rats and that elevated levels of GLRX1, which reverses S-glutathionylation, where found in the visceral adipose of obese rats.
Our current data show that levels of PSSG are reduced in the adipose and hepatic tissue from the obese, glucose-intolerant animals. These findings agree with several lines of evidence indicating that levels of oxidative modification of macromolecules are necessary for optimum insulin signaling. Mice over-expressing glutathione peroxidase-1 (GPX1; EC 1.11.1.9) have insulin resistance10. On the other hand GPX1 null animals have elevated insulin sensitivity in part owing to oxidative inactivation of the dual specificity phosphatase, phosphatase and tensin homolog (PTEN)9. Insulin signaling is compromised in 3T3-LI adipocytes when treated with GSH or its analogs, but insulin signaling is enhanced following GSH depletion with buthionine sulfoximine 7. While GSH depletion conceivably also reduces the formation of PSSG, it would not limit modification of protein cysteine residues to PSOH, precursors of PSSG (Figure 1) that also would reduce protein activity. GSH depletion through limitation of GPX1 activity would lead to elevated peroxides that catalyze PSOH formation.
Our observation that GLRX1 protein is elevated in adipose tissue of obese rats is novel. GLRX1 is a low molecular weight protein (approximately 11 kDa) of the glutaredoxin superfamily, of which many members are conserved from yeast to mammals and have different functions16, 18. GLRX1 is present in the cytosol and the intermembrane space of mitochondria and is highly selective towards reducing PSSG versus intra/intermolecular protein disulfides. While the factors regulating the tissue-specific expression of GLRX1 are unclear, it is evident that signaling pathways are activated in the obese adipose tissue that increase GLRX1 levels. Recent data indicate that GLRX1 activity can promote an inflammatory response. In this case, GLRX1 activity relieves the inhibition of NF-κB activity via activation of inhibitor of nuclear factor kappa-B kinase subunit β (IKKβ; EC 2.7.11.10). IKKβ is inhibited through the formation of a PSSG residue at amino acid Cys 179 34. Removal of GSH activates IKKβ that then subsequently phosphorylates NF-kappa-B inhibitor subunit beta (IK). Phosphorylation of NFKBI causes detachment of NFKBI from the NF-κB transcription factor complex thus allowing the NF-κB to enter the nucleus and stimulate tumor necrosis factor alpha (TNFα) and Interleukin-6 (IL6) 34. Other data indicate that NF-κB activation increases GLRX1 expression is a positive feed-forward manner12. The extent to which GLRX1 is expressed in the various cell types constituting adipose tissues needs further study.
Mechanisms leading to the formation of PSSG were studied. Recent data indicate that GSTP can catalyze the formation of PSSG by adding GSH onto PSOH32. However, there were no obesity-related changes in GSTP content in any of the tissues examined. In none of the tissues examined was the content of PSOH altered between lean and obese animals although there was at least one elevated PSOH in the lean adipose tissue compared to the obese tissue. This result is in contrast to elevations in protein carbonyls in adipose tissue as a result of obesity2.
The extent to which a decrease in PSSG may be beneficial or detrimental to cellular function is nuanced. S-glutathionylation of the mitochondrial respiratory proteins and uncoupling protein 2 (UCP2) inhibits the activities of these respective enzymes 38-40. Thus a decrease in S-glutathionylation in obesity may be viewed as an adaptive response to increase cellular energy metabolism. On the other hand, as described above, decreased S-glutathionylation of the NF-κB pathways components can lead to elevated inflammation.
Our data from liver indicate the GLRX1 is not the only determinant of PSSG tissue content since PSSG content was decreased without changes in GLRX1. We speculate that decreases in PSSG content could be the result of the presence of other GLRX family members or increases in thiol modifications by other species such as nitrosylation or carbonylation that are targeting the same protein bound thiols.
In summary, our data indicate that S-glutathionylation is reduced in the adipose and liver of obese animals with concomitant increase of GLRX1 in adipose. We are cognizant, however, that we have not performed a complete analysis of the oxidized thiol proteome. The extent to which S-glutathionylation regulates signaling pathways (for example insulin and inflammation) in adipose tissue needs further examination.
Supplementary Material
Supplementary Information Figure S1. Diet consumption data for the animals in the study
Acknowledgments
This publication and the use of the Core Synthesis Facility at North Dakota State University was made possible by NIH Grant Number P20 RR015566 from the National Center for Research Resources. Its contents are solely the responsibility of the authors and do not necessarily represent the official views of the NIH. We thank Dr. Irina Smoliakova, Department of Chemistry, University of North Dakota, for performing 1H-NMR analysis of M2VP. We thank Dr. John Mieyal for his advice on measurement of GLRX activity and providing recombinant human GLRX1. This work was funded by USDA 5450-51000-048-00D.
Footnotes
Disclosures There are no disclosures.
References
- 1.Brown LA, Kerr CJ, Whiting P, Finer N, McEneny J, Ashton T. Oxidant stress in healthy normal-weight, overweight, and obese individuals. Obesity (Silver Spring) 2009;17:460–6. doi: 10.1038/oby.2008.590. [DOI] [PubMed] [Google Scholar]
- 2.Frohnert BI, Sinaiko AR, Serrot FJ, et al. Increased adipose protein carbonylation in human obesity. Obesity (Silver Spring) 19:1735–41. doi: 10.1038/oby.2011.115. [DOI] [PMC free article] [PubMed] [Google Scholar]
- 3.Furukawa S, Fujita T, Shimabukuro M, et al. Increased oxidative stress in obesity and its impact on metabolic syndrome. J Clin Invest. 2004;114:1752–61. doi: 10.1172/JCI21625. [DOI] [PMC free article] [PubMed] [Google Scholar]
- 4.Gletsu-Miller N, Hansen JM, Jones DP, et al. Loss of total and visceral adipose tissue mass predicts decreases in oxidative stress after weight-loss surgery. Obesity (Silver Spring) 2009;17:439–46. doi: 10.1038/oby.2008.542. [DOI] [PMC free article] [PubMed] [Google Scholar]
- 5.Goldstein BJ, Mahadev K, Wu X, Zhu L, Motoshima H. Role of insulin-induced reactive oxygen species in the insulin signaling pathway. Antioxid Redox Signal. 2005;7:1021–31. doi: 10.1089/ars.2005.7.1021. [DOI] [PMC free article] [PubMed] [Google Scholar]
- 6.Wu X, Hardy VE, Joseph JI, et al. Protein-tyrosine phosphatase activity in human adipocytes is strongly correlated with insulin-stimulated glucose uptake and is a target of insulin-induced oxidative inhibition. Metabolism. 2003;52:705–12. doi: 10.1016/s0026-0495(03)00065-9. [DOI] [PubMed] [Google Scholar]
- 7.Kobayashi H, Matsuda M, Fukuhara A, Komuro R, Shimomura I. Dysregulated glutathione metabolism links to impaired insulin action in adipocytes. Am J Physiol Endocrinol Metab. 2009;296:E1326–E34. doi: 10.1152/ajpendo.90921.2008. [DOI] [PubMed] [Google Scholar]
- 8.Wang XD, Vatamaniuk MZ, Wang SK, Roneker CA, Simmons RA, Lei XG. Molecular mechanisms for hyperinsulinaemia induced by overproduction of selenium-dependent glutathione peroxidase-1 in mice. Diabetologia. 2008;51:1515–24. doi: 10.1007/s00125-008-1055-3. [DOI] [PubMed] [Google Scholar]
- 9.Loh K, Deng H, Fukushima A, et al. Reactive oxygen species enhance insulin sensitivity. Cell Metab. 2009;10:260–72. doi: 10.1016/j.cmet.2009.08.009. [DOI] [PMC free article] [PubMed] [Google Scholar]
- 10.McClung JP, Roneker CA, Mu W, et al. Development of insulin resistance and obesity in mice overexpressing cellular glutathione peroxidase. Proc Natl Acad Sci U S A. 2004;101:8852–7. doi: 10.1073/pnas.0308096101. [DOI] [PMC free article] [PubMed] [Google Scholar]
- 11.Aesif SW, Anathy V, Kuipers I, et al. Ablation of glutaredoxin-1 attenuates lipopolysaccharide-induced lung inflammation and alveolar macrophage activation. Am J Respir Cell Mol Biol. 2011;44:491–9. doi: 10.1165/rcmb.2009-0136OC. [DOI] [PMC free article] [PubMed] [Google Scholar]
- 12.Aesif SW, Kuipers I, van der Velden J, et al. Activation of the glutaredoxin-1 gene by nuclear factor kappaB enhances signaling. Free Radic Biol Med. 2011 doi: 10.1016/j.freeradbiomed.2011.06.025. [DOI] [PMC free article] [PubMed] [Google Scholar]
- 13.Shelton MD, Kern TS, Mieyal JJ. Glutaredoxin regulates nuclear factor kappa-B and intercellular adhesion molecule in Muller cells: model of diabetic retinopathy. J Biol Chem. 2007;282:12467–74. doi: 10.1074/jbc.M610863200. [DOI] [PubMed] [Google Scholar]
- 14.Charles RL, Schroder E, May G, et al. Protein sulfenation as a redox sensor: proteomics studies using a novel biotinylated dimedone analogue. Mol Cell Proteomics. 2007;6:1473–84. doi: 10.1074/mcp.M700065-MCP200. [DOI] [PubMed] [Google Scholar]
- 15.Groen A, Lemeer S, van der Wijk T, et al. Differential oxidation of protein-tyrosine phosphatases. J Biol Chem. 2005;280:10298–304. doi: 10.1074/jbc.M412424200. [DOI] [PubMed] [Google Scholar]
- 16.Gallogly MM, Mieyal JJ. Mechanisms of reversible protein glutathionylation in redox signaling and oxidative stress. Curr Opin Pharmacol. 2007;7:381–91. doi: 10.1016/j.coph.2007.06.003. [DOI] [PubMed] [Google Scholar]
- 17.Salmeen A, Andersen JN, Myers MP, et al. Redox regulation of protein tyrosine phosphatase 1B involves a sulphenyl-amide intermediate. Nature. 2003;423:769–73. doi: 10.1038/nature01680. [DOI] [PubMed] [Google Scholar]
- 18.Meyer Y, Buchanan BB, Vignols F, Reichheld JP. Thioredoxins and Glutaredoxins: Unifying Elements in Redox Biology. Annu Rev Genet. 2009 doi: 10.1146/annurev-genet-102108-134201. [DOI] [PubMed] [Google Scholar]
- 19.Uthus EO, Picklo MJ., Sr Obesity reduces methionine sulphoxide reductase activity in visceral adipose tissue. Free Radic Res. 2011;45:1052–60. doi: 10.3109/10715762.2011.591793. [DOI] [PubMed] [Google Scholar]
- 20.Nixon JP, Zhang M, Wang C, et al. Evaluation of a quantitative magnetic resonance imaging system for whole body composition analysis in rodents. Obesity (Silver Spring) 2010;18:1652–9. doi: 10.1038/oby.2009.471. [DOI] [PMC free article] [PubMed] [Google Scholar]
- 21.McGuinness OP, Ayala JE, Laughlin MR, Wasserman DH. NIH experiment in centralized mouse phenotyping: the Vanderbilt experience and recommendations for evaluating glucose homeostasis in the mouse. Am J Physiol Endocrinol Metab. 2009;297:E849–55. doi: 10.1152/ajpendo.90996.2008. [DOI] [PMC free article] [PubMed] [Google Scholar]
- 22.Boivin B, Zhang S, Arbiser JL, Zhang ZY, Tonks NK. A modified cysteinyl-labeling assay reveals reversible oxidation of protein tyrosine phosphatases in angiomyolipoma cells. Proc Natl Acad Sci U S A. 2008;105:9959–64. doi: 10.1073/pnas.0804336105. [DOI] [PMC free article] [PubMed] [Google Scholar]
- 23.Srinivasan U, Mieyal PA, Mieyal JJ. pH profiles indicative of rate-limiting nucleophilic displacement in thioltransferase catalysis. Biochemistry. 1997;36:3199–206. doi: 10.1021/bi962017t. [DOI] [PubMed] [Google Scholar]
- 24.Dringen R, Pfeiffer B, Hamprecht B. Synthesis of the antioxidant glutathione in neurons: supply by astrocytes of CysGly as precursor for neuronal glutathione. J Neurosci. 1999;19:562–9. doi: 10.1523/JNEUROSCI.19-02-00562.1999. [DOI] [PMC free article] [PubMed] [Google Scholar]
- 25.Lindorff-Larsen K, Winther JR. Thiol alkylation below neutral pH. Anal Biochem. 2000;286:308–10. doi: 10.1006/abio.2000.4807. [DOI] [PubMed] [Google Scholar]
- 26.Rogers LK, Leinweber BL, Smith CV. Detection of reversible protein thiol modifications in tissues. Anal Biochem. 2006;358:171–84. doi: 10.1016/j.ab.2006.08.020. [DOI] [PubMed] [Google Scholar]
- 27.Maller C, Schroder E, Eaton P. Glyceraldehyde 3-phosphate dehydrogenase is unlikely to mediate hydrogen peroxide signaling: studies with a novel anti-dimedone sulfenic acid antibody. Antioxid Redox Signal. 2011;14:49–60. doi: 10.1089/ars.2010.3149. [DOI] [PubMed] [Google Scholar]
- 28.Louis XL, Thandapilly SJ, Mohankumar SK, et al. Treatment with low-dose resveratrol reverses cardiac impairment in obese prone but not in obese resistant rats. J Nutr Biochem. 2011 doi: 10.1016/j.jnutbio.2011.06.010. [DOI] [PubMed] [Google Scholar]
- 29.Carroll JF, Zenebe WJ, Strange TB. Cardiovascular function in a rat model of diet-induced obesity. Hypertension. 2006;48:65–72. doi: 10.1161/01.HYP.0000224147.01024.77. [DOI] [PubMed] [Google Scholar]
- 30.Weigle DS, Levin BE. Defective dietary induction of uncoupling protein 3 in skeletal muscle of obesity-prone rats. Obes Res. 2000;8:385–91. doi: 10.1038/oby.2000.46. [DOI] [PubMed] [Google Scholar]
- 31.Rehder DS, Borges CR. Cysteine sulfenic acid as an intermediate in disulfide bond formation and nonenzymatic protein folding. Biochemistry. 2010;49:7748–55. doi: 10.1021/bi1008694. [DOI] [PMC free article] [PubMed] [Google Scholar]
- 32.Wetzelberger K, Baba SP, Thirunavukkarasu M, et al. Postischemic deactivation of cardiac aldose reductase: role of glutathione S-transferase P and glutaredoxin in regeneration of reduced thiols from sulfenic acids. J Biol Chem. 2010;285:26135–48. doi: 10.1074/jbc.M110.146423. [DOI] [PMC free article] [PubMed] [Google Scholar]
- 33.Bachschmid MM, Xu S, Maitland-Toolan KA, Ho YS, Cohen RA, Matsui R. Attenuated cardiovascular hypertrophy and oxidant generation in response to angiotensin II infusion in glutaredoxin-1 knockout mice. Free Radic Biol Med. 49:1221–9. doi: 10.1016/j.freeradbiomed.2010.07.005. [DOI] [PMC free article] [PubMed] [Google Scholar]
- 34.Reynaert NL, van der Vliet A, Guala AS, et al. Dynamic redox control of NF-kappaB through glutaredoxin-regulated S-glutathionylation of inhibitory kappaB kinase beta. Proc Natl Acad Sci U S A. 2006;103:13086–91. doi: 10.1073/pnas.0603290103. [DOI] [PMC free article] [PubMed] [Google Scholar]
- 35.Reynaert NL, Wouters EF, Janssen-Heininger YM. Modulation of glutaredoxin-1 expression in a mouse model of allergic airway disease. Am J Respir Cell Mol Biol. 2007;36:147–51. doi: 10.1165/rcmb.2006-0259RC. [DOI] [PMC free article] [PubMed] [Google Scholar]
- 36.Shelton MD, Mieyal JJ. Regulation by reversible S-glutathionylation: molecular targets implicated in inflammatory diseases. Mol Cells. 2008;25:332–46. [PMC free article] [PubMed] [Google Scholar]
- 37.Findeisen HM, Gizard F, Zhao Y, et al. Glutathione depletion prevents diet-induced obesity and enhances insulin sensitivity. Obesity (Silver Spring) 2011;19:2429–32. doi: 10.1038/oby.2011.298. [DOI] [PubMed] [Google Scholar]
- 38.Beer SM, Taylor ER, Brown SE, et al. Glutaredoxin 2 catalyzes the reversible oxidation and glutathionylation of mitochondrial membrane thiol proteins: implications for mitochondrial redox regulation and antioxidant DEFENSE. J Biol Chem. 2004;279:47939–51. doi: 10.1074/jbc.M408011200. [DOI] [PubMed] [Google Scholar]
- 39.Mailloux RJ, Seifert EL, Bouillaud F, Aguer C, Collins S, Harper ME. Glutathionylation acts as a control switch for uncoupling proteins UCP2 and UCP3. J Biol Chem. 2011;286:21865–75. doi: 10.1074/jbc.M111.240242. [DOI] [PMC free article] [PubMed] [Google Scholar]
- 40.Hurd TR, Requejo R, Filipovska A, et al. Complex I within oxidatively stressed bovine heart mitochondria is glutathionylated on Cys-531 and Cys-704 of the 75-kDa subunit: potential role of CYS residues in decreasing oxidative damage. J Biol Chem. 2008;283:24801–15. doi: 10.1074/jbc.M803432200. [DOI] [PMC free article] [PubMed] [Google Scholar]
Associated Data
This section collects any data citations, data availability statements, or supplementary materials included in this article.
Supplementary Materials
Supplementary Information Figure S1. Diet consumption data for the animals in the study