Abstract
Median nerve stimulation is a commonly used technique in the clinical setting to determine areas of neuronal function in the brain. Neuronal activity of repeated median nerve stimulation is well studied. The cerebral hemodynamic response of the stimulation, on the other hand, is not very clear. In this study, we investigate how cerebral hemodynamics behaves over time using the same repeated median nerve stimulation. Ten subjects received constant repeated electrical stimulation to the right median nerve. Each subject had fMRI scans while receiving said stimulations for seven runs. Our results show that the BOLD signal significantly decreases across each run. Significant BOLD signal decreases can also be seen within runs. These results are consistent with studies that have studied the hemodynamic habituation effect with other forms of stimulation. However, the results do not completely agree with the findings of studies where evoked potentials were examined. Thus, further inquiry of how evoked potentials and cerebral hemodynamics are coupled when using constant stimulations is needed.
Keywords: fMRI, median nerve stimulation, hemodynamic response, habituation
Introduction
Habituation is a decrease in an elicited behavior resulting from the repeated presentation of an eliciting stimulus. It has been of interest to many researchers. Functional neuroimaging studies of brain habituation have been performed for different brain systems and with various types of stimuli [1–9]. Habituation from repeated presentation of visual stimulations is characterized by a decrease of activity in the primary visual region and can occur in brief sessions [3]. Significant habituation has also been found in the primary auditory cortex with repeated presented auditory stimuli [4, 7]. Pain stimuli have been used in similar studies which have found the habituation effect to be present [1, 5]. Research involving motor stimulations has shown that the detected signal does decrease over time [2, 6, 8, 10]. Critically, these studies demonstrate that cerebral hemodynamic signals typically habituate over time when repeatedly presented with the same stimuli.
In tandem with the habituation studies of cerebral hemodynamic signals, habituation of evoked potential signals of the human brain has been also widely studied [10, 11, 12]. In particular, several research groups have carefully studied the habituation effects of electrical stimulation of the median nerve [13, 14]. It was reported by Thees et al. [12] that the overall signal strength of brain response in the motor and sensorimotor areas does not significantly change over a one-hour recording period, suggesting that the overall signal strength is not sensitive to habituation. However, there are also studies that have shown that habituation does affect particular peaks of the response waveform despite the overall signal strength being relatively constant [13, 14]. Such studies have shown that the N20 peak is susceptible to habituation effects. Ozkul et al. [13] reported a significant decrease in the N20 peak (14.4 ± 4.70%) over a period of four hundred stimulations among healthy volunteers. A similar study performed by Restuccia et al. [14] also reported a significant decrease in the amplitude of the N20 peak after three thousands stimulations. Unlike cerebral hemodynamic signals which typically habituate over various types of stimuli, evoked potential habituation is apparently more complex. The overall signal strength in the S1 region does not appear to be affected significantly by habituation [12], but the same may not be true for specific peaks (N20 for example) in the waveform [13, 14].
Cerebral hemodynamic responses with median nerve stimulation have also been reported [15–18]. These studies all utilized median nerve stimulation over a period of time and did show changes in the recorded Blood Oxygen Level Dependent (BOLD) signal in their results, but it should be noted that none of the studies had a specific focus on the habituation effect. The study performed by Arthurs et al. [15] focused on how attention may affect the measured BOLD signal. Ferretti et al. [17, 18] focused on how pain delivered with median nerve stimulation can affect the measured BOLD signal. Since these studies did not have habituation as the main focus, the stimulations delivered typically varied over time in some way (e.g., intensity, frequency). To investigate the habituation effects, the stimuli delivered would ideally be constant throughout the duration of the study. Backes et al. [16] performed a study that utilized constant stimuli, but the volunteers were asked to perform attention tasks (counting total number of interruptions in stimulations) during the study. It is possible that the measured BOLD signal reflects the task effects rather than possible habituation effects in such scenarios. Habituation has been studied using other forms of stimuli as previously mentioned, but cerebral hemodynamic habituation of median nerve stimulation has not yet been reported to the best of our knowledge.
Electrical stimulation of the median nerve has been commonly used in the clinical setting to identify the somatosensory and motor cortex with intra-operative direct cortical recordings [10, 11]. Direct cortical recordings are considered to be the gold standard in measuring evoked potentials because it provides spatially and temporally accurate information. The BOLD fMRI technique [19, 20] measures cerebral hemodynamic changes induced by neuronal activity of the brain. Combining direct cortical recordings with the BOLD technique offers a good opportunity to study the coupling between evoked potentials and cerebral hemodynamics [21, 22] as well as the behavior of coupling over repeated stimulations. As the first step, the presented study will investigate the hemodynamic habituation effects of the median nerve stimulation using fMRI. Follow-ups to this study would involve directly comparing cerebral hemodynamics (BOLD) with evoked potentials.
Methods
Subjects
Ten subjects (5 females, 5 males, age 22–32) gave informed written consent with the approval of the University of Iowa’s (USA) Institutional Review Board. All subjects reported that they were right-handed, not using medications at the time of scanning, healthy, and had no history of any mental or psychiatric conditions. All ten subjects were scanned at the University of Iowa’s Medical Education and Research Facility.
Stimulation Paradigm
Unilateral stimulations were delivered to the right median nerve using a Grass S8 stimulator (Grass Technologies, West Warwick, Rhode Island, USA). The stimulation voltage used during the fMRI scan was 15 volts above the motor threshold, which is individually defined as the minimum voltage required to obtain a thumb twitch. The delivered stimulations are square wave pulses with 0.2ms duration. A block design with four and a half off/on cycles (40 seconds off, 40 seconds on) was used with a randomized inter-stimulation interval (ISI) between 1.0–2.0 seconds. A randomized ISI was used to reduce any effect that expecting a stimulation occurring with a fixed inter stimulation interval might have on the resulting BOLD signal. The volunteers were asked to passively feel the stimulation, stay still, stay awake, and not actively perform anything else for the duration of the scan.
Data Acquisition
The MRI data was acquired on a Siemens 3T Trio scanner (Siemens Medical Solutions, Erlangen, Germany). A gradient echo EPI pulse sequence was used to acquire the BOLD fMRI images. The MRI parameters are as follows: TR = 2000ms, flip angle = 90 degrees, TE = 30ms, matrix = 64 × 64, FOV = 220mm, slice thickness = 5mm with 20% gap, 180 images per run. Each run was six minutes in length. Each scanning session was composed of seven of runs with the addition of a T1 anatomical scan with the following parameters: TR = 1590ms, flip angle = 10 degrees, TE = 3.39ms, matrix = 128 × 128, FOV = 220mm, slice thickness = 2mm.
Data Analysis
The MRI images were processed using Analysis of Functional NeuroImages (AFNI) [24]. Three-dimensional motion correction was performed to minimize motion effects. All images were normalized to Talairach space (www.bic.mni.mcgill.ca). As part of the normalization process, voxel sizes were changed to 2×2×2mm. Constant, linear, and quadratic trends were identified and removed. A Gaussian filter with full width half maximum of 4mm was used to smooth the images. A reference function was generated by using the hemodynamic response function convolved with the task function. Cross correlation analysis was performed to generate a statistic map using the generated reference function. The Fisher transform was used to convert correlation values to Z statistical values. A statistical threshold of Z = 3 (p = 0.0013, uncorrected) and a cluster size threshold of 240 mm3 was used to isolate areas of activations. These Z statistic maps were averaged together with their ten corresponding maps across subjects to produce an average statistic map per corresponding run in the scanning sequence.
Results
Inter-run habituation is shown in figure 1. The data was averaged across all ten subjects. The very first run showed significant activations in the left S1/M1 region of the brain with a statistical threshold of Z = 3 (p = 0.0013, uncorrected) and with a cluster size threshold of 240 mm3. No significant activations were observed in the remaining six runs.
Figure 1.
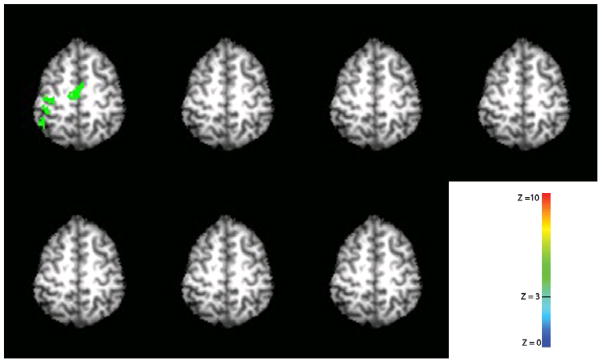
Inter-run habituation effect with median nerve stimulation. Only the very first run showed significant activation. Data was averaged across all ten subjects. A statistical threshold of Z = 3 (p = 0.0013, uncorrected) and a cluster size threshold of 240 mm3 was used to isolate activations. The right hemisphere is on the right and the left hemisphere is on the left.
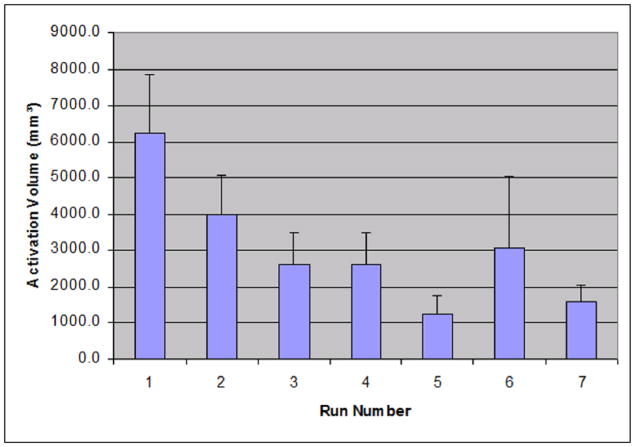
Figure 2 shows the individual average across runs of activation cluster volume that were found in the left M1/S1 area. Activations were isolated with a statistical threshold of Z = 3 and a cluster size threshold of 240 mm3. On average, the volume of activation clusters in the first scan is 6253.6 ± 5006.8 mm3. The second scan is 3988.8 ± 3473.7 mm3. The third scan has activations of 2621.6 ± 2762.7 mm3. The fourth scan has activations of 2602.4 ± 2768.5 mm3. The data shows a consistent rapid decrease in the cluster volumes of statistical significance (ANOVA, F = 2.59, p<0.05). It should be noted that run 6 appears to show an unusually high average volume when compared to runs 5 and 7. In the data, one subject showed an unusually large activation in run 6. This can explain why there is a sudden spike in the average; however, an ANOVA test shows that this sudden spike is not statistically significant when compared to runs 5 and 7 (F = 0.56, p>0.05).
Figure 2.
The average volume of activation for seven runs of data acquisition. The activation volumes were measured in the left M1/S1 area. The activation map was generated using a statistical threshold of Z = 3 and a volume threshold of 240 mm3. The individual activation volumes across all subjects were identified and averaged. The error bars represent one standard error.
Figure 3 shows the average percent change found in individual 3×3×3 voxel regions of interest in the left S1/M1 area of identified activations. A rapid decay in the average percent change can be seen. The first scan has an average percent change of 0.79%. The second scan has an average of 0.48%. The third scan’s average was 0.30%. The fourth scan’s average was 0.40%. This decay of average percent change is consistent with what is seen in figure 2 (decay in activation voxel size). ANOVA analysis showed that this decrease in percent change is statistically significant (F = 3.10, p<0.05).
Figure 3.
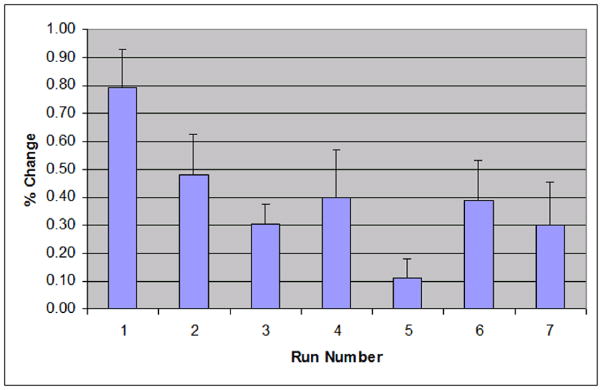
The average percent change in a 3×3×3 voxel region of interest in the S1/M1 area across 7 runs of all subjects. The error bars represent one standard error.
Figure 4 shows split-half analysis that was used to show intra-run habituation with average data across all ten subjects. The left image is processed with the first 2.5 cycles of the first run and shows significant activation in the M1/S1 regions on the left side of the brain. The right image is processed with the last 2.5 cycles of the first run and also shows that the activations have been detected in the M1/S1 region on the left side of the brain. The activation size of the right image is smaller than the activation size in the left image. As before, a statistical threshold of Z = 3 and a volume threshold of 240 mm3 was used.
Figure 4.
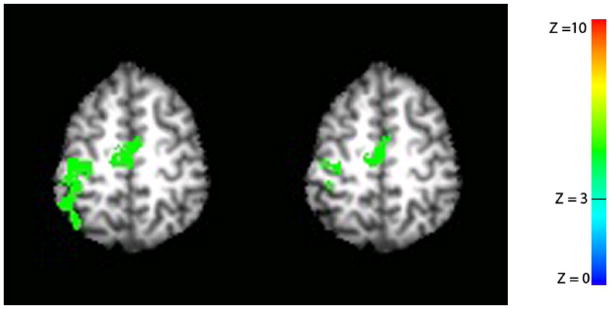
Split-half analysis was used to show intra-run habituation. Only the first run was used. The left image represents activation map processed with the first 2.5 cycle data of the first run. The right image is activation map processed with the last 2.5 cycle data of the first run. A statistical threshold of Z = 3 and a volume threshold of 240 mm3 was used. The right hemisphere is on the right and the left hemisphere is on the left.
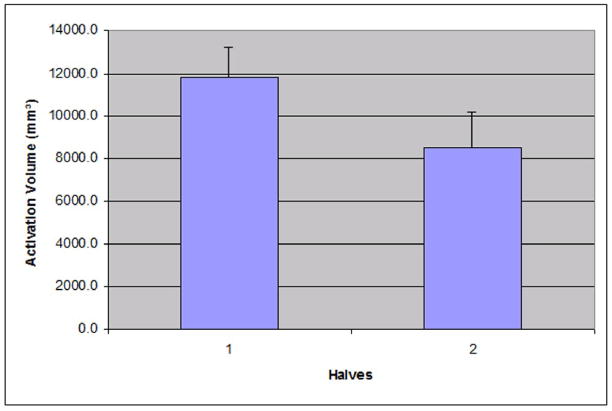
The average volume of activation clusters from individual half-runs found in M1/S1 from the split-half analysis is shown in Figure 5. A statistical threshold of Z = 3 and volume threshold of 240 mm3 was used. In the first 2.5 cycles, the average volume of activation clusters was 11807.2 ± 4439.7 mm3. The last 2.5 cycles had an average of 8533.6 ± 5284.9 mm3. Paired T-test shows that the volume of the first half is statistically larger than the volume of the second half (t = 2.22, p < 0.05).
Figure 5.
The average volume of activation clusters found in the first and last 2.5 cycles of scan 1 (figure 4). The activation volumes were measured in the left M1/S1 area. The error bars represent one standard error.
Discussion
Using median nerve stimulation and BOLD fMRI, we observed the hemodynamic habituation effect in our experiment. Our data showed that the habituation effect is quite severe between runs as only the first run showed a detectable activation on average. The data also shows that significant decay happens within the duration of the first scan that was performed in the series of seven. It would not be unreasonable to conclude that there is a strong habituation effect with cerebral hemodynamics associated with median nerve stimulation.
The habituation of cerebral hemodynamics found in our data are consistent with other types of stimulations such as visual, auditory, motor, and pain [1–9]. All these studies were designed to study the habituation effect, and they have reported decreases in signal in their findings after repeated stimulations over time. While the stimulation type varied across studies, hemodynamic habituation is a common finding. Our study using repeated median nerve stimulation over time also found hemodynamic habituation, which is consistent with the aforementioned studies.
Several other groups have studied median nerve stimulation using fMRI [15–18]. However, these studies were designed to investigate attention effects and other effects. They did not have a focus on hemodynamic habituation effects. Subjects performed different tasks during the studies and/or received magnitude varying-stimuli, which could potentially mask habituation. Results from such studies would likely be dominated by the main task effects of the different stimulation paradigms. None of these studies have specifically mentioned any habituation effect. Even if it were to be assumed that the habituation effects were not masked, none of these studies showed a change in recorded BOLD signal as severe as is seen in the presented results. The presented study used a constant and repeated stimulation with the volunteer passively feeling the stimulation. Severe habituation in the BOLD signal was observed. This would suggest that non-constant stimuli and tasks do in fact mask or minimize habituation effects, or cause enough differences that habituation does not occur. It may also be worth noting that it is not unreasonable to consider the possibility that the subjects’ attention to the stimuli could be in different states for the duration of the scan, thus the attention effect cannot be completely discounted as a contributor to the severe signal decrease seen in the presented data.
Since the BOLD signal is coupled to evoked potentials, measuring BOLD signal and neuronal activity concurrently offers an opportunity to study the coupling relationship. Janz et al. [24] examined this relationship using BOLD fMRI and Visual Evoked Potentials (VEP). Their fMRI results show a maximum signal change of 1.2 – 2.9% after approximately ten seconds. Their VEP results show a curve with a continuous decline that they state can be described with an exponential with a time constant of 14.7 ± 2.1 seconds. When comparing the VEP and BOLD signals, their conclusion states that the BOLD signal time course was not being accurately predicted with a linear model. The coupling between evoked potentials and hemodynamic response would appear to be rather complex, though Janz et al. themselves do not offer any particular insight into this relationship beyond what was already stated.
Unlike hemodynamic response which shows significant habituation across a wide range of stimuli [1–9], evoked potentials of the MNS over repeated stimulations is apparently not as simple. It has been reported that the overall signal strength of evoked potentials in the brain does not vary significantly over repeated median nerve stimulation, suggesting that habituation effects are not significant [12]. However there are also studies that have shown that specific peaks in the waveform (e.g., N20) are susceptible to severe habituation [13, 14]. This raises the question of how the cerebral hemodynamics is coupled with neuronal activity. One possible explanation is that cerebral hemodynamics is coupled to the overall signal strength of evoked potentials. If this is true, then the coupling relationship between cerebral hemodynamics and evoked potentials must decrease over repeated stimulations. Only if the coupling relationship decreases over time can it possibly explain the relationship of a constant evoked potentials and a decreased hemodynamic response for the repeated MNS as seen in the presented results. Another possible explanation is the cerebral hemodynamics are coupled to specific peaks of evoked potentials (e.g., N20) instead of the overall signal strength. As it is known that specific peaks can be susceptible to severe habituation, coupling cerebral hemodynamics with specific peaks would likely show a decrease in the detected activation if habituation were to occur, explaining the habituation observed in our results. It should be noted that comparable evoked potential data (e.g., same subjects, same stimuli, etc.) was not collected for the purpose of this study. As a result, this study is not able to differentiate which possible explanations for the phenomenon are more likely, or if there are other explanations (such as attention effects). Further investigations of the coupling between evoked potentials and cerebral hemodynamics as well as the behavior of coupling over repeated stimulations would be needed.
In summary, we have found severe habituation in BOLD signals when using median nerve stimulation. Between the seven runs performed, the habituation can be seen very quickly as activations were detected only in the first run on average. Within the first run, statistically significant BOLD signal decay was identified when using split-half analysis. The observed habituation is consistent with other studies that have focused on hemodynamic habituation using various types of stimulation. However, the results are not consistent with studies that have focused on evoked potentials with median nerve stimulation. The results do raise the question of how evoked potentials relates to cerebral hemodynamics when examined over a period of time with the presented scenario. It is possible that the coupling relationship between cerebral hemodynamics and evoked potentials decreases over time. Another possibility is that cerebral hemodynamics and evoked potentials are coupled with specific peaks within the electric waveform that are susceptible to severe habituation. As no evoked potential data was collected for this study, we are not able to determine which of these scenarios are more likely, or if there are other explanations for the phenomenon. Further investigations would be required to determine the underlying cause of the hemodynamic habituation seen in our results.
Acknowledgments
Role of funding source
Funding for this study was provided by National Institutes of Health (NIH) (R21 MH 082187-01, R01 DC004290-11). The NIH had no further role in study design, data collection, data analysis, data interpretation, the writing of this manuscript, or the decision to submit the manuscript for publication
Footnotes
Conflict of interest
None of the authors have any conflict of interest with regard to the findings presented in this manuscript, financial, or otherwise.
Publisher's Disclaimer: This is a PDF file of an unedited manuscript that has been accepted for publication. As a service to our customers we are providing this early version of the manuscript. The manuscript will undergo copyediting, typesetting, and review of the resulting proof before it is published in its final citable form. Please note that during the production process errors may be discovered which could affect the content, and all legal disclaimers that apply to the journal pertain.
References
- 1.Becerra LR, Breiter HC, Stojanovic M, Fishman S, Edwards A, Comite A, Gonzalez R, Borsook D. Human brain activation under controlled thermal stimulation and habituation to noxious heat: an fMRI study. Magn Reson Med. 1999;41:1044–1057. doi: 10.1002/(sici)1522-2594(199905)41:5<1044::aid-mrm25>3.0.co;2-m. [DOI] [PubMed] [Google Scholar]
- 2.Dirnberger G, Duregger C, Lindinger G, Lang W. Habituation in a simple repetitive motor task: a study with movement-related cortical potentials. Clin Neurophysiol. 2004;115:379–384. doi: 10.1016/s1388-2457(03)00328-6. [DOI] [PubMed] [Google Scholar]
- 3.Fischer H, Furmark T, Wik G, Fredrikson M. Brain representation of habituation to repeated complex visual stimulation studied with PET. NeuroReport. 2000;11:123–126. doi: 10.1097/00001756-200001170-00024. [DOI] [PubMed] [Google Scholar]
- 4.Pfeiderer B, Ostermann J, Michael N, Heindel W. Visualization of Auditory Habituation by fMRI. NeuroImage. 2002;17:1705–1710. doi: 10.1006/nimg.2002.1308. [DOI] [PubMed] [Google Scholar]
- 5.Mosbascher A, Brinkmeyer J, Warbrick T, Musso F, Schlemper V, Wittsack HJ, Saleh A, Schnitzler A, Winterer G. Brain activation patterns underlying fast habituation to painful laser stimuli. Int J Psychophysiol. 2010;75:16–24. doi: 10.1016/j.ijpsycho.2009.10.008. [DOI] [PubMed] [Google Scholar]
- 6.Seitz RJ, Roland PE. Learning of Sequential Finger Movements in Man: a Combined Kinematic and Positron emission Tomography (PET) Study. Eur J Neurosci. 1992;4:154–165. doi: 10.1111/j.1460-9568.1992.tb00862.x. [DOI] [PubMed] [Google Scholar]
- 7.Talavage TM, Edminster WB, Ledden PJ, Weisskoff RM. Quantitative Assessment of Auditory Cortex Responses Induced by Imager Acoustic Noise. Hum Brain Mapp. 1999;7:79–88. doi: 10.1002/(SICI)1097-0193(1999)7:2<79::AID-HBM1>3.0.CO;2-R. [DOI] [PMC free article] [PubMed] [Google Scholar]
- 8.Taylor MJ. Bereitschaftspotential During the Acquisition of a Skilled Motor Task. Electroencephalogr Clin Neurophysiol. 1978;45:568–576. doi: 10.1016/0013-4694(78)90157-8. [DOI] [PubMed] [Google Scholar]
- 9.Tomberg C, Desmedt KE, Ozaki I, Nguyen TH, Chalklin V. Mapping somatosensory evoked potentials to finger stimulation at intervals of 450 to 4000 msec and the issue of habituation when assessing early cognitive components. Electroencephalogr Clin Neurophysiol. 1989;74:347–358. doi: 10.1016/0168-5597(89)90002-6. [DOI] [PubMed] [Google Scholar]
- 10.Allison T, McCarthy G, Wood CC, Darcey TM, Spender DD, Williamson PD. Human cortical potentials evoked by stimulation of the median nerve. I. Cytoarchitectonic areas generating short-latency activity. J Neurophysiol. 1989;62:694–710. doi: 10.1152/jn.1989.62.3.694. [DOI] [PubMed] [Google Scholar]
- 11.Allison T, McCarthy G, Wood CC, Williamson PD, Spender DD. Human Cortical Potentials Evoked by Stimulation of the Median Nerve. II. Cytoarchitectonic Areas Generating Long-Latency Activity. J Neurophysiol. 1989;62:711–722. doi: 10.1152/jn.1989.62.3.711. [DOI] [PubMed] [Google Scholar]
- 12.Thees S, Blankenburg F, Taskin B, Curio G, Villringer A. Dipole source localization and fMRI of simultaneously recorded data applied to somatosensory categorization. NeuroImage. 2003;18:707–719. doi: 10.1016/s1053-8119(02)00054-x. [DOI] [PubMed] [Google Scholar]
- 13.Ozkul Y, Uckardes A. Median nerve somatosensory evoked potentials in migraine. Eur J Neurol. 2002;9:227–232. doi: 10.1046/j.1468-1331.2002.00387.x. [DOI] [PubMed] [Google Scholar]
- 14.Restuccia D, Piero ID, Martucci L, Zanini S. High-frequency oscillations after median-nerve stimulation do not undergo habituation: A new insight on their functional meaning? Clin Neurophysiol. 2011;122:148–152. doi: 10.1016/j.clinph.2010.06.008. [DOI] [PubMed] [Google Scholar]
- 15.Arthurs OJ, Johansen-Berg H, Matthews PM, Boniface SJ. Attention differentially modulates the coupling of fMRI BOLD and evoked potential signal amplitudes in the human somatosensory cortex. Exp Brain Res. 2004;157:269–274. doi: 10.1007/s00221-003-1827-4. [DOI] [PubMed] [Google Scholar]
- 16.Backes WH, Mess WH, Kranen-Mastenbroek V, Reulen JP. Somatosensory cortex responses to median nerve stimulation: fMRI effects of current amplitude and selective attention. Clin Neurophysiol. 2000;111:1738–1744. doi: 10.1016/s1388-2457(00)00420-x. [DOI] [PubMed] [Google Scholar]
- 17.Ferretti A, Babiloni C, Gratta C, Caulo M, Tartaro A, Bonomo L, Rossini PM, Romani GL. Functional topography of the secondary somatosensory cortex for nonpainful and painful stimuli: an fMRI study. NeuroImage. 2003;20:1625–1638. doi: 10.1016/j.neuroimage.2003.07.004. [DOI] [PubMed] [Google Scholar]
- 18.Ferretti A, Babiloni C, Arienzo D, Gratta C, Rossini RM, Tartaro A, Romani GL. Cortical Brain Responses during Passive Nonpainful Median Nerve Stimulation at Low Frequencies (0.5–4 Hz): An fMRI Study. Hum Brain Mapp. 2007;28:645–653. doi: 10.1002/hbm.20292. [DOI] [PMC free article] [PubMed] [Google Scholar]
- 19.Kwong K, Belliveau J, Chesler D, Goldberg I, Weisskoff R, Poncelet B, Kennedy D, Hoppel B, Cohen M, Turner R, Cheng HM, Brady T, Rosen B. Dynamic magnetic resonance imaging of human brain activity during primary sensory stimulation. Pro Natl Acad Sci USA. 1992;89:5675–5679. doi: 10.1073/pnas.89.12.5675. [DOI] [PMC free article] [PubMed] [Google Scholar]
- 20.Ogawa S, Lee TM, Kay AR, Tank DW. Brain magnetic resonance imaging with contrast dependent on blood oxygenation. Proc Natl Acad Sci USA. 1990;87:9868–9872. doi: 10.1073/pnas.87.24.9868. [DOI] [PMC free article] [PubMed] [Google Scholar]
- 21.Heeger DJ, Huk AC, Geisler WS, Albrecht DG. Spikes versus BOLD: what does neuroimaging tell us about neuronal activity? Nat Neurosci. 2000;3:631–633. doi: 10.1038/76572. [DOI] [PubMed] [Google Scholar]
- 22.Logothetis NK, Pauls J, Augath M, Trinath T, Oeltermann A. Neurophysiological investigation of the basis of the fMRI signal. Nature. 2001;412:150–157. doi: 10.1038/35084005. [DOI] [PubMed] [Google Scholar]
- 23.Cox RW. AFNI: Software for Analysis and Visualition of Functional Magnetic Resonance Neuroimages. Comput Biomed Res. 1996;29:162–173. doi: 10.1006/cbmr.1996.0014. [DOI] [PubMed] [Google Scholar]
- 24.Janz C, Heinrich SP, Kornmayer J, Bach M, Hennig J. Coupling of Neural Activity and BOLD fMRI Response: New Insights by Combination of fMRI and VEP Experiments in Transition From Single Events to Continuous Stimulation. Magn Reson Med. 2001;46:482–486. doi: 10.1002/mrm.1217. [DOI] [PubMed] [Google Scholar]


