

Abstract
Objective
To explore appetite-related hormones following stress in overweight individuals, and their interaction with Night Eating (NE) status.
Method
We measured plasma cortisol and ghrelin concentrations, and recorded ratings of stress and hunger in response to a physiological laboratory stressor (Cold Pressor Test, CPT) in overweight women with (n=11; NE) and without (n=17; non-NE) night eating.
Results
Following the CPT, cortisol (p < .001) and ghrelin (p < .05) levels increased, as did stress and hunger ratings (all p < .001), across all subjects (NE and non-NE). NE exhibited higher baseline cortisol (p < .05) levels than non-NE. NE also had greater cortisol area under the curve (AUC) than non-NE (p = .019), but not when controlling for baseline cortisol levels. Ghrelin baseline and AUC did not differ between groups. NE showed higher AUC stress (p < .05), even when controlling for baseline stress.
Discussion
Overweight individuals showed increased cortisol, ghrelin, stress and hunger following a laboratory stressor, and there was some evidence for greater increases in cortisol and subjective stress among NE. The greater AUC cortisol in NE was due to higher baseline levels but the group difference in stress was in direct response to the CPT stressor. Our results support a role for cortisol and stress in Night Eating.
Keywords: eating disorders, HPA axis, sleep, circadian, appetite hormones, gut peptides
1. Introduction
Obesity is usually the result of a prolonged state of energy imbalance from excessive food intake. The eating behaviors that lead to the imbalance, however, may differ widely among individuals. One behavioral phenotype gaining increasing attention is the Night Eating Syndrome (NES), which is characterized by a cluster of behaviors and symptoms, including evening hyperphagia, awakenings from sleep to eat, morning anorexia, and sleep disturbances.1 Individuals with NES report sleep onset and waking times similar to those without NES, suggesting NES does not represent a disordered biological rhythm that encompasses sleep, but instead a dissociation between the circadian pattern of eating and sleep.
The prevalence of NES has been estimated at 1.5% in the general population,2 9–15% among obese treatment-seekers,3 and 28% among severely obese individuals considering bariatric surgery.2 Longitudinal evidence4 and cross-sectional comparisons between obese and lean individuals with NES5 suggest that night eating is not only more common in obese people, but may also precede the development of obesity, implicating night-time eating as a potential behavioral path to weight gain.6
Little is known about the origins of the dysregulated eating patterns in NES. However, life stress has been linked to binge eating,7, 8 and bulimia nervosa (BN) patients show increases in both desire to binge eat and hunger following interpersonal stress, whereas restrained eaters and normal controls show no increase.9 Stress may also play a role in NES, which often develops during periods of life stress10 and remits when stress is alleviated.11, 12
The effect of stress on food intake in these eating disorders may be mediated partly by the stress hormone cortisol, which is secreted in response to stress, and may increase intake of high-energy “comfort” foods, possibly contributing to the development of obesity in both humans13 and animals.14, 15 For example, Koo-Loeb et al. (2000)found that after an interpersonal speech task, 24-hour urinary cortisol as well as heart rate and blood pressure reactivity were higher in women with BN than women without BN.16 In our lab, we observed a heightened cortisol response to a physiological stressor in obese women with Binge Eating Disorder (BED)17 compared with obese controls.
Although primarily known for its role in increasing food intake, the gut peptide hormone ghrelin may also play a role in the stress response and lead to stress-induced eating. Ghrelin is dysregulated in binge eaters18, 19 and obese individuals,20 and ghrelin may also be responsive to stress. For example, one study reported increased ghrelin in rats following acute water avoidance stress,21 while another reported increased ghrelin in humans in response to a social stressor.22
Night eaters appear to have elevated levels of cortisol throughout a 24 h period, especially from 8 am through 2 am,23 although in another study there were no differences. 10 There have not been any studies, however, on the cortisol or ghrelin response to a laboratory stressor in night eaters.
We administered a laboratory stress test to women with and without night eating, and obtained ratings of stress and hunger. To investigate whether the effects of stress could be attributed to cortisol rather than to a more generalized psychological reaction, we used a predominantly physiological stressor, the Cold Pressor Test, which has been shown to raise cortisol more reliably than psychological stressors.24 Since the stressful events contributing to accumulation of cortisol and consequent nighttime eating are more likely to happen in the day than at night, we conducted the test in the afternoon, when most participants would be at work and/or engaged in their daily routine. To avoid body weight differences confounding cortisol differences between groups,25,26 we recruited only overweight women. Our first aim was to test whether there would be greater cortisol, ghrelin, stress and hunger following a laboratory stressor in an overweight sample. Our second aim was to test whether overall and baseline cortisol levels would be higher among the NE group. A third aim was to test associations between hormonal responses (cortisol, ghrelin) and subjective ratings (stress, hunger).
2. Methods
2.1 Participants
Overweight (BMI > 27 kg/m2) women were recruited through local advertisements. During an initial telephone interview, candidates were screened to exclude those with significant health problems, including gastrointestinal, heart, kidney, or liver disease, or cancer, hypertension, or diabetes. Additional exclusion criteria included pregnancy or lactation, Raynaud’s disease (extreme peripheral sensitivity to cold), unstable body weight (± 5%) over the past 3 mo, dieting currently or over the past 3 months, smoking, use of most prescribed medications (especially those affecting body weight, e.g. antidepressants, stimulants), substance abuse or dependence within the past 6 mo, or previous hospitalization for psychiatric illness. A physical examination, including medical history, ECG, and blood tests, was conducted to ensure good health other than obesity, and oral contraceptive use was documented. The study was conducted at St. Luke’s-Roosevelt Hospital and the protocol and consent form were approved by the St. Luke’s-Roosevelt Hospital IRB.
On the day of screening, participants completed the Night Eating Diagnostic Questionnaire (NEDQ), a 21-item self-report instrument for assessing NES including nocturnal eating.27 Eleven participants were classified as Night Eaters (NE). Of these 11, 10 reported eating more than 50% of their daily food intake after 7 pm, and 4 reported awakenings from sleep to eat at night, with 3 reporting both. As this was an older version of the NEDQ, the current provisional diagnostic criteria, including consuming 25% of daily food intake after dinner1 were not applied in the current study. Other related behaviors included difficulty falling or staying asleep (n = 11), morning anorexia (n = 9) or eating breakfast on ≤ 3 d/week (n = 7). Another 17 participants reported no late evening or night-time eating behaviors (non-NE).
2.2 Procedures
2.2.1 Anthropometrics and body composition
Following an overnight 12-h fast, a technician in the Body Composition Lab measured height and weight, to obtain BMI, and waist circumference as an index of central adiposity. Percentage of body fat was assessed by underwater weighing (Precision Biomedical Systems) to obtain water displacement in order to calculate body volume and density.28 The technician was blind to participants’ night eating status.
2.2.2 Cold Pressor Test (CPT)
On a separate day (main test day), participants arrived at the hospital following a 12-hour overnight fast. Self-reported time of last meal was 7:01 pm ± 1:31 SD, with no significant difference between NE and non-NE groups. Menstrual cycle (number of days from start of menstruation) was recorded since menstrual status might affect cortisol responses to laboratory stress.29 An IV catheter was inserted into a forearm vein of the non-dominant arm. Following blood draws and consumption of a fixed nutritionally complete liquid meal (600 ml/1254 kcal Boost, Mead Johnson) as part of a another protocol, the participants rested for two hours, and then the CPT was conducted at 12:23 pm ± 1:24 SD. The participant immersed the non-dominant hand up to the wrist in a rectangular shaped container of 0° C ice-water for 2 min. A strainer bag with ice was kept in the water to prevent a rise in temperature. Blood was drawn at −10 and 0 min for baseline measures, at 2 min corresponding to hand withdrawal, and at 5, 15, 30, 45, and 60 min following hand submersion. Participants rated stress and hunger on a visual analogue scale (VAS) from 0 (not at all) to 100 (extremely) immediately before each blood draw. Digital monitors were used to assess diastolic blood pressure, systolic blood pressure and heart rate confirm the occurrence of a stress response.
Blood samples for ghrelin were collected in tubes containing EDTA and aprotinin (Trasylol), kept on ice, and then cold centrifuged for 15 min to obtain plasma, which was stored at −70 C° until assayed. Total cortisol was measured with a radioimmunoassay (RIA) kit from Diagnostic System Labs (intra-assay CV = 2.8; inter-assay = 4.8), and total ghrelin was measured with an RIA kit from Phoenix (intra-assay CV = 2.7, inter-assay CV = 3.2).
2.2.3 Data analyses
Sample characteristics were compared between groups (NE vs. non-NE) using univariate ANOVAs and two-tailed t-tests for continuous variables, and Chi-square (χ2) tests for categorical variables. Missing CPT data were obtained by interpolating between adjacent time-points, or by carrying forward the last value if the final value was missing, and Area Under the Curve (AUC) was calculated for cortisol, ghrelin, and VAS ratings, using the trapezoidal method.
Repeated measures ANOVAs were used to test for change in cortisol, ghrelin, stress and hunger across all subjects. Post-hoc tests, conducted only where there was a significant main effect, examined differences between each of the outcome values and the baseline; averaged (i.e., mean of −10 and 0 min) baseline values were used to give the most representative estimate of the baseline period.
To test for overall group differences between NE and non-NE, we conducted univariate ANOVAs comparing AUC for each outcome; AUC was considered the most appropriate index for group comparisons because cumulative absolute levels of cortisol, ghrelin, stress or hunger in response to day-time stressors are likely to be the most salient predictors of evening eating episodes.8, 30, 31 To test for baseline differences between NE and non-NE we conducted independent t-tests, also using averaged baseline values. Finally to test whether group differences were attributable to baseline differences or to overall output following stress, we used univariate ANOVA to test for AUC differences with and without controlling for the initial (i.e. −10 min) baseline value (averaged baseline could not be used because the area between −10 and 0 min is contributes to the AUC).
As a secondary test of differences in response magnitude, we also compared peak values for each outcome with and without controlling for averaged baseline. For peak cortisol and ghrelin we took the highest value attained > 2 min, to allow for the time course of these hormone responses. For peak stress and hunger, we took the highest value attained after withdrawal (i.e., at 2 min or thereafter). Finally, Pearson correlations (r) were used to test correlations between hormone indices and VAS ratings (averaged baseline, AUC, and peak values) within the whole sample.
All results are presented as mean ± SD in Tables and mean ± SEM in Figures, with two-tailed p < .05 required for statistical significance and p ≤ .06 for trends. Data were analyzed using the Statistical Package for the Social Sciences (SPSS, Chicago, IL).
3. Results
3.1 Participant characteristics
Participants were 29.7 y ± 7.8 SD with a BMI of 35.5 kg/m2 ± 4.6 SD, a waist circumference of 100.9 cm ± 11.2 SD, and 40.8 % ± 5.2 SD body fat (from underwater weighing). Twenty-four women (9 NE, 15 non-NE) were obese (BMI ≥ 30) and 4 (2 NE, 2 non-NE) were overweight (BMI = 27–30). Menstrual phase on the day of testing was available for 19 women (7 NE, 12 Non-NE; χ2 [1,28] = 0.1, p = .51). Of these, 8 were in the follicular phase and 11 in the luteal phase. Only 4 women (2 NE, 2 non-NE) used oral contraceptives, and the proportion of use did not differ by NE status (χ2 [1,28] = 0.2, p = .64). Since none of these variables differed by NE status, they were not included as covariates in further analyses.
3.2 Responses to CPT
3.2.1 Change in cortisol, ghrelin, stress, and hunger following CPT
Cortisol
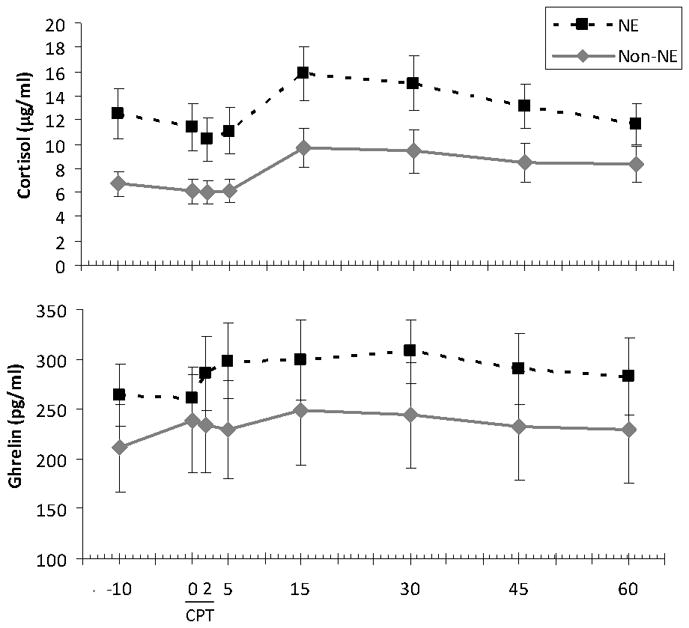
Repeated measures ANOVA revealed that cortisol levels changed significantly following CPT (F[7,182] = 10.0, p < .001) (Fig 1a). Post-hoc analyses comparing each value with baseline showed that 2 min values were lower than baseline, and 15 and 30 min values higher than baseline (all p< .05).
Figure 1.

Hormones in relation to Cold Pressor Test in Night Eaters (NE) and non-Night Eaters (non-NE). (a) Cortisol (μg/ml), mean ± SEM, in response to CPT. b) Ghrelin (pg/ml), mean ± SEM, in response to CPT.
Ghrelin
Ghrelin levels increased significantly following CPT (F[7,105] = 2.2, p = .038) (Fig 1b). Post-hoc analyses showed that values at 5 and 15 min were significantly higher than baseline (all p< .05).
Stress
Stress ratings also increased following CPT (F[7,182] = 35.5, p < .001) (Fig 2a), with post-hoc analyses revealing significantly higher levels at 2 and 5 min (all p< .05).
Figure 2.
Visual Analog Scale (VAS) ratings in relation to Cold Pressor Test in Night Eaters (NE) and non-Night Eaters (non-NE). (a) VAS stress (0 – 100 mm), mean ± SEM, in response to CPT by NE status. (b) VAS hunger (0 – 100 mm), mean ± SEM, in response to CPT by NE status.
Hunger
Hunger ratings increased towards the end of the CPT testing period (F[7,182] = 12.0, p < .001) (Fig 2b), such that levels at 30, 45 and 60 min were higher than baseline (all p< .05).
3.2.2 Baseline cortisol, ghrelin, stress, and hunger in NE vs. non-NE
NE participants had greater baseline cortisol than Non-NE (t[26] = 2.7, p = .013). There were no differences in baseline ghrelin, stress, or hunger by NE group.
3.2.3 AUC and peak cortisol, ghrelin, stress, and hunger following CPT in NE vs. non-NE
Cortisol
NE participants had greater AUC cortisol than non-NE (F[1,26] = 5.2, p = .031). This difference became non-significant when controlling for baseline (F[1,25] = 0.01, p = .91). There was a trend towards higher peak cortisol in NE (F[1,26] = 3.9, p = .058), but not after controlling for baseline (F[1,25] = 0.001, p = .97) (Table 1).
Table 1.
AUC and peak (mean ± SD) values for hormones and VAS ratings in relation to Cold Pressor Test (CPT) in Night Eaters (NE) and non-Night Eaters (non-NE)
| NE | Non-NE | |
|---|---|---|
| Cortisol | ||
|
| ||
| Baseline a (μg/ml) | 12.0 ± 6.4 | 6.4 ± 4.2* |
| AUC b (μg/ml * min) | 937.4 ± 431.1 | 575.7 ± 393.9* |
| Peak c (μg/ml) | 17.0 ± 7.9 | 11.2 ± 7.4† |
|
| ||
| Ghrelin | ||
|
| ||
| Baseline (μg/ml) | 262 ± 73 | 215 ± 139 |
| AUC (pg/ml * min) | 20376 ± 5790 | 16545 ± 11532 |
| Peak (pg/ml) | 355 ± 111 | 263 ± 169 |
|
| ||
| Stress | ||
|
| ||
| Baseline | 19.5 ± 19.3 | 16.5 ± 16.9 |
| AUC (mm * min) | 1923 ± 1682 | 1019 ± 786 |
| Peak | 80.0 ± 21.7 | 59.1 ± 29.0† |
|
| ||
| Hunger | ||
|
| ||
| Baseline | 31.4 ± 22.6 | 28.5 ± 23.0 |
| AUC (mm * min) | 2454 ± 2126 | 2453 ± 1579 |
| Peak | 47.7 ± 33.0 | 48.1 ± 28.5 |
Baseline = averaged (mean of −10 and 0 min) value;
AUC = Area Under the Curve;
Peak = highest value post 0 min;
Significant (p < .05) difference between groups in unadjusted analyses;
Marginal (p < .06) difference between groups in unadjusted analyses.
Ghrelin
AUC ghrelin did not differ between NE and non-NE either before (F[1,15] = 0.65, p = .43) or after controlling for baseline (F[1,14] = 0.3, p = .57). Peak ghrelin values also did not differ between the groups either before (F[1,15] = 1.6, p = .23) or after controlling for baseline (F[1,14] = 1.6, p = .23) (Table 1).
Stress
NE showed significantly higher AUC stress levels after controlling for baseline (F[1,25] = 5.8, p = .023), but not before doing so (F[1,26] = 3.7, p = .065). There was a marginal group difference in peak stress between groups both before (F[1,26] = 4.2, p = .051) and after controlling for baseline (F[1,25] = 4.0, p = .056), such that stress was higher for NE (Table 1).
Hunger
NE and Non-NE groups did not differ in AUC hunger (F[1,26] < 0.001, p = .999), and this result was unchanged by controlling for baseline (F[1,25] = 0.14, p = .71). There were no group differences in peak hunger either before (F[1,26] = 0.001, p = .98) or after controlling for baseline (F[1,25] = 0.1, p = .76) (Table 1).
3.2.4 Correlations between hormone indices and VAS ratings
Pearson’s correlations were conducted between baseline, AUC, and peak values forcortisol, ghrelin, stress and hunger. Peak cortisol was positively correlated with AUC hunger (r=0.38, p=.049) (Fig 3), but there were no significant relationships between cortisol and stress. There were no significant relationships between ghrelin and either of the VAS indices, or between cortisol and ghrelin indices (all p >0.05).
Figure 3.
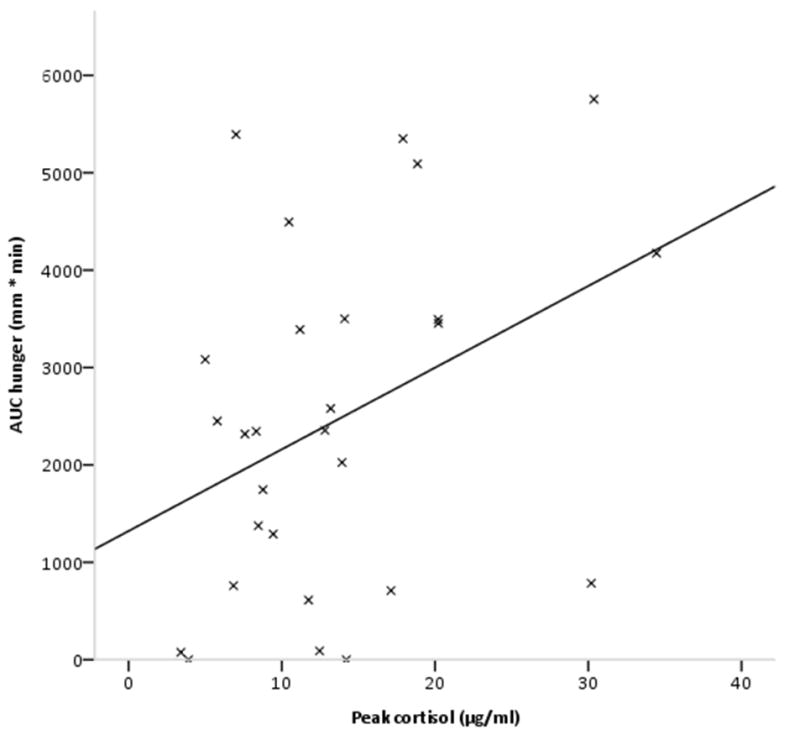
Scatterplot showing relationship between peak cortisol and AUC hunger, with regression line (r=0.38, p< .05).
4. Discussion
This is the first study to examine hormonal and psychological responses to a laboratory stressor, in overweight individuals with and without Night Eating. We observed significant increases in cortisol, ghrelin, stress and hunger following the CPT across all subjects. We also observed greater baseline and overall (AUC) cortisol in NE as compared to non-NE, as well as significantly larger overall (AUC) stress after adjusting for baseline values.
Our observations of increased cortisol across groups are consistent with other studies (e.g.24), and reflect the efficacy of the Cold Pressor Test. The group difference in overall cortisol output following stress also suggests a role for this stress hormone in night eating, although the higher baseline levels, and the absence of the relationship when controlling for the baseline, suggests that NE is associated with increased baseline cortisol, rather than alterations in the stress response per se. The finding that cortisol in NE shows the normal pattern of a typical stress-induced increase on top of levels which are already elevated is important, though, since overall cortisol levels could have an impact on intake, as well as on metabolic health and weight.37 One plausible interpretation is that cortisol, which accumulates in response to day-time stress, acts to trigger eating episodes at night, thus helping to maintain the disordered eating and sleep profile observed in NE.
The absence of a group difference in ghrelin may have been due to already low ghrelin levels in these overweight and obese participants, resulting from long-term down-regulation,20 and making it more difficult to obtain a differential effect. Assaying total rather than active ghrelin may also have obscured the effect, although total and active estimates are highly correlated.38
The higher AUC stress ratings (and the trend for higher peak stress ratings) that we observed in the NE group even after controlling for baseline are consistent with greater acute subjective stress rather than higher tonic levels. The results for AUC cortisol and AUC stress vary in so far as the AUC cortisol results support a group difference in basal and overall cortisol, while the AUC stress responses support a difference in acute stress-related increases. Thus, the pattern of higher cortisol in NE may be more pervasive, while differences in psychological responses to stress may be more short-term.
It is unclear why, consistent with other investigators,39, 40 we did not find correlations between indices of cortisol and subjective stress, or between indices of ghrelin and subjective hunger. This may have been due to a time lag between hormonal and psychological responses,41 although time-lagged correlations (not reported) did not support this. The time-lagged approach may be more revealing when assessments are made at equal intervals rather than at the uneven time-points in this study.
It is possible that that a direct measure of food intake would have been more sensitive to variations in stress and hormone levels. For example, one study found that women who showed a large cortisol response to cognitivestress consumed significantly more food than those with a smaller response.42 However, consistent with evidence for a relationship between cortisol and food intake,13–15, 43 overall cortisol levels were associated with overall levels of hunger across groups suggesting that the AUC measures were sensitive enough to detect this relationship.
CPT was used rather than a social stressor24 because CPT more consistently induces a rise in cortisol. However, since night eating by definition occurs in the evening, administering the CPT in the evening might have enhanced the observed differences between groups. To thoroughly test the hypothesis that cumulative cortisol and stress leads to increased hunger and night eating, it would also be helpful to obtain free-living measurements for a longer time period, including evening and night. Other limitations of this study include a relatively small sample size, and the absence of a no-stress control condition. However, the significant sympathetic response to the CPT that we observed here (details not reported) and in other studies17 indicates that the stress manipulation was effective.
5. Conclusion
In summary, this study provided evidence for greater baseline cortisol levels, and greater cortisol AUC following a physiological stressor among overweight women, and particularly among those with night eating. The AUC cortisol difference was apparently driven by higher baseline levels, but the subjective stress difference in response to a laboratory stressor was indicative of greater acute increases among night eaters. These findings are broadly supportive of the hypothesis that elevated baseline and stress-related cortisol could act as maintaining factors for night eating, an increasingly common route to obesity.
Acknowledgments
The authors would like to thank Sami A. Hashim, MD for medical supervision; Margarita Lorence for assistance; and Ku-Yu (Virginia) Chang and Leora Benson for help with manuscript preparation. Support was provided in part by NIH grants R01 DK 54318, R01 DK 074046 (A.G), K99 088360 (S.C.), DK 07559 (M.G.) and MO1 RROO64529 (Columbia University GCRC). Anthropometrics and UWW results were provided by the Body Composition Lab, and cortisol and ghrelin assays were provided by the Hormone-Metabolite Lab, core service labs of the New York Obesity Center, DK 26687.
Footnotes
Conflict of interest
The authors declare no conflict of interest.
References
- 1.Allison KC, Lundgren JD, Reardon JP, Geliebter A, Gluck ME, Vinai P, et al. Proposed Diagnosed Criteria for Night Eating Syndrome. International Journal of Eating Disorders. 2010;43:6. doi: 10.1002/eat.20693. [DOI] [PMC free article] [PubMed] [Google Scholar]
- 2.Rand CS, Macgregor AM, Stunkard AJ. The night eating syndrome in the general population and among postoperative obesity surgery patients. Int J Eat Disord. 1997;22 (1):65–9. doi: 10.1002/(sici)1098-108x(199707)22:1<65::aid-eat8>3.0.co;2-0. [DOI] [PubMed] [Google Scholar]
- 3.Gluck ME, Geliebter A, Satov T. Night eating syndrome is associated with depression, low self-esteem, reduced daytime hunger, and less weight loss in obese outpatients 2001. Obes Res. 9(4):264–267. doi: 10.1038/oby.2001.31. [DOI] [PubMed] [Google Scholar]
- 4.Thompson OM, Ballew C, Resnicow K, Gillespie C, Must A, Bandini LG, et al. Dietary pattern as a predictor of change in BMI z-score among girls. Int J Obes (Lond) 2006;30 (1):176–82. doi: 10.1038/sj.ijo.0803072. [DOI] [PubMed] [Google Scholar]
- 5.Marshall HM, Allison KC, O’Reardon JP, Birketvedt G, Stunkard AJ. Night eating syndrome among nonobese persons. Int J Eat Disord. 2004;35(2):217–22. doi: 10.1002/eat.10241. [DOI] [PubMed] [Google Scholar]
- 6.Andersen GS, Stunkard AJ, Sorensen TI, Petersen L, Heitmann BL. Night eating and weight change in middle-aged men and women. Int J Obes Relat Metab Disord. 2004;28 (10):1338–43. doi: 10.1038/sj.ijo.0802731. [DOI] [PubMed] [Google Scholar]
- 7.Pike KM, Wilfley D, Hilbert A, Fairburn CG, Dohm FA, Striegel-Moore RH. Antecedent life events of binge-eating disorder. Psychiatry Res. 2006;142(1):19–29. doi: 10.1016/j.psychres.2005.10.006. [DOI] [PMC free article] [PubMed] [Google Scholar]
- 8.Crowther JH, Sanftner J, Bonifazi DZ, Shepherd KL. The role of daily hassles in binge eating. Int J Eat Disord. 2001;29(4):449–54. doi: 10.1002/eat.1041. [DOI] [PubMed] [Google Scholar]
- 9.Tuschen-Caffier B, Vogele C. Psychological and physiological reactivity to stress: an experimental study on bulimic patients, restrained eaters and controls. Psychother Psychosom. 1999;68(6):333–40. doi: 10.1159/000012352. [DOI] [PubMed] [Google Scholar]
- 10.Allison KC, Ahima RS, O’Reardon JP, Dinges DF, Sharma V, Cummings DE, et al. Neuroendocrine profiles associated with energy intake, sleep, and stress in the night eating syndrome. J Clin Endocrinol Metab. 2005;90(11):6214–7. doi: 10.1210/jc.2005-1018. [DOI] [PubMed] [Google Scholar]
- 11.Stunkard A, Birketvedt GS. Night eating and nosology. Int J Obes Relat Metab Disord. 2002;26(4):588. doi: 10.1038/sj.ijo.0801818. [DOI] [PubMed] [Google Scholar]
- 12.Pawlow LA, O’Neil PM, Malcolm RJ. Night eating syndrome: effects of brief relaxation training on stress, mood, hunger, and eating patterns. Int J Obes Relat Metab Disord. 2003;27(8):970–8. doi: 10.1038/sj.ijo.0802320. [DOI] [PubMed] [Google Scholar]
- 13.George SA, Khan S, Briggs H, Abelson JL. CRH-stimulated cortisol release and food intake in healthy, non-obese adults. Psychoneuroendocrinology. 2009 doi: 10.1016/j.psyneuen.2009.09.017. [DOI] [PMC free article] [PubMed] [Google Scholar]
- 14.Bray GA. Autonomic and endocrine factors in the regulation of food intake. Brain Res Bull. 1985;14(6):505–10. doi: 10.1016/0361-9230(85)90098-x. [DOI] [PubMed] [Google Scholar]
- 15.Dallman M. Fast glucocorticoid favors ‘the munchies.’. Trends Endocrinol Metab. 2003;14 (9):394–6. doi: 10.1016/j.tem.2003.09.005. [DOI] [PubMed] [Google Scholar]
- 16.Koo-Loeb J, Costello N, Light K, Girdler S. Women with eatigng disorder tendencies display altered cardiovascular, neuroendocrine, and psychosocial profiles. Psychosomatic Medicine. 2000;62(4):10. doi: 10.1097/00006842-200007000-00013. [DOI] [PubMed] [Google Scholar]
- 17.Gluck M, Geliebter A, Hung J, Yahav E. Cortisol, hunger, and desire to binge eat following a cold stress test in obese women with binge eating disorder. Psychosomatic Medicine. 2004;66(6):6. doi: 10.1097/01.psy.0000143637.63508.47. [DOI] [PubMed] [Google Scholar]
- 18.Geliebter A, Gluck ME, Hashim SA. Plasma ghrelin concentrations are lower in binge-eating disorder. J Nutr. 2005;135(5):1326–30. doi: 10.1093/jn/135.5.1326. [DOI] [PubMed] [Google Scholar]
- 19.Monteleone P, Fabrazzo M, Tortorella A, Martiadis V, Serritella C, Maj M. Circulating ghrelin is decreased in non-obese and obese women with binge eating disorder as well as in obese non-binge eating women, but not in patients with bulimia nervosa. Psychoneuroendocrinology. 2005;30(3):243–50. doi: 10.1016/j.psyneuen.2004.07.004. [DOI] [PubMed] [Google Scholar]
- 20.Tschop M, Weyer C, Tataranni PA, Devanarayan V, Ravussin E, Heiman ML. Circulating ghrelin levels are decreased in human obesity. Diabetes. 2001;50(4):707–9. doi: 10.2337/diabetes.50.4.707. [DOI] [PubMed] [Google Scholar]
- 21.Kristensson E, Sundqvist M, Hakanson R, Lindstrom E. High gastrin cell activity and low ghrelin cell activity in high-anxiety Wistar Kyoto rats. J Endocrinol. 2007;193(2):245–50. doi: 10.1677/JOE-07-0028. [DOI] [PubMed] [Google Scholar]
- 22.Rouach V, Bloch M, Rosenberg N, Gilad S, Limor R, Stern N, et al. The acute ghrelin response to a psychological stress challenge does not predict the post-stress urge to eat. Psychoneuroendocrinology. 2007;32(6):693–702. doi: 10.1016/j.psyneuen.2007.04.010. [DOI] [PubMed] [Google Scholar]
- 23.Birketvedt GS, Florholmen J, Sundsfjord J, Osterud B, Dinges D, Bilker W, et al. Behavioral and neuroendocrine characteristics of the night-eating syndrome. JAMA. 1999;282(7):657–63. doi: 10.1001/jama.282.7.657. [DOI] [PubMed] [Google Scholar]
- 24.Schwabe L, Haddad L, Schachinger H. HPA axis activation by a scoially evaluated cold-pressor test. Psychoneuroendocrimology. 2008;33(6):6. doi: 10.1016/j.psyneuen.2008.03.001. [DOI] [PubMed] [Google Scholar]
- 25.Steptoe A, Kunz-Ebrecht SR, Brydon L, Wardle J. Central adiposity and cortisol responses to waking in middle-aged men and women. Int J Obes Relat Metab Disord. 2004;28(9):1168–73. doi: 10.1038/sj.ijo.0802715. [DOI] [PubMed] [Google Scholar]
- 26.Steptoe A, Wardle J. Cardiovascular stress responsivity, body mass and abdominal adiposity. Int J Obes (Lond) 2005;29(11):1329–37. doi: 10.1038/sj.ijo.0803011. [DOI] [PubMed] [Google Scholar]
- 27.Gluck ME, Geliebter A, Satov T. Night eating syndrome is associated with depression, low self-esteem, reduced daytime hunger, and less weight loss in obese outpatients. Obes Res. 2001;9(4):264–7. doi: 10.1038/oby.2001.31. [DOI] [PubMed] [Google Scholar]
- 28.Dempster P, Aitkens S. A new air displacement method for the determination of human body composition. Med Sci Sports Exerc. 1995;27(12):1692–7. [PubMed] [Google Scholar]
- 29.Lustyk MK, Olson KC, Gerrish WG, Holder A, Widman L. Psychophysiological and neuroendocrine responses to laboratory stressors in women: Implications of menstrual cycle phase and stressor type. Biol Psychol. 2009 doi: 10.1016/j.biopsycho.2009.11.003. [DOI] [PubMed] [Google Scholar]
- 30.Newman E, O’Connor DB, Conner M. Daily hassles and eating behaviour: the role of cortisol reactivity status. Psychoneuroendocrinology. 2007;32(2):125–32. doi: 10.1016/j.psyneuen.2006.11.006. [DOI] [PubMed] [Google Scholar]
- 31.O’Connor DB, Jones F, Conner M, McMillan B, Ferguson E. Effects of daily hassles and eating style on eating behavior. Health Psychol. 2008;27(1 Suppl):S20–31. doi: 10.1037/0278-6133.27.1.S20. [DOI] [PubMed] [Google Scholar]
- 32.Diz-Chaves Y. Ghrelin, appetite regulation, and food reward: interaction with chronic stress. Int J Pept. 2011;2011:898450. doi: 10.1155/2011/898450. [DOI] [PMC free article] [PubMed] [Google Scholar]
- 33.Currie PJ, Khelemsky R, Rigsbee EM, Dono LM, Coiro CD, Chapman CD, et al. Ghrelin is an orexigenic peptide and elicits anxiety-like behaviors following administration into discrete regions of the hypothalamus. Behav Brain Res. 2012;226(1):96–105. doi: 10.1016/j.bbr.2011.08.037. [DOI] [PMC free article] [PubMed] [Google Scholar]
- 34.Stengel A, Wang L, Tache Y. Stress-related alterations of acyl and desacyl ghrelin circulating levels: Mechanisms and functional implications. Peptides. 2011;32(11):2208–17. doi: 10.1016/j.peptides.2011.07.002. [DOI] [PMC free article] [PubMed] [Google Scholar]
- 35.Chuang JC, Perello M, Sakata I, Osborne-Lawrence S, Savitt JM, Lutter M, et al. Ghrelin mediates stress-induced food-reward behavior in mice. J Clin Invest. 2011;121(7):2684–92. doi: 10.1172/JCI57660. [DOI] [PMC free article] [PubMed] [Google Scholar]
- 36.Lambert E, Lambert G, Ika-Sari C, Dawood T, Lee K, Chopra R, et al. Ghrelin modulates sympathetic nervous system activity and stress response in lean and overweight men. Hypertension. 2011;58(1):43–50. doi: 10.1161/HYPERTENSIONAHA.111.171025. [DOI] [PubMed] [Google Scholar]
- 37.Bose M, Olivan B, Laferrere B. Stress and obesity: the role of the hypothalamic-pituitary-adrenal axis in metabolic disease. Curr Opin Endocrinol Diabetes Obes. 2009;16(5):340–6. doi: 10.1097/MED.0b013e32832fa137. [DOI] [PMC free article] [PubMed] [Google Scholar]
- 38.Marzullo P, Verti B, Savia G, Walker GE, Guzzaloni G, Tagliaferri M, et al. The relationship between active ghrelin levels and human obesity involves alterations in resting energy expenditure. J Clin Endocrinol Metab. 2004;89(2):936–9. doi: 10.1210/jc.2003-031328. [DOI] [PubMed] [Google Scholar]
- 39.Al’Absi M, Bongard S, Buchanan T, Pincomb GA, Licinio J, Lovallo WR. Cardiovascular and neuroendocrine adjustment to public speaking and mental arithmetic stressors. Psychophysiology. 1997;34(3):266–75. doi: 10.1111/j.1469-8986.1997.tb02397.x. [DOI] [PubMed] [Google Scholar]
- 40.Buchanan TW, al’Absi M, Lovallo WR. Cortisol fluctuates with increases and decreases in negative affect. Psychoneuroendocrinology. 1999;24(2):227–41. doi: 10.1016/s0306-4530(98)00078-x. [DOI] [PubMed] [Google Scholar]
- 41.Schlotz W, Kumsta R, Layes I, Entringer S, Jones A, Wust S. Covariance between psychological and endocrine responses to pharmacological challenge and psychosocial stress: a question of timing. Psychosom Med. 2008;70(7):787–96. doi: 10.1097/PSY.0b013e3181810658. [DOI] [PubMed] [Google Scholar]
- 42.Epel E, Lapidus R, McEwen B, Brownell K. Stress may add bite to appetitie in women: a laboratory study of stress-induced cortisol and eating behavior. Psychoneuroendocrimology. 2001;26(1):13. doi: 10.1016/s0306-4530(00)00035-4. [DOI] [PubMed] [Google Scholar]
- 43.Tataranni P, Larson D, Snitker S, Young J, Flatt J, Ravussin E. Effects of glucocorticoids on energy metabolism and food intake in humans. Am J Physiol. 1996;271(2 Pt 1):9. doi: 10.1152/ajpendo.1996.271.2.E317. [DOI] [PubMed] [Google Scholar]