

Fibromyalgia (FMS) is a chronic pain and fatigue syndrome (Dadabhoy et al., 2008) that affects 3 to 6 million adults in the United States (NIAMS, 2009). It is one of the most common conditions seen in rheumatology clinics worldwide, including the U.S. FMS is characterized by widespread pain and tenderness on examination, accompanied by somatic symptoms such as fatigue, and psychological symptoms such as depression. Functional consequences of this constellation of symptoms may include non-restorative sleep and diminished functional capacity (Clauw, 2009). With the annual expenditures for the diagnosis and treatment of FMS at approximately $14 billion in the U.S. alone, FMS presents a substantial burden to individuals, families, and society (Wallace, 2006).
Although the etiology of FMS remains unclear, a prominent theory is that FMS is associated with immunologic perturbations that lead to complex neuroendocrine aberrations of the hypothalamic-pituitary-adrenal (HPA) axis (Arnold, 2010; Mease et al., 2007). An imbalance of cytokines, key inflammatory mediators, and increased levels of C-reactive protein (CRP), a non-specific marker of systematic inflammation, have been associated with symptoms of fatigue, pain and depression in multiple conditions (Abeles et al., 2007; Uceyler et al., 2006; Gür & Oktagolu, 2008; Wallace, 2006). This symptom profile mimics the representative symptoms of FMS. Thus, it is theoretically plausible that these inflammatory mediators may also contribute to the symptoms of fatigue, pain and depression in FMS (Schmidt-Wilcke & Clauw, 2011). However, results to date examining the association of immune activation as measured by levels of peripheral cytokines with FMS and its symptoms have been inconsistent (Menzies & Lyon, 2010; Menzies et al., 2011; Üçeyler, Häuser & Sommer, 2011). Methodological issues such as discrepant sampling techniques, use of different assays and different media (serum, plasma, stimulated cells), and focus on only one aspect of the cytokine network (pro- or anti-inflammatory cytokines), may have contributed to inconsistent results across studies, indicating the need for further, well-defined and theoretically based research examining levels of cytokines in FMS (Üçeyler et al., 2011).
Stress, a psychophysiological state that occurs as a result of the body responding to real or imagined threats, is considered a risk factor for the onset and the modulation of pain in FMS (IOM, 2011; Schmidt-Wilcke & Clauw, 2011) and increased levels of stress may contribute to immune activation. Chronic stress may lead to dysregulated neuroimmune or neuroendocrine response resulting in physiologic consequences such as hyperarousal or fatigue, centrally mediated increases in pain and compromised immune function (McCarberg, 2011). Guided imagery is a dynamic, psychophysiological modality in which a person imagines and experiences an internal reality in the absence of external stimuli (Menzies & Taylor, 2004). When used as a clinical intervention, guided imagery has been shown to decrease levels of perceived stress and anxiety, improve physical function, as well as to enhance a sense of self-efficacy for managing symptoms related to chronic pain conditions (Jallo et al., 2008; Menzies et al., 2006). Further, because the symptoms of FMS may be worsened by stress and negative psychological processes (Clauw, 2009), mind-body modalities that decrease perceived stress such as guided imagery may contribute to a reduction of FMS symptoms (Buckelew et al, 1996).
Cognitive interventions such as guided imagery encourage patients to take responsibility for managing their pain and disabilities and to attribute their coping successes to their own efforts, therefore enhancing their sense of self-efficacy (Bradley, 1989). Efficacy expectations refer to the belief that one can competently cope with a challenging situation and has the ability to affect behavior (Bandura, 1977). Individuals with higher self-efficacy in regard to controlling their FMS symptoms have reported reduced levels of pain, less functional impairment and improved self-efficacy for pain and functional status, when compared to those with lower self-efficacy (Bennet & McCain, 1995; Buckelew et al., 1998). Self-efficacy has been noted to serve as an important linking mechanism between psychological and physiological functioning (Bandura, 1992) and has been identified as a predictor of disease severity (Buckelew et al., 1998).
The biobehavioral framework guiding this study (Figure 1) was adapted from a psychoneuroimmunology (PNI) model developed by McCain et al. (2005). This biobehavioral framework is specifically concerned with the mechanisms of multidimensional psycho-behavioral-neuroendocrine-immune system interactions. A major goal of PNI research is to determine associative relationships among stress, immune function, and overall health status. Our theoretical model assumes that perceived self-efficacy and perceived stress are modifiable factors that may contribute to symptom management as well as immune function and, hence, may affect both psychological and physiological health outcomes. To date, however, research in FMS has not examined the effect of guided imagery on the psychological factors of self-efficacy and perceived stress that may contribute to fatigue, pain, depression and associated patterns of immune activation. Given the preliminary evidence that the immune perturbations of FMS may be heightened by stress, particularly the stress related to managing the symptoms of FMS, there is theoretical justification to examine whether a mind/body modality such as GI may enhance outcomes in FMS. Therefore the purpose of this study was to investigate the effects of guided imagery on self-efficacy, perceived stress, and biobehavioral factors in women diagnosed with FMS.
Figure 1.
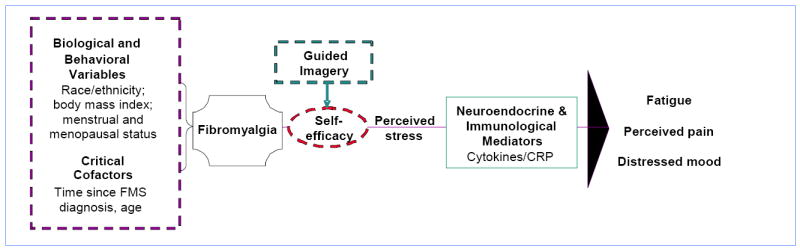
Conceptual Framework: Effects of Guided Imagery on Biobehavioral Factors in Women with Fibromyalgia
Materials and Methods
Study design
This study used a two-group pre-test post-test randomized experimental design to examine the effectiveness of guided imagery, as an adjunctive modality, on self-reported self-efficacy, levels of perceived stress, and selected biobehavioral factors in women with FMS. Biobehavioral factors included symptoms (fatigue, pain, and depression) and immune biomarkers (cytokines and C-reactive protein [CRP]).
Participants
Participants were recruited using brochures and flyers placed in physician’s offices and ambulatory care clinics affiliated with the Virginia Commonwealth University Health System. Inclusion criteria included age ≥18, female, diagnosis of FMS, no known major psychiatric or neurological conditions that would interfere with study participation, and ability to understand and sign the consent form and complete the study questionnaires. Criteria for diagnosis of FMS were based on the 1990 American College of Rheumatology criteria (Wolfe et al., 1990). Exclusion criteria included presence of other systemic rheumatologic conditions, history of epilepsy, presence of any psychiatric disorder involving a history of psychosis, being immune-compromised (e.g., HIV/AIDS), receiving corticosteroid treatments, or being pregnant. Self-reported diagnosis of FMS was confirmed by the participant’s primary physician or rheumatologist.
A total of 189 potential participants were assessed for eligibility. From the 189, 105 individuals met inclusion criteria. Of these 105, 33 individuals were eligible but chose not to participate; a total of 72 women diagnosed with FMS were enrolled after completing the informed consent process (Figure 2). The study protocol was approved by the Institutional Review Board (IRB) of Virginia Commonwealth University.
Figure 2.
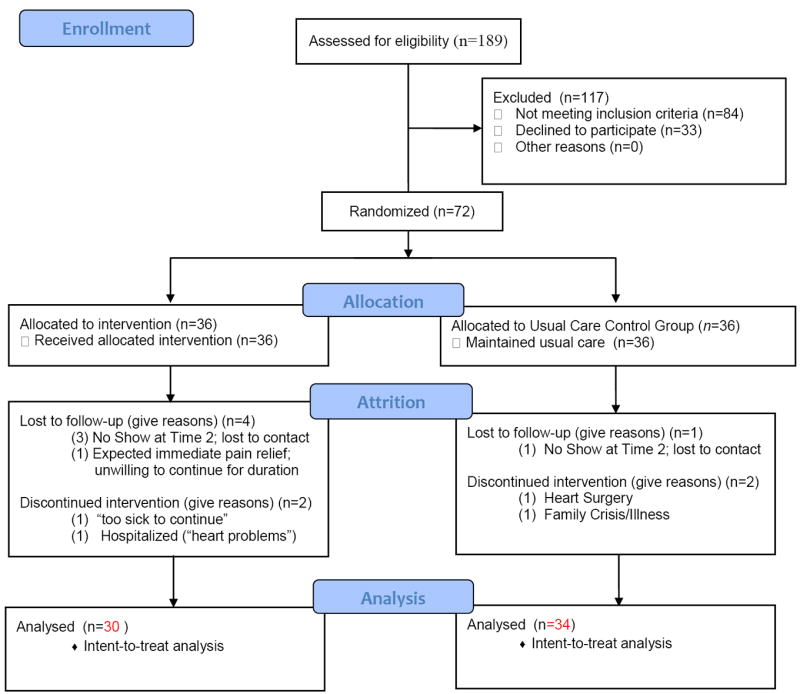
Flow Diagram of the Enrollment and Randomization of Women Diagnosed with Fibromyalgia*
*Schulz, K. F., Altman, D. G., Moher, D., for the CONSORT Group. (2010). CONSORT 2010 statement: Updated guidelines for reporting parallel group randomised trials. British Medical Journal, 340, c. 322.
After consent, enrollment, completion of baseline questionnaires, and collection of a 3 cc peripheral venous blood sample for biomarker analysis (cytokine and CRP levels), study participants were randomized with equal probabilities into Usual Care plus Guided Imagery (UC+GI) or Usual Care (UC) groups. Study participants assigned to the UC group were asked to maintain their current care practices in managing FMS symptoms. All participants were asked not to initiate any new treatments, if possible, for the duration of their 10-week participation. To control for intra-individual variability of measures, including circadian variability, participants were scheduled to return for their week 6 and week 10 study visits at the same time of day as their baseline study visit so that individual subject data were collected as closely as possible to the same time points across the study interval.
Intervention
The intervention used by study participants in the UC+GI group consisted of listening to three audio-recorded guided imagery scripts, formatted as three separate tracks on one CD. Each track was 20 minutes in length. Participants were instructed to use the CD tracks in 2-week increments and in consecutive order for the first 6 weeks of the study; then to use the tracks in any order for follow-up weeks 7 through 10. Participants were instructed to use the CD tracks as frequently as they wished, but they were requested to use them at least once daily throughout the 10-week study period. Participants maintained a daily written log of their use of the CD tracks. The first track of the 3-track intervention series was a basic relaxation entrainment script, intended to promote familiarity with imagery. It included instructions for guided relaxation to release tension, and encouraged an overall sense of wellbeing. Participants were instructed to listen at least daily for two weeks to the first track (study weeks 1 and 2). The second track of the intervention series was a pleasant scene imagery script, instructing listeners to imagine they felt better and better within a pleasant scene of their own choosing. In this imagined place of feeling better and better, participants were encouraged to become familiar with the surroundings of their imagery (elicit sensory involvement), imagine themselves in a place of safety and security where it was possible to rest fully and completely, and emerge from their imagery with a sense of feeling refreshed and rejuvenated. Participants were instructed to use the second CD track daily for two weeks (weeks 3 and 4). The third track of the intervention series guided the participant on an imaginary journey through their immune system. The imagery script suggested ‘this is an imaginary journey through your immune system….your immune system has but one mission… to provide your body with enhanced wellness….imagine now that your immune system is doing what it does best… and knowing how to do it well…” The goal of the imagery was to bring participants to the end state of living with enhanced wellness (end state imagery). Participants were instructed to use the third track daily for two weeks (weeks 5 and 6). Each script contained cues to facilitate symptom improvement and to promote wellbeing; for example, “feeling better and better”; “feeling relaxed and refreshed”. To assess for adherence to the intervention, participants in the UC+GI group reported use of the intervention in daily logs provided for them at the initial measurement session. All study participants received a weekly phone call to ask if they had any questions about the study and if they were following the study protocol. An additional comment was included for the week prior to each scheduled study visit, reminding participants of the date and time for their week 6 visit and for their week 10 visit. Each phone call ended with a thank you for participating in this study.
Measures
Self-efficacy
Self-efficacy was measured by the Arthritis Self-Efficacy Scale (ASES) (Lorig et al., 1989), which measures persons’ beliefs in their abilities to manage specific behaviors related to health status. The 6-item measure of self-efficacy for managing other symptoms (OSE), a subscale of the ASES, was used in the data analysis. The OSE subscale was adapted for FMS by replacing the word “arthritis” with the word “FMS” in previous research (Menzies et al., 2006). The OSE subscale assesses participants’ abilities to manage FMS symptoms, including fatigue, pain, and mood. Scores range from 10 to 100, with higher scores indicating greater self-efficacy. Reliability and validity of the ASES have been reported (Buckelew et al, 1998; Lorig, et al, 1989). In this study, coefficient alpha for the OSE, overall, was 0.87, with item level alphas ranging from 0.83 to 0.86.
Perceived stress
Perceived stress was measured using the Perceived Stress Scale (PSS) (Cohen & Williamson, 1988). The 10-item PSS measures the degree to which situations in an individual’s life are appraised as stressful. The 10 questions are general in nature, with respondents indicating how often each statement applied to them during the past month. The PSS is a widely used general measurement of perceived stress and has accrued considerable reliability and validity data since inception with internal consistency alphas at 0.85 and reliability at 0.87. In this study, the PSS coefficient alpha was 0.91.
Demographic co-factors
Age, time since FMS diagnosis, body mass index (BMI) and menopausal status were considered co-factors in the research model. Age and time since FMS diagnosis were measured in years. BMI is a measure of body fat based on height and weight.
Biobehavioral Factors: Symptoms
Fatigue
Fatigue was measured by the Brief Fatigue Inventory (BFI) (Mendoza et al., 1999), a 9-item self-report measure that assesses the severity of fatigue and interference in daily functioning over the past week. Severe fatigue is defined as a score of 7 or higher. The BFI has demonstrated excellent reliability in clinical trials, ranging from 0.82 to 0.97 (M. D. Anderson Cancer Center Pain Research Group, 2009a). In this study, the BFI coefficient alpha was 0.90.
Pain
Pain was measured using The Brief Pain Inventory (BPI) Short form (Cleeland, 1989). The BPI assesses pain severity (BPI-S) and pain interference (BPI-I) and uses 0 to 10 numeric scales for item rating; higher scores indicate increased pain/interference. Participants were asked to rate pain within the past 24 hours. In widespread testing, the Cronbach’s alpha reliability ranges from 0.71 to 0.91 (M. D. Anderson Cancer Center Pain Research Group, 2009b). In this study, the BPI-S coefficient alpha was 0.91. For the BPI-I, Cronbach’s alpha was 0.94.
Depression
Depression was measured using the Center for Epidemiological Studies-Depression (CES-D) scale (Radloff, 1977), a widely used, psychometrically sound instrument designed to detect depressive symptoms in the general population. In this study, the CES-D coefficient alpha was 0.92. The CES-D is comprised of 20 items reflecting the domains of depressive affect, somatic symptoms, positive effect, and interpersonal relations. Participants were asked to report the extent to which they experienced each symptom within the previous week. A score of 16 or greater indicated a higher level of depression.
Biobehavioral Factors: Immune Biomarkers
For purposes of measuring cytokine levels and CRP, 3 ml blood samples were collected at baseline, week 6 and week 10 (3 time points). Blood samples were collected into heparinized vacutainer tubes for measuring biomarkers. Plasma samples were cryopreserved and batch-processed to reduce inter-assay variability. Plasma levels of interferon-gamma (IFN-γ), tumor necrosis factor-alpha (TNF-α), interleukin (IL)-1β, IL-2, granulocyte macrophage colony-stimulating factor (GM-CSF), IL-12, IL-17, IL-8, monocyte chemotactic protein (MCP-1), macrophage inflammatory protein-1 beta (MIP-1β), IL-6, IL- 7, IL-4, IL-5, IL-10, IL-13, granulocyte colony stimulating factor (G-CSF) were analyzed using the 17-plex kit with the BioPlex Pro® (Bio-Rad; Hercules, CA). CRP levels in plasma were determined using a high-sensitivity ELISA assay (ALPCO Immunoassays™). The inter-assay variability of the cytokines was 6.5% for high values and 9.6% for low values. Intra-assay variability was 5.6% for high values and 8.8% for low values. The inter-assay variability for the CRP ELISA, run in duplicate, was 13.8% for high values and 11.6% for low values; intra-assay variability was 5.5% for high values and 6.0% for low values. R2 values for the standard curves ranged from 0.9879 to 0.9984.
Data Analysis
A target enrollment of 72 individuals was based on the need for a final sample size of 60, assuming an attrition rate of 20%. The pooled variance for OSE and PSS was estimated using data from Menzies et al. (2006) and Antoni et al. (2000). Assuming an α=0.05, a total sample size of 60 (30 per group) was estimated to have 63% and 93% power to detect differences in OSE of 10% and 15% between the intervention and control group means, respectively. Similarly, a total sample size of 60 (30 per group) was estimated to have 89% and 99% power to detect differences in PSS of 10% and 15% between the intervention and standard care group means, respectively.
A mixed effects linear model was used to test for differences between the intervention and control groups on the primary outcome variables: (1) self-efficacy (OSE scores), (2) perceived stress (PSS scores), and (3) biobehavioral factors (FMS symptoms and immune biomarkers). Following the intent to treat principle, all available post-baseline data were used in the mixed effects linear model. The sample of 72 adult women with FMS was randomized to either the UC+GI experimental group or the UC control group. Of the 72, 8 did not have Time 2 (week 6) or Time 3 (week 10) data; 6 of these were in the UC+ GI group and 2 were in the UC control group. Thus, a total of 64 subjects were used in the analysis. The fixed effects included visit number (baseline, 6 and 10 weeks), group (intervention and control) and the visit-by-group interaction; covariates included age (in years) and time from first diagnosis (in years) for the behavioral variables, and BMI and menopausal status for the biologic variables. Subjects were modeled as random effects. Because the cytokine and CRP data were skewed positively, a log transformation was used to normalize the data and stabilize the variance. Those values below the detection limit were substituted with a value of one-half of the lower detection limit for both cytokines and CRP. No adjustment for multiplicity was used; the results from this trial should be regarded as exploratory and should be confirmed in a larger trial.
Results
At baseline, there were no statistically significant differences between groups on demographic variables (Table 1). The least square means and standard errors from the mixed model analysis of self-efficacy, perceived stress and biobehavioral symptoms (fatigue, pain severity, pain interference, and depression) are presented in Table 2. For each variable, changes in the UC+GI group as compared to the UC control group were examined for two time periods: from baseline to 6 weeks, and from baseline to 10 weeks. The UC+GI group change from baseline to 6 weeks was significantly different (p ≤ 0.05) for decreased fatigue symptoms (BFI) and pain severity (BPI-S). There were marginal statistically significant (0.05 ≤ p ≤ 0.10) changes from baseline to 6 weeks for decreased perceived stress (PSS) and pain interference (BPI-I). The UC+GI group change from baseline to 10 weeks was significantly different from the corresponding UC group change for all of the symptoms with the exception of pain interference (BPI-I) which was marginally statistically significant (p=0.08; p=0.09 [6 and 10 weeks, respectively]).
Table 1.
Demographic Variables of Women with Fibromyalgia by Group (N = 64)
| Variable (%) | Intervention Group (N=30) M (SD) or N (%) |
Usual Care Group (N=34) M (SD) or N (%) |
Total (N=64) M (SD) or N |
|---|---|---|---|
| Age (in years) * | |||
| 44.5 (13.1) | 49.1 (12.4) | 46.9 (12.8) | |
| Race†‡ | |||
| Black/African American | 13 (43%) | 6 (18%) | 19 (30%) |
| Caucasian | 16 (53%) | 25 (74%) | 41 (64%) |
| More than 1 Race | 0 (0%) | 3 (9%) | 3 (5%) |
| Other | 1 (3%) | 0 (0%) | 1 (1%) |
| Ethnicity† | |||
| Hispanic or Latino | 2 (7%) | 2 (6%) | 4(6%) |
| Not Hispanic or Latino | 26 (93%) | 32 (94%) | 58 (94%) |
| Marital Status†§ | |||
| Married/Partner | 15 (50%) | 20 (59%) | 35 (55%) |
| Divorced/Separated | 6 (20%) | 8 (24%) | 14 (22%) |
| Single/Never Married | 8 (27%) | 5 (15%) | 13 (20%) |
| Widowed | 1 (3%) | 1 (3%) | 2 (3%) |
| Employment†# | |||
| Employed | 14 (50%) | 17 (50%) | 31 (50%) |
| Disabled | 2 (7%) | 9 (26%) | 11 (18%) |
| Other | 12 (43%) | 8 (24%) | 20 (32%) |
| Income† | |||
| ≥ $45,000 | 17 (57%) | 15 (45%) | 32 (51%) |
| < $45,000 | 13 (43%) | 18 (54%) | 31 (49%) |
| Education† | |||
| ≥ 16 years | 9 (31%) | 18 (53%) | 27 (43%) |
| < 16 years | 20 (69%) | 16 (47%) | 36 (57%) |
| Time-since-diagnosis* | |||
| 7.0 (6.8) | 9.7 (7.5) | 8.4 (7.3) | |
| BMI* | |||
| 30.0 (7.5) | 30.3 (6.5) | 30.0 (6.9) | |
| Menopausal Status† | |||
| Post | 17 (56%) | 21 (62%) | 38 (59%) |
| Pre | 13 (43%) | 13 (38%) | 26 (41%) |
Not significant using the two-sample, t-test
Not significant using the chi-square test
Categories collapsed to Caucasian vs. Other to meet the assumptions of the chi-square test
Categories collapsed to Married/Partner vs. Other to meet the assumptions of the chi-square test
Categories collapsed to Employed vs. Not Employed to meet the assumptions of the chi-square test
TABLE 2.
Least Square Means and Standard Errors from the Mixed Linear Model Analysis Comparing Intervention and Usual Care Groups
| Variable | Guided Imagery (n=30) M (SE) |
Usual Care (n=34) M (SE) |
p-Values† |
|---|---|---|---|
| OSE | |||
| Baseline | 47.9 (3.87) | 49.0 (3.62) | |
| Week 6 | 53.2 (3.87) | 49.3 (3.70) | NS* |
| Week 10 | 63.1 (3.90) | 52.5 (3.66) | 0.02 |
| PSS | |||
| Baseline | 21.0 (1.69) | 21.4 (1.57) | |
| Week 6 | 17.9 (1.68) | 20.8 (1.58) | 0.08 |
| Week 10 | 17.6 (1.70) | 20.7 (1.58) | 0.05 |
| BFI | |||
| Baseline | 6.2 (0.40) | 6.0 (0.38) | |
| Week 6 | 5.0 (0.40) | 5.9 (0.38) | 0.02 |
| Week 10 | 4.7 (0.41) | 5.7 (0.38) | < 0.01 |
| BPI - Severity | |||
| Baseline | 5.3 (0.39) | 4.7 (0.37) | |
| Week 6 | 4.7 (0.39) | 4.9 (0.37) | 0.03 |
| Week 10 | 4.6 (0.39) | 5.1 (0.37) | < 0.01 |
| BPI - Interference | |||
| Baseline | 5.5 (0.50) | 5.3 (0.47) | |
| Week 6 | 4.5 (0.50) | 5.2 (0.47) | 0.08 |
| Week 10 | 4.2 (0.50) | 4.9 (0.47) | 0.09 |
| CES-D | |||
| Baseline | 23.1 (2.48) | 22.4 (2.32) | |
| Week 6 | 19.4 (2.48) | 22.0 (2.34) | NS* |
| Week 10 | 18.7 (2.50) | 23.0 (2.33) | 0.02 |
OSE = Self-Efficacy for Managing Other Symptoms; PSS = Perceived Stress Scale: BFI–Brief Fatigue Inventory; BPI = Brief Pain Inventory; CES-D = Center for Epidemiological Studies-Depression
p-values from mixed effects linear model comparing the Guided Imagery group change from baseline to 6 weeks and10 weeks with the corresponding Usual Care group change from baseline to 6 and 10 weeks
NS denotes a p-value greater than 0.10.
The mixed linear model for the behavioral symptoms included the cofactors of time since diagnosis and age. Time since diagnosis was a significant predictor in the statistical model; the longer the time since FMS diagnosis, the lower the levels of fatigue (p < 0.01), pain severity (p = 0.05), pain interference (p≤ 0.01), and depression (p = 0.04) in response to the intervention. Time since diagnosis did not predict changes in perceived stress. Age did not predict changes in self-efficacy or biobehavioral factors; however, each additional year of age corresponded to a decrease in perceived stress scores of 0.18.
There were no statistically significant differences between the UC+GI and the UC control groups in levels of pro-and anti-inflammatory cytokines or CRP at baseline, 6 weeks or 10 weeks. However, there was a notable trend in the increase of IL-7 in the UC+GI group (baseline 6.60 [SE 0.95] pcg/mL at 6 weeks (7.59 [SE 0.99] pcg/mL) and 10 weeks (8.16 [SE 1.33] pcg/mL), while the UC group means remained relatively constant across the study interval (baseline 5.21 [SE 0.41] pcg/mL), 6 weeks (5.73 [SE 0.47] pcg/mL) and 10 weeks (5.23 [SE 0.47] pcg/mL). Levels of CRP for all participants was elevated but demonstrated little variation from baseline (4.27 [SE 0.60] mg/L) to 6 weeks (4.57 [SE 0.69] mg/L), to 10 weeks (4.55 [SE 0.60] mg/L). There was virtually no missing cytokine data. However, of the 17-plex panel cytokines, IL-2, IL-4, IL-5, IL-10, IL-12, IL-13, IL-17, IFN-γ, and TNF-α had more than 40% of sample values below the detection limit, indicating participants generally had low levels of these specific cytokines. For CRP, 15.3% of sample values were below the detection limit. In addition, it is not uncommon for plasma cytokine values to be below the level of detection due to either physiological state or variation in multiplex kits in determining absolute cytokine concentrations. Due to these challenges, previous methodological studies of multiplex cytokine analysis (Breen et al., 2011) have recommended for longitudinal studies to analyze cytokines in terms of relative changes rather than absolute concentrations, as we have done in this study.
The mixed linear model for the biobehavioral immune markers included the cofactors of BMI (in kilograms per square meter) and menopausal status (pre- and post-). BMI was a significant predictor in the model, with higher BMIs associated with higher levels of CRP (p=0.03), IL-6 (p=0.03), and MCP-1 (p≤ 0.01). Post-menopausal women also had increased levels of MCP-1 (p≤ 0.01).
Discussion
The purpose of this study was to investigate the effects of guided imagery on self-efficacy, perceived stress, and biobehavioral factors (symptoms and immune markers) in women diagnosed with FMS. There were statistically significant improvements in self-efficacy for managing other symptoms, perceived stress, and levels of symptoms (fatigue, pain severity, and depression) in the UC+GI group compared to UC control group. From Table 2, the least squared means from the mixed models showed consistent improvement for the Guided Imagery group as contrasted with the Usual Care group means that were relatively stable over time.
Self-efficacy
The improvement in self-efficacy for managing symptoms is consistent with similar studies of individuals with FMS (Buckelew et al, 1998; Lomi et al., 1995; Menzies et al., 2006; Menzies & Kim, 2008). Self-efficacy has been reported to be an independent predictor of an overall health promoting lifestyle in women diagnosed with FMS (Beal et al., 2009), while self-efficacy for managing pain has been reported to be a predictor for improvement in disability (Dobkin et al., 2010). Improvement in self-efficacy scores was a clinically relevant outcome in this study and a variable that should continue to be included in intervention studies in FMS.
Perceived stress
In addition to a statistically significant improvement in self-efficacy for managing other symptoms, levels of perceived stress were statistically significantly decreased in the UC+GI group compared to the UC group. Given the documented adverse health effects of chronic stress on the development of fatigue, pain and depression (Arnold, 2010; Curtis et al., 2011), this outcome is clinically pertinent. Unfortunately, intervention studies designed to reduce perceived stress in those with FMS are rare. In a placebo control study comparing a 4-week multimodal stress management intervention involving 4 participants with FMS, Smyth and Nazarian (2006) reported that the participants in the stress management group improved by an average of 80% in measures of fatigue, pain, and mood, compared with 23% improvement in the placebo group. This clinically important variable merits inclusion in future intervention studies, so that optimal strategies for stress reduction in the FMS population can be determined.
Fatigue
Fatigue was decreased for participants in the UC+GI group, as compared to the UC group. This is the first published study to document the effects of a guided imagery intervention on fatigue in those with FMS. There is not yet a consensus in published research regarding the overall effectiveness of a guided imagery intervention to reduce fatigue (Menzies & Jallo, 2011)., In a randomized controlled trial (RCT), Freeman and Welton (2005) reported improved fatigue scores for individuals diagnosed with asthma who received biologically targeted imagery (BTI) as compared to those who received critical thinking asthma management (CTAM) coupled with asthma education. In contrast, Haase and colleagues (2005) reported no statistically significant changes in fatigue scores following the administration of a guided imagery audiotaped intervention following conventional resection of colorectal carcinoma in elderly persons. Lack of consensus is common when interventions are in the early phases of rigorous evaluation. Additional research will contribute to a fuller explication of the effects and underlying mechanisms related to improvements in fatigue following guided imagery interventions.
Pain
Although there are several studies reporting the use of guided imagery in reducing acute or chronic pain (Lewandowski et al., 2010), few studies have explored the effectiveness of guided imagery for managing pain in persons with FMS (Fors & Götestam, 2000; Fors et al., 2002; Menzies et al., 2006; Menzies & Kim, 2008). Of these, results have been mixed. Results on pain reduction from three studies demonstrated significant differences between those who were in imagery intervention groups as compared to control groups (Fors & Götestam, 2000; Fors et al., 2002; Menzies & Kim, 2008). One study reported no statistically significant differences in pain outcomes between the guided imagery group and the control group (Menzies et al., 2006). Each of the reported studies was limited by a small sample size. Given the potential for guided imagery to be effective in promoting positive health outcomes, further randomized controlled trials that are sufficiently powered are needed (Lewandowski et al., 2010).
Depression
Findings demonstrated statistically significant decreases in CES-D scores in the UC+GI group as compared to the UC control group. Researchers have explored the effectiveness of a guided imagery intervention in reducing depressive symptoms in a range of populations, including persons diagnosed with depression (Apóstolo & Kolcaba, 2009), severe heart failure (Klaus et al., 2000), and advanced cancer (Sloman, 2002). However, this is the first known study to explore the effect of guided imagery as the sole adjunctive intervention on the outcome of depressive symptoms in women with FMS. Notably, the sample size in this study was sufficiently large to discern statistically significant changes in depressive symptoms.
Immune Biomarkers
The study was powered to discern the effects of the intervention on two main variables (self-efficacy and perceived stress). Thus, the possibility of a Type II error cannot be ruled out in terms of the nonsignificant effects of the guided imagery intervention on immune biomarkers. A larger sample size may help in discerning effects of the guided imagery intervention on immune biomarkers in women with FMS.
Although there were no statistically significant changes over time in CRP, levels of this systemic inflammation biomarker were elevated in this sample at a mean value of 4.27 mg/L at baseline. Published guidelines have established categories of inflammation based on peripheral blood concentrations of CRP with values > 3 mg/L reflecting high levels of inflammation (Ridker, 2007). Levels of CRP in participants in this study support the hypothesized view that there may be an inflammatory component to FMS (Wallace, 2006) and warrants further investigation given the link between elevated levels of CRP and adverse health outcomes (Crimmins et al., 2003).
Limitations and Recommendations for Future Research
This study was conducted in a sample of 72 female participants with FMS. Without an active control group (as opposed to usual care), demand effects could not be determined, therefore future study methods should take this limitation into consideration. In terms of adherence to the intervention, the majority of participants in this study reported daily use of the guided imagery audiotapes; however, data on frequency of practice were missing for about 40% of the sample. Although those 40% verbally reported using the intervention, they did not accurately document use in the data journal. This is a limitation that needs to be addressed in future studies. For example, using an electronic data collection system has potential for enhancing documentation related to self-reported intervention adherence. Finally, data from this study indicate the need for further research on the potential mechanisms underlying the biobehavioral relationships between the psychological and physiological parameters of FMS.
Conclusions
This study demonstrated significant effects of the guided imagery intervention on pain intensity, fatigue and depression. Pain, fatigue and depression are three of the most distressing symptoms experienced by patients with FMS. In addition, there was a statistically significant reduction in perceived stress and a significant improvement in self-efficacy for managing other symptoms. Overall, the findings support the theorized intervention mediators as well as the associations with FMS symptoms proposed by the biobehavioral model for the study but do not illuminate the physiological mechanisms that may be involved. It may be that psychosocial interventions such as GI lack the “potency” to measurably affect cytokine activity in the context of a complex disease such as FMS. The lack of significant findings for the immune markers also may be related to Type II error with this relatively small sample size.
The guided imagery intervention is low-cost, simple to use, and easily accessible. This study provides support for the use of guided imagery as an adjunctive approach to clinical management of the challenging symptoms of FMS. Subsequent studies should be undertaken to more fully elucidate the biobehavioral aspects of nonpharmacological intervention effectiveness.
Acknowledgments
Funding: Supported by the National Institute of Nursing Research through grant #P30 NR011403 M. J. Grap (PI).
This work was supported, in part, by award number UL1RR031990 from the National Center for Research Resources and NIH Roadmap for Medical Research, National Institutes of Health.
Contributor Information
Victoria Menzies, Virginia Commonwealth University, School of Nursing, 1100 East Leigh Street, P. O. Box 980567, Richmond, VA 23298-0567, vsmenzies@vcu.edu.
Debra E. Lyon, Virginia Commonwealth University, School of Nursing, 1100 East Leigh Street, P. O. Box 980567, Richmond, VA 23298-0567, delyon@vcu.edu.
R. K. Elswick, Jr., Virginia Commonwealth University, School of Nursing, 1100 East Leigh Street, P. O. Box 980567, Richmond, VA 23298-0567, rkelswic@vcu.edu.
Nancy L. McCain, Virginia Commonwealth University, School of Nursing, 1100 East Leigh Street, P. O. Box 980567, Richmond, VA 23298-0567, nlmccain@vcu.edu.
D. Patricia Gray, Department of Adult Health and Nursing Systems, Virginia Commonwealth University, School of Nursing, 1100 East Leigh Street, P. O. Box 980567, Richmond, VA 23298-0567, dpgray@vcu.edu.
References
- Abeles AM, Pillinger MH, Solitar BM, Abeles M. Narrative review: The pathophysiology of fibromyalgia. Annals of Internal Medicine. 2007;146(10):726–734. doi: 10.7326/0003-4819-146-10-200705150-00006. [DOI] [PubMed] [Google Scholar]
- Antoni MH, Cruess DG, Cruess S, Schneiderman N, et al. Cognitive-behavioral stress management intervention on anxiety, 24-hr urinary norepinephrine output, and t-cytotoxic/suppressor cells over time among symptomatic hiv-infected gay men. Journal of Consulting and Clinical Psychology. 2000;68:31–45. doi: 10.1037//0022-006x.68.1.31. [DOI] [PubMed] [Google Scholar]
- Apóstolo JLA, Kolcaba K. The effects of guided imagery on comfort, depression, anxiety, and stress of psychiatric inpatients with depressive disorders. Archives of Psychiatric Nursing. 2009;23:403–411. doi: 10.1016/j.apnu.2008.12.003. [DOI] [PubMed] [Google Scholar]
- Arnold LM. The pathophysiology, diagnosis and treatment of fibromyalgia. Psychiatric Clinics of North America. 2010;33:375–408. doi: 10.1016/j.psc.2010.01.001. [DOI] [PubMed] [Google Scholar]
- Author. Psychoneuroimmunological relationships in women with fibromyalgia. Biological Research for Nursing. doi: 10.1177/1099800411424204. in press. [DOI] [PMC free article] [PubMed] [Google Scholar]
- Bandura A. Self-efficacy: Toward a unifying theory of behavioral change. Psychological Review. 1977;84(2):191–215. doi: 10.1037//0033-295x.84.2.191. [DOI] [PubMed] [Google Scholar]
- Bandura A. Self-efficacy mechanism in psychobiologic functioning. In: Schwarzer R, editor. Self-efficacy: Thought control of action. Bristol, Pa: Taylor & Francis; 1992. pp. 355–394. [Google Scholar]
- Beal CC, Stuifbergen AK, Brown A. Predictors of a health promoting lifestyle in women with fibromyalgia syndrome. Psychology, Health & Medicine. 2009;14:343–353. doi: 10.1080/13548500902730093. [DOI] [PubMed] [Google Scholar]
- Bennett RM, McCain GA. Coping successfully with fibromyalgia. Patient Care. 1995;29:29–32. [Google Scholar]
- Bradley LA. Cognitive-behavioral therapy for primary fibromyalgia. Journal of Rheumatology. 1989;16(Suppl 19):131–136. [PubMed] [Google Scholar]
- Breen EC, Reynolds SM, Cox C, Norris PJ, et al. Multisite comparison of high- sensitivity multiplex cytokine assays. Clinical and Vaccine Immunology. 2011;18:1229–1242. doi: 10.1128/CVI.05032-11. [DOI] [PMC free article] [PubMed] [Google Scholar]
- Buckelew SP, Huyser B, Hewett JE, Kay DR, et al. Self-efficacy predicting outcome among fibromyalgia subjects. Arthritis Care & Research. 1996;9:97–104. doi: 10.1002/1529-0131(199604)9:2<97::aid-anr1790090205>3.0.co;2-f. [DOI] [PubMed] [Google Scholar]
- Buckelew SP, Conway R, Parker J, Kay DR, et al. Biofeedback/relaxation training and exercise interventions for fibromyalgia: A prospective trial. Arthritis Care & Research. 1998;11(3):196–209. doi: 10.1002/art.1790110307. [DOI] [PubMed] [Google Scholar]
- Clauw DJ. Fibromyalgia: an overview. The American Journal of Medicine. 2009;122:S3–S13. doi: 10.1016/j.amjmed.2009.09.006. [DOI] [PubMed] [Google Scholar]
- Cleeland CS. Measurement of pain by subjective report. In: Chapman CR, Loeser JD, editors. Advances in pain research and therapy: Issues in pain management. New York: Raven Press; 1989. pp. 391–403. [Google Scholar]
- Cohen S, Williamson G. Perceived stress in a probability sample of the United States. In: Spacapan S, Oskamp S, editors. The social psychology of health: Claremont symposium on applied social psychology. Newbury Park, CA: Sage Publications, Inc; 1988. pp. 31–67. [Google Scholar]
- Crimmins EM, Johnston M, Hayward M, Seeman T. Age differences in allostatic load: An index of physiological dysregulation. Experimental Gerontology. 2003;38:731–734. doi: 10.1016/s0531-5565(03)00099-8. [DOI] [PubMed] [Google Scholar]
- Curtis K, Osadchuk A, Katz J. An eight-week yoga intervention is associated with improvements in pain, psychological functioning and mindfulness, and changes in cortisol levels in women with fibromyalgia. Journal of Pain Research. 2011;4:189–201. doi: 10.2147/JPR.S22761. [DOI] [PMC free article] [PubMed] [Google Scholar]
- Dadabhoy D, Crofford LJ, Spaeth M, Russell IJ, Clauw DJ. Biology and therapy of fibromyalgia: Evidence-based biomarkers for fibromyalgia syndrome [Electronic version] Arthritis Research and Therapy. 2008;10(4):211. doi: 10.1186/ar2443. [DOI] [PMC free article] [PubMed] [Google Scholar]
- Dobkin PL, Liu A, Abrahamowicz M, Ionescu-Ittu R, Bernatsky S, Goldberger A, Baron M. Predictors of disability and pain six months after the end of treatment of fibromyalgia. Clinical Journal of Pain. 2010;26:23–29. doi: 10.1097/AJP.0b013e3181b40ee6. [DOI] [PubMed] [Google Scholar]
- Fors EA, Götestam KG. Patient education, guided imagery, and pain related talk in fibromyalgia coping. European Journal of Psychiatry. 2000;14:233–240. [Google Scholar]
- Fors EA, Sexton H, Götestam KG. The effect of guided imagery and amitriptyline on daily fibromyalgia pain: a prospective, randomized, controlled trial. Journal of Psychiatric Research. 2002;36:179–187. doi: 10.1016/s0022-3956(02)00003-1. [DOI] [PubMed] [Google Scholar]
- Freeman LW, Welton D. Effects of imagery, critical thinking, and asthma education on symptoms and mood state in adult asthma patients: A pilot study. The Journal of Alternative and Complementary Medicine. 2005;11:57–68. doi: 10.1089/acm.2005.11.57. [DOI] [PubMed] [Google Scholar]
- Gür A, Oktagolu P. Status of immune mediators in fibromyalgia. Current Pain and Headache Reports. 2008;12:175–181. doi: 10.1007/s11916-008-0031-4. [DOI] [PubMed] [Google Scholar]
- Haase O, Schwenk W, Hermann C, Müller M. Guided imagery and relaxation in conventional colorectal resections: A randomized, controlled, partially blinded trial. Diseases of the Colon & Rectum. 2005;48:1955–1963. doi: 10.1007/s10350-005-0114-9. [DOI] [PubMed] [Google Scholar]
- Institute of Medicine (IOM) Relieving pain in America: A blueprint for transforming prevention, care, education, and research. Washington, D.C: National Academies Press; 2011. Retrieved from http://www.nap.edu/catalog.php?record_id=13172. [PubMed] [Google Scholar]
- Jallo N, Bourguignon C, Taylor AG, Utz SW, Snyder AE. Stress management during pregnancy: Designing and evaluating a mind-body intervention. Family & Community Health. 2008;31:190–203. doi: 10.1097/01.FCH.0000324476.48083.41. [DOI] [PubMed] [Google Scholar]
- Klaus L, Beniaminovitz A, Choi L, Greenfield F, Whitworth GC, Oz MC, Mancini DM. Pilot study of guided imagery use in patients with severe heart failure. American Journal of Cardiology. 2000;86:101–104. doi: 10.1016/s0002-9149(00)00838-9. [DOI] [PubMed] [Google Scholar]
- Lewandowski W, Jacobson A, Palmieri PA, Alexander T, Zeller R. Biological mechanisms related to the effectiveness of guided imagery for chronic pain. Biological Research for Nursing. 2010;000(00):1–12. doi: 10.1177/1099800410386475. [DOI] [PubMed] [Google Scholar]
- Lomi C, Burckhardt C, Nordholm L, Bjelle A, Ekdahl C. Evaluation of a Swedish version of the arthritis self-efficacy scale in people with fibromyalgia. Scandinavian Journal of Rheumatology. 1995;24:282–287. doi: 10.3109/03009749509095164. [DOI] [PubMed] [Google Scholar]
- Lorig K, Chastain RL, Ung E, Shoor S, Holman HR. Development and evaluation of a scale to measure perceived self-efficacy in people with arthritis. Arthritis & Rheumatism. 1989;32:37–44. doi: 10.1002/anr.1780320107. [DOI] [PubMed] [Google Scholar]
- McCain NL, Gray DP, Walter JM, Robins J. Implementing a comprehensive approach to the study of health dynamics using the psychoneuroimmunology paradigm. Advances in Nursing Science. 2005;28:320–332. doi: 10.1097/00012272-200510000-00004. [DOI] [PMC free article] [PubMed] [Google Scholar]
- McCarberg BH. Clinical overview of fibromyalgia. American Journal of Therapeutics. 2011 Feb 15;0:000–000. doi: 10.1097/MJT.0b013e3181ff7bee. [DOI] [PubMed] [Google Scholar]
- M. D. Anderson Cancer Center Pain Research Group. Brief Fatigue Inventory. 2009 (2009a, September 12, 2009) from http://www3.mdanderson.org/depts/prg/bfi.htm#det_descript.
- M. D. Anderson Cancer Center Pain Research Group. Brief Pain Inventory. 2008 (2009b, September, 12, 2009) from http://www3.mdanderson.org/depts/prg/bpi.htm.
- Mease P, Arnold LM, Bennett R, Boonen A, Buskila D, Carville S, Crofford L, et al. Fibromyalgia syndrome. The Journal of Rheumatology. 2007;34(6):1415–1425. [PubMed] [Google Scholar]
- Mendoza TR, Wang XS, Cleeland CS, Morrissey M, Johnson BA, Wendt JK, Huber SL. The rapid assessment of fatigue severity in cancer patients: Use of the brief fatigue inventory. Cancer. 1999;85:1186–1196. doi: 10.1002/(sici)1097-0142(19990301)85:5<1186::aid-cncr24>3.0.co;2-n. [DOI] [PubMed] [Google Scholar]
- Menzies V, Jallo N. Guided imagery as a treatment option for fatigue: A literature review. Journal of Holistic Nursing. 2011 doi: 10.1177/0898010111412187. [DOI] [PMC free article] [PubMed] [Google Scholar]
- Menzies V, Kim S. Relaxation and guided imagery in Hispanic persons diagnosed with fibromyalgia: A pilot study. Family and Community Health. 2008;31:204–212. doi: 10.1097/01.FCH.0000324477.48083.08. [DOI] [PubMed] [Google Scholar]
- Menzies V, Lyon D. Integrated review of the association of cytokines with fibromyalgia and fibromyalgia core symptoms. Biological Research for Nursing. 2010;11:387–394. doi: 10.1177/1099800409348328. [DOI] [PMC free article] [PubMed] [Google Scholar]
- Menzies V, Lyon DE, Elswick RK, Jr, Montpetit AJ, McCain NL. Psychoneuroimmunological relationships in women with fibromyalgia. Biological Research for Nursing. 2011;000(00):1–7. doi: 10.1177/1099800411424204. Advance online publication. [DOI] [PMC free article] [PubMed] [Google Scholar]
- Menzies V, Taylor AG. The idea of imagination: an analysis of “imagery”. Advances in Mind-Body Medicine. 2004;20(2):4–10. [PubMed] [Google Scholar]
- Menzies V, Taylor AG, Bourguignon C. Effects of guided imagery on outcomes of pain, functional status, and self-efficacy in persons diagnosed with fibromyalgia. Journal of Alternative and Complementary Medicine. 2006;12:23–30. doi: 10.1089/acm.2006.12.23. [DOI] [PMC free article] [PubMed] [Google Scholar]
- National Institute of Arthritis and Musculoskeletal and Skin Diseases (NIAMS) Questions and answers about fibromyalgia. 2009 Apr; Retrieved from http://www.niams.nih.gov/Health_Info/Fibromyalgia/default.asp.
- Radloff LS. The CES-D scale: A self-report depression scale for research in the general population. Applied Psychological Measurement. 1977;1:385–401. [Google Scholar]
- Ridker PM. Inflammatory biomarkers and risks of myocardial infarction, stroke, diabetes, and total mortality: Implications for longevity. Nutrition Reviews. 2007;65:S253–S259. doi: 10.1111/j.1753-4887.2007.tb00372.x. [DOI] [PubMed] [Google Scholar]
- Sloman R. Relaxation and imagery for anxiety and depression control in community patients with advanced cancer. Cancer Nursing. 2002;25(6):432–435. doi: 10.1097/00002820-200212000-00005. [DOI] [PubMed] [Google Scholar]
- Smyth J, Nazarian D. Development and preliminary results of a self- administered intervention for individuals with fibromyalgia syndrome: A multiple case control report. EXPLORE: Journal of Science and Healing. 2006;2(5):426–430. doi: 10.1016/j.explore.2006.06.003. [DOI] [PubMed] [Google Scholar]
- Schmidt-Wilcke T, Clauw DJ. Fibromyalgia: From pathophysiology to therapy. Nat Rev Rheumatology. 2011;7:518–527. doi: 10.1038/nrrheum.2011.98. [DOI] [PubMed] [Google Scholar]
- Üçeyler N, Valenza R, Stock M, Schedel R, Sprotte G, Sommer C. Reduced levels of antiinflammatory cytokines in patients with chronic widespread pain. Arthritis & Rheumatism. 2006;54(8):2656–2664. doi: 10.1002/art.22026. [DOI] [PubMed] [Google Scholar]
- Üçeyler N, Hauser W, Sommer C. Systematic review with meta-analysis: Cytokines in fibromyalgia syndrome. BMC Musculoskeletal Disorders. 2011;12:245. doi: 10.1186/1471-2474-12-245. [DOI] [PMC free article] [PubMed] [Google Scholar]
- Wallace DJ. Is there a role for cytokine based therapies in fibromyalgia. Current Pharmaceutical Design. 2006;12:17–22. [PubMed] [Google Scholar]
- Wolfe F, Smythe HA, Yunus MB, Bennett RM, Bombardier C, Goldenberg DL, Sheon RP, et al. The American college of rheumatology 1990 criteria for the classification of fibromyalgia. Report of the multicenter criteria committee. Arthritis & Rheumatism. 1990;33:160–172. doi: 10.1002/art.1780330203. [DOI] [PubMed] [Google Scholar]