

Background: Not much is known about epigenomic changes during the differentiation of human stem cells into mature enucleated red cells.
Results: Methylome analysis during human erythropoiesis revealed that global hypomethylation occurs during this process and correlates with transcriptomic changes.
Conclusion: Integrative analysis also allowed us to identify novel regulatory areas of the genome.
Significance: Progressive functional hypomethylation during human erythroid differentiation changes the current paradigm.
Keywords: DNA Methylation, Erythrocyte, Erythropoeisis, Hematopoiesis, Tissue-specific Transcription Factors, Erythroid
Abstract
Differentiation of hematopoietic stem cells to red cells requires coordinated expression of numerous erythroid genes and is characterized by nuclear condensation and extrusion during terminal development. To understand the regulatory mechanisms governing these widespread phenotypic changes, we conducted a high resolution methylomic and transcriptomic analysis of six major stages of human erythroid differentiation. We observed widespread epigenetic differences between early and late stages of erythropoiesis with progressive loss of methylation being the dominant change during differentiation. Gene bodies, intergenic regions, and CpG shores were preferentially demethylated during erythropoiesis. Epigenetic changes at transcription factor binding sites correlated significantly with changes in gene expression and were enriched for binding motifs for SCL, MYB, GATA, and other factors not previously implicated in erythropoiesis. Demethylation at gene promoters was associated with increased expression of genes, whereas epigenetic changes at gene bodies correlated inversely with gene expression. Important gene networks encoding erythrocyte membrane proteins, surface receptors, and heme synthesis proteins were found to be regulated by DNA methylation. Furthermore, integrative analysis enabled us to identify novel, potential regulatory areas of the genome as evident by epigenetic changes in a predicted PU.1 binding site in intron 1 of the GATA1 gene. This intronic site was found to be conserved across species and was validated to be a novel PU.1 binding site by quantitative ChIP in erythroid cells. Altogether, our study provides a comprehensive analysis of methylomic and transcriptomic changes during erythroid differentiation and demonstrates that human terminal erythropoiesis is surprisingly associated with hypomethylation of the genome.
Introduction
Multiple regulatory mechanisms regulate the activation and suppression of the overall gene transcription in hematopoiesis. Transcription factors are important in activation and suppression of lineage-specific genes during stem cell commitment to defined lineages. Prevailing concepts suggest that demethylation of the proximal promoter regions of genes is critical for binding of transactivating factors for transcriptional initiation. Accumulated data indicate that during the early phase of blood cell development, promoter regions of transcription factors are hypomethylated, thus allowing direct binding of transcription factors. On the other hand, following lineage commitment and expansion, most blood cells undergo terminal differentiation where the expression of limited sets of genes is needed. Therefore, it would be expected that hypermethylation of promoter regions would occur with associated repression of the non-erythroid gene transcriptional programs. Hypermethylation is also expected during nuclear condensation and enucleation that is seen during terminal erythroid differentiation. Because there are no genome-wide studies of human erythropoiesis, we examined the changes in DNA methylation in primary erythroid cells representing all major stages of differentiation.
Several experimental approaches are available to determine genome-wide DNA methylation levels. Most of these techniques are based on restriction enzyme digestion or DNA immunoprecipitation with antibodies that bind to methylated CpGs (1). HpaII tiny fragment enrichment by ligation-mediated PCR (HELP)4 relies on differential digestion by a pair of enzymes, HpaII and MspI, which differ on the basis of their methylation sensitivity. The HpaII and MspI genomic representations can be co-hybridized to a custom microarray, and their ratio can be used to indicate the methylation of particular CCGG sites at these loci. The HELP assay has been shown to be a robust discovery tool and has been successful in revealing novel epigenetic alterations in leukemias, myelodysplasia, and esophageal cancer (2–4). Most studies on DNA methylation have been single locus studies and have focused only on promoters and CpG islands (5, 6). Newer data have shown that non-CpG island loci are very important in gene regulation (7). Furthermore, newer higher resolution assays reveal that gene body methylation may be even more important in gene regulation than promoter methylation (8). These data prompted us to use a high resolution approach to interrogate the methylation status of 1.3 million CpGs during human erythropoiesis.
We examined changes in methylation at multiple time points during terminal differentiation using a human erythroid in vitro model that is capable of generating every major stage of erythroid progenitors and erythroblasts in a dynamic fashion. We find that during lineage commitment and subsequent terminal maturation, the genome undergoes extensive hypomethylation. These data alter the prevailing notion of the need for increased methylation and an “inactive” genome in differentiated cells. Furthermore, the current study demonstrates the value of using epigenetic imprints to uncover novel transcription factors that were previously unknown to be important in functions associated with terminal differentiation events.
MATERIALS AND METHODS
Primary Human Erythroid Cultures and Flow Cytometry
CD34+ early stem/hematopoietic cells were purified from growth factor-mobilized peripheral blood of healthy donors purchased from All Cells Inc. Purified stem/progenitor cells were cultured in medium containing 15% fetal calf serum, 15% human serum Iscove's modified Dulbecco's medium, 10 ng/ml IL-3, 2 units/ml EPO, and 50 ng/ml SCF. During the initial 7 days of culture, cells were fed on days 3 and 6 by adding an equal volume of fresh culture medium supplemented with growth factors. However, no new IL-3 was added after the initial addition on day 0, and the amount of SCF added to the fresh medium was gradually decreased at each feeding (day 3, 25 ng/ml; day 6, 10 ng/ml; day 8, 2 ng/ml). The amount of EPO added was 2 units/ml during each feeding. On day 7 of culture, cells were flow cytometry-sorted for CD71-positive (transferrin receptor) cells using a MoFlo high speed flow cytometer. The purity of the population isolated by this method was 98–99%. Sorted cells were cultured in the same medium as before with EPO and SCF, except the concentration of SCF was reduced to 2 ng/ml. Cells were fed one more time on day 10 of culture by adding an equal volume of fresh medium with only EPO (2 units/ml) during this final feeding. Cells were collected for DNA and RNA isolation on days 0, 3, 7, 10, 13, and 16 of culture. Flow cytometry analysis was performed to monitor commitment to the erythroid lineage and for continued erythroid differentiation using fluorochrome-conjugated CD71 and Glycophorin A, two surface proteins that are expressed in erythroid progenitors and erythroblasts, respectively. Unstained cells and isotype-specific antibody-stained cells were used as controls to set gating for each cell population.
Genome-wide DNA Methylation Analysis Using the HELP Assay
Genomic DNA was isolated by phenol chloroform extraction, as performed before (9). HELP was carried out as described previously (10). Intact DNA of high molecular weight was corroborated by electrophoresis on 1% agarose gel in all cases. One microgram of genomic DNA was digested overnight with either HpaII or MspI (New England Biolabs, Ipswich, MA). On the following day, the reactions were extracted once with phenol-chloroform and resuspended in 11 μl of 10 mm Tris-HCl, pH 8.0, and the digested DNA was used to set up an overnight ligation of the JHpaII adapter using T4 DNA ligase. The adapter-ligated DNA was used to carry out the PCR amplification of the HpaII and MspI-digested DNA as described previously (10). Both amplified fractions were labeled with fluorochromes and hybridized onto a human HG18 custom-designed oligonucleotide array covering 1.3 million HpaII-amplifiable fragments (3, 9, 10). HELP microarray data have been submitted to the GEO database. All microarray hybridizations were subjected to extensive quality control. Uniformity of hybridization was evaluated using a modified version of a previously published algorithm (4) adapted for the NimbleGen platform, and any hybridization with strong regional artifacts was discarded.
Quantitative DNA Methylation Analysis by MassArray Epityping
Validation of HELP microarray findings was carried out by MALDI-TOF mass spectrometry using EpiTyper by MassArray (Sequenom) on bisulfite-converted DNA as described previously (11, 12). MassArray primers were designed to cover the flanking HpaII sites for a given HpaII-amplifiable fragment as well as any other HpaII sites found up to 2,000 bp upstream of the downstream site and up to 2,000 bp downstream of the upstream site, in order to cover all possible alternative sites of digestion.
Gene Expression Profiling
RNA was extracted using Qiagen RNeasy minikits. Samples from the same cell preparations used for DNA isolation was used for RNA isolation. RNA integrity was corroborated with the Agilent Bioanalyzer 2100. RNA (100 ng/μl; 3 μl) was submitted to the Genomics Facility, Albert Einstein College of Medicine, for gene expression studies using the NimbleGen array (2006-10-26_Human_60mer_1in2) containing at least 10 (60-mer) probes designed for 37,364 genes from GenBankTM build 35. A comprehensive set of RNA expression profiles was obtained and used for analysis to correlate with our methylation profiling data.
HELP Data Processing and Analysis
Signal intensities at each HpaII-amplifiable fragment were calculated as a robust (25% trimmed) mean of their component probe level signal intensities. Any fragments found within the level of background MspI signal intensity, measured as 2.5 mean absolute differences above the median of random probe signals, were categorized as “failed.” These failed loci therefore represent the population of fragments that did not amplify by PCR, whatever the biological (e.g. genomic deletions and other sequence errors) or experimental cause. On the other hand, “methylated” loci were so designated when the level of HpaII signal intensity was similarly indistinguishable from background. PCR-amplifying fragments (those not flagged as either methylated or failed) were normalized using an intra-array quantile approach wherein HpaII/MspI ratios are aligned across density-dependent sliding windows of fragment size-sorted data. The log2(HpaII/MspI) was used as a representative for methylation and analyzed as a continuous variable. For most loci, each fragment was categorized as either methylated (if the centered log HpaII/MspI ratio was less than zero) or hypomethylated (if, on the other hand, the log ratio was greater than zero). The data have been submitted to the GEO database. (GEO accession no. GSE44054.)
Microarray Data Analysis
Unsupervised clustering of HELP data by hierarchical clustering was performed using the statistical software R, version 2.6.2. A two-sample t test was used for each gene to summarize methylation differences between groups. Genes were ranked on the basis of this test statistic, and a set of top differentially methylated genes with an observed log -fold change of >1 between group means was identified. Genes were further grouped according to the direction of the methylation change (hypomethylated versus hypermethylated), and the relative frequencies of these changes were computed among the top candidates to explore global methylation patterns. Validations with MassArray showed good correlation with the data generated by the HELP assay. MassArray analysis validated significant quantitative differences in methylation for differentially methylated genes selected by our approach.
Genomic Annotations
Genomic coordinates were obtained from the HG18 build of the human genome from the University of California Santa Cruz (UCSC) browser. Genomic regions 2 kb upstream and downstream of the transcription start sites were annotated as promoters. 2-kb flanking regions around the edges of CpG islands were annotated as CpG shores. Transcription factor binding sites were obtained from the Yale transcription factor binding site (TFBS) database in the browser. Regions of 200 bp around the TFBS were used for overlap with differentially methylated regions.
Pathway Analysis and Transcription Factor Binding Site Analysis
Using the Ingenuity (Redwood City, CA) Pathway Analysis software, enrichment of genes associated with specific canonical pathways was determined relative to the Ingenuity knowledge database at a significance level of p < 0.01. Transcription factor binding sites in the demethylated regions were determined by the HOMER algorithm (13).
qChIP and PU.1 ChIP-Seq
qChIP was performed as described previously (14). ChIP for ChIP-Seq analysis was performed similarly (14) using 5 × 10⁷ cells and 60 μg of anti-PU.1 antiserum.
RESULTS
A Primary Cellular Model Permits Dissection of Human Erythropoiesis in a Dynamic Fashion during Terminal Differentiation
Human CD34+ stem/early progenitors were cultured under defined conditions to enable commitment to erythroid lineage, expansion of erythroid progenitors, and subsequent terminal differentiation into reticulocytes by 16 days of culture (Fig. 1A). In this model, the first erythroid lineage-committed cells (burst forming unit-erythroid; BFU-E) are observed by day 3 of culture, and they continue to grow and reach proerythroblast/basophilic erythroblast stage by day 7 (Fig. 1). These basophilic erythroblasts continue to proliferate and by day 10 reach the orthochromatic stage of maturation. From the time of lineage commitment until very late stages of differentiation, the cells continue to transcribe globin genes and other erythroid-specific genes that ultimately characterize cells of red blood cell origin (15–18). In addition, these primary human cells are capable of extruding their nuclei during the terminal phase of differentiation to give rise to reticulocytes. Overall, this model is able to recapitulate the erythroid differentiation program in a stage-specific manner and therefore is ideal for following changes in epigenetic signaling leading to modification of the DNA landscape in a dynamic fashion.
FIGURE 1.

In vitro model of erythropoiesis recapitulates distinct stages of erythroid differentiation. Primary human CD34+ stem/progenitor cells cultured under conditions of erythroid lineage commitment and terminal differentiation were collected and stained with hematoxylin and benzidine. Hematoxylin stained the nucleus and membrane areas, whereas benzidine stained for hemoglobin, as seen by the brown color. Photomicrographs of cells on each day of culture and the corresponding morphological stage of differentiation are shown in the scheme along with schematic representation of each stage during the differentiation program.
We used the HELP assay to interrogate global cytosine methylation changes at each stage of maturation during the stem cell to reticulocyte development program. Parallel gene expression analysis was conducted for transcriptomic analysis. Two independent sets of experiments were performed and analyzed. The analysis of methylome and transcriptome showed good correlations between the two biological replicates (Fig. 2A). The heat map based on Pearson's correlation demonstrated accumulation of epigenetic and transcriptomic changes during erythroid differentiation, with similarity in global expression and methylation profiles between proximate differentiation states (Fig. 2, A and B). Unsupervised clustering based on methylation profiles revealed that most striking changes occurred from the transition of early (days 0–7) to late (days 10–16) stages of erythropoiesis (Fig. 2C). Parallel gene expression analysis also revealed changes in gene expression between early and late stages of erythropoiesis, although the main shift in gene expression patterns was observed after day 10 of differentiation (Fig. 2D). This demonstrated that although both methylomic and transcriptomic changes occur during erythropoiesis, large scale changes in the epigenome precede similar changes in the transcriptome.
FIGURE 2.
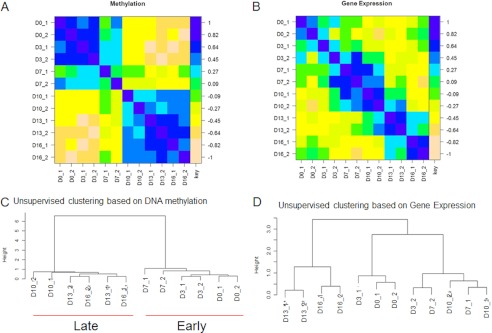
Progressive changes in DNA methylation are seen during erythropoiesis. A, correlation matrix based on methylation profiles generated by the HELP assay from two independent experiments. Genomic DNA isolated from cells during the differentiation program (days 0–16) was used in the HELP assay. Each day of culture and the biological replicate number are indicated on the heat map. A high correlation is observed between proximate differentiation states as well as between the two replicate samples. B, gene expression profiles were also generated from RNA samples isolated concurrently from each of the replicate samples used for methylation analysis. C, unsupervised clustering of all samples based on DNA methylation profiles showed a distinct separation between early (days 0, 3, and 7) and late (days 10, 13, 16) stages of erythroid differentiation, consistent with dramatic phenotypic changes that are observed during early versus late stages of the maturation program. D, unsupervised clustering based on gene expression profiles showed a distinct separation between terminal erythroid (days 13 and 16) and earlier (days 0, 3, 7, and 10) stages of erythroid differentiation.
Hypomethylation Is the Predominant Epigenetic Change during Erythroid Development
Having demonstrated epigenetic dissimilarity between early and late erythroid cells, we next determined the qualitative epigenetic differences between these groups by performing a supervised analysis of the respective DNA methylation profiles. A volcano plot comparing the differences between mean methylation of individual loci between different stages of differentiation against the significance (log(p value) based on t test) of the difference was used to represent these data in Fig. 3A. We observed that progressive hypomethylation was seen during erythroid differentiation. The loss of methylation was particularly striking when compared between the early and late erythroid progenitors (Fig. 3A, last panel; differentially methylated loci in red had a false discovery rate of <0.1 after Benjamini Hochberg correction) and was significantly higher when compared with hypermethylation. (A two-tailed t test was used to compare significance of difference between hypo- and hypermethylated loci and demonstrated a p value of <0.0001).
FIGURE 3.

Erythropoiesis is characterized by progressive hypomethylation during terminal differentiation. A, the difference in mean DNA methylation between each stage of differentiation is depicted by volcano plots (stages of differentiation on the x axis and the log of the p values between the means on the y axis). A two-tailed t test was used to calculate the p values. Significantly methylated loci with a log -fold change in mean methylation are labeled in grey on each plot and are predominantly hypomethylated. The last panel shows differences in methylation between early (days 0, 3, and 7) and late (days 10, 13, and 16) erythroid cells. Differentially hypomethylated regions between early and late stages of erythropoiesis were grouped by their genomic locations and plotted as a proportion of the total probes representing that region on the array. B, hypomethylation during differentiation spans the entire genome, and a higher proportion of demethylated loci were located in intergenic regions and gene bodies as indicated. In addition, CpG shores had a higher proportion of DMRs than CpG islands.
Although the hypomethylation affected all parts of the genome (Fig. 3B and supplemental Table 1), intergenic regions and gene bodies were found to be most significantly affected by loss of methylation (Fig. 3B). Interestingly, a greater proportion of CpG shores were also found to be affected by hypomethylation when compared with CpG islands, consistent with other recent observations implicating these genomic regions as targets of aberrant methylation in cancer (7).
Correlation with changes in gene expression showed that differentially hypomethylated regions correlated with changes in gene expression. Hypomethylation at promoters was associated with increased expression of genes in late stages of erythropoiesis (Fig. 4A). Interestingly, hypomethylation at gene bodies was associated with decreased expression of genes (Fig. 4B), consistent with recent reports that highlight this inverse association (8).
FIGURE 4.

Hypomethylation correlates with changes in gene expression. Box plots representing gene expression of the DMR grouped by genomic locations are shown. Hypomethylation at promoters is associated with increased gene expression (A), whereas intragenic demethylation is associated with decreased gene expression (B) (significant changes between expression in early and late erythroid cells are shown by p value calculated by the t test). Absolute changes in gene expression between early and late erythropoiesis are shown for differentially methylated promoters, gene bodies, and TFBS. Differentially methylated TFBS correlate with a greater magnitude of changes in expression of associated genes when compared with differentially methylated promoters and intragenic regions (t test, p < 0.001) (C). DMRs located at TFBSs that were associated with differentially expressed genes were grouped by their genomic locations. D, the pie chart shows that overrepresentation of these regulatory TFBSs is seen in gene bodies. Error bars, S.E.
It has been recently shown that changes in DNA methylation at intragenic regions can regulate transcription by affecting transcription factor binding at enhancer regions. We mapped TFBS across the genome and studied the effect of epigenetic changes at these locations. Determination of the effect of differential methylation on global gene expression showed that changes at TFBS were associated with the greatest magnitude of changes in expression (Fig. 4C). Further analysis of all TFBS that were affected by hypomethylation and were associated with differentially expressed genes revealed that a large proportion of these sites were actually situated in gene bodies (Fig. 4D), suggesting that these intragenic regulatory areas are probably involved in regulating transcriptomic changes.
In order to further confirm our findings, we performed the MALDI-TOF (MassArray, Sequenom) assay, which enabled us to quantitatively estimate the extent of methylation of selected loci in the genome. These experiments revealed a strong correlation with the findings of our HELP microarrays, further demonstrating that hypomethylation of various regulatory regions of the genome is an important phenomenon during the erythroid differentiation program (supplemental Fig. 1).
Differentially Hypomethylated Regions Display Enrichment for Numerous Transcription Factors Not Previously Implicated in Erythropoiesis
Because epigenetic changes at TFBS were associated with transcriptomic changes, we wanted to determine whether these hypomethylated loci shared any common DNA motifs. A search for transcription factor binding motifs within differentially methylated loci (HOMER program) (13) revealed significant overrepresentation of binding sites for many transcription factors. Among them, SCL, Myb, GATA2, NF1, and the NFY family of proteins are well known to participate in regulation of erythroid differentiation program and therefore likely to bind one or more of these predicted motifs. In addition, our analysis also revealed enrichment of binding motifs within the hypomethylated regions for multiple proteins that have not been implicated in regulation of the erythroid differentiation program (Table 1). Because genes corresponding to these proteins are expressed in these cells, according to our array data, it is likely that many of these proteins directly bind DNA and modulate the gene transcription program.
TABLE 1.
Transcription factor binding sites enriched in demethylated regions during erythroid differentiation
| Transcription factor | Motifa | p value |
|---|---|---|
| SCL | NNCNBVHD | 1.00e−68 |
| Nanog | DNYNWTYNNN | 1.00e−55 |
| RXR (NR/DR1) | NNDRNNWVRRDNNN | 1.00e−31 |
| MYB (HTH) | DDCVGTTR | 1.00e−31 |
| NF1 half-site (CTF) | NTGSCARV | 1.00e−28 |
| Pdx (homeobox) | NHATNHVTMW | 1.00e−26 |
| ZFX (Zf) | RGGCCYNN | 1.00e−26 |
| AR half-site (NR) | NHNRGNACWN | 1.00e−24 |
| NFAT (RHD) | NNKTTCCRNN | 1.00e−22 |
| PPARE (NR/DR1) | NNNNYYNTNNYHHN | 1.00e−19 |
| Gata2 (Zf) | NNBTTATCDN | 1.00e−19 |
| NFY (CCAAT) | VNCCAATVVV | 1.00e−19 |
| BMYB (HTH) | NHAACNGNHN | 1.00e−18 |
| LHX3 (homeobox) | NYWATKRNNN | 1.00e−18 |
| Gata1 (Zf) | NHGATAASVN | 1.00e−14 |
a Nucleic acid nomenclature is used as follows. A, adenine; T, thymine; G, guanine; C, cytosine; R, guanine or adenine; Y, thymine or cytosine; M, adenine or cytosine; K, guanine or thymine; S, guanine or cytosine; W, adenine or thymine; H, adenine, cytosine, or thymine; B, guanine, thymine, or cytosine; V, guanine, cytosine, or adenine; D guanine, thymine, or adenine; N, any nucleic acid.
Important Gene Pathways Are Regulated by Methylation in Erythropoeisis
We next analyzed the genes that were regulated by changes in methylation during erythroid differentiation. The genes that were up-regulated and hypomethylated during erythroid differentiation were grouped by their gene ontology categories. We observed that many critical pathways involved in development and apoptosis were included in the highly ranked gene ontology categories. (Table 2). Multiple genes that are known to be important for erythroid development, such as cell survival (BAD), surface receptors (EPOR), membrane stability and signaling (RAP-GAP), transporters (SLC2A1, AQP1, SLC4A1), membrane assembly (ANK1), and heme biosynthesis (SLC25A38), were among the easily recognizable genes that exhibited differential hypomethylation in our samples, although genes that have not been previously recognized to be important in erythroid differentiation were also found to be hypomethylated with concomitant gene up-regulation (Table 2). Although the majority of the epigenetic changes during erythroid differentiation involved loss of methylation, we also observed a limited set of genomic loci that were hypermethylated during lineage commitment and progressive differentiation (supplemental Table 2). The vast majority of genomic loci that exhibited hypermethylation were not easily recognizable genes or regulatory regions important in promoting the erythroid differentiation program. Nevertheless, our data revealed that many pathways critical for the execution of the terminal phase of erythroid differentiation are driven by the epigenetic alterations involving hypomethylation during this process.
TABLE 2.
Biological pathways that are hypomethylated and differentially expressed during erythroid differentiation
| Top functions | Score | Molecules in network |
|---|---|---|
| Amino acid metabolism, drug metabolism, molecular transport | 43 | AMOT, AMOTL1, ARG2 (includes EG:11847), ARHGAP8/PRR5-RHGAP8, CAMK1D, CAMK2G, DNM3, DPPA4, GOT1, IGFBP7, INVS, LY9, MAP4, MAPKAPK3, Pde, PDE4D, PDE6B, PDE8B, PDE9A, PTPRF, SH3BP4, SH3GL1, SH3GL3, SLC19A1, SMYD2, SNX24, TFAP2C, WBP2, WWOX, ZNF512B |
| Cell death, connective tissue development and function, cellular function and maintenance | 43 | AGTPBP1, ATXN7, EPHX2, ERG, FBLN2, FBN1, FoS, HAGH, KDM6A, KHK, LMNA, LTBP4, MLL3, NRL, PHB, PINX1, PKIB, RBM38, RTKN, RUNX1, SEPT9, SMYD3, STAC, SUPT3H, TFAP4, TK2, TMSB10/TMSB4X, TP63, ZNF239 |
| Cellular movement, inflammatory disease, neurological disease | 37 | ANXA4, APP, CAPN5, CCDC92, DEFA4, DLG3, DPYSL2, FAM86C1, FREM1, HK3, IL10RA, IL12A, IL2RA, KRT1, LRRC25, NLGN2, NMRAL1, NRXN3, PCYOX1, PLA2G1B, PLA2G4A, PLXNC1, PRKCE, PTK2B (includes EG:19229), RFTN1, SEMA7A, TGM2, TRAPPC9 |
| Infectious disease, DNA replication, recombination, and repair, gene expression | 36 | AKAP2/PALM2-AKAP2, CASQ1, CCND1, CDK20, DCAF4, DLC1, DNMT3A, DNMT3B, DTX3, FEM1A, HMP19, KANK2, MFSD6, MGMT, RNF43, SIK3, SP4, STK11, STK33, TRIM35, TRPM8, UBE2D4, UCHL3, USP7, USP15, USP18, USP40 |
| Cell morphology, hematological system development and function, hematopoiesis | 36 | ABCA2, ADA, ANK1, ANXA11, AQP1, ATPase, CD72, EHD2, EPOR, ETV6, GMPR, GYPA, IRF2, ITPR2, LYN, MACF1, MAPK13, MICAL2, OTUD5, PDIA6, PICK1, PLXND1, RHCE/RHD, SLC4A1, TBC1D23, TNFRSF19, TRAF3 |
High Resolution Analysis of Methylation Can Reveal Changes at Enhancers and Intronic Elements That Correlate with Transcription
Because a large proportion of differentially methylated regions were located in gene bodies, we next examined them at high resolution for genes that have been described as playing important roles in erythroid differentiation. For example, we examined the GATA1 (transcription factor) gene that is important during erythroid commitment and the SLC4A1 (anion transporter) gene that is expressed in relatively late stages of erythropoiesis. Examination of the GATA1 gene revealed a region in the promoter (Fig. 5A, green) and another intragenic region (Fig. 5A, blue) that underwent changes in methylation during erythroid differentiation. Interestingly, the c-Myc binding motifs are located within the promoter region as well as the intragenic region, where we saw these changes. Furthermore, in the intragenic region, we observed changes in methylation of GATA1 in highly conserved regions that contained a predicted binding site for PU.1, a master negative regulator of erythroid cell commitment and differentiation. We found that distinct regions of both the promoter and the intragenic sequences were initially hypermethylated on day 0 but became hypomethylated on day 3, the stage of commitment to erythroid lineage. Furthermore, the same regions maintained their hypomethylation as the cells continued to differentiate (Fig. 5A). Examining the expression pattern of GATA1 using our expression array data, we found that GATA1 transcription greatly increased (>40-fold) during the transition from CD34+ early hematopoietic cells to erythroid progenitor cells (Fig. 5B and supplemental Fig. 2), the time period when we observed hypomethylation in these distinct regions. Interestingly, during the final stages of differentiation (between days 13 and 16), as the GATA1 mRNA levels decreased, we observed remethylation of the intragenic differentially methylated region (DMR), whereas the promoter DMR remained demethylated (Fig. 5B and supplemental Fig. 2). Thus, our approach revealed a new intragenic region in the GATA1 gene locus that correlated very strongly with expression of this gene. This locus was a highly conserved region that was seen to be located directly on the binding site of the transcription factor, PU.1 (Fig. 5A and supplemental Fig. 2, red arrow). Analysis of recent PU.1 ChIP-Seq analysis in murine erythroid cells (14, 19) revealed that this region was the site of PU.1 binding, thus revealing it be a highly conserved site (Fig. 5C). We also tested for the ability of PU.1 to bind to this predicted region by qCHIP analysis. PU.1 CHIP was performed as described previously (14, 19), qPCR was done using primers designed against the intronic region, and we observed a significant enrichment for PU.1 binding in the erythroblast cells (Fig. 5D). From our transcriptomic data, we observed that PU.1 expression was found to decrease progressively during erythroid differentiation (Fig. 5E), and it has been shown previously that dissociation of PU.1 from the GATA1 locus triggers the start of erythroid lineage commitment (20, 21). Our data reveal that the intronic region may be the critical PU.1 binding region that plays a regulatory role in this process.
FIGURE 5.
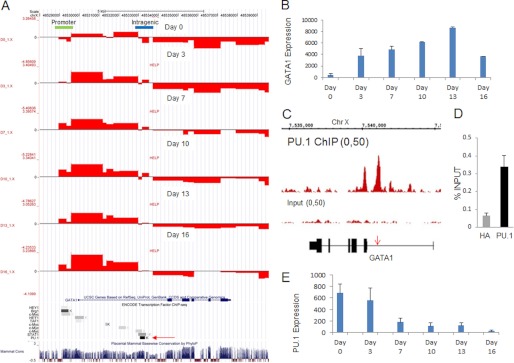
High resolution analysis of methylation can reveal changes in intragenic regions that correlate with changes in gene expression for GATA1. A, methylation is depicted as ratio of HpaII/MspI signals (red bars) with a negative value representing hypermethylation. Progressive hypomethylation of the promoter (green bar) and intragenic regions (blue bar) was observed during differentiation. The intragenic region in the GATA1 gene locus that correlated very strongly with expression is located in a highly conserved region in intron 1 that was located on the binding site of the transcription factor, PU.1, and c-Myc (red arrow). B, increase of GATA1 expression during the differentiation program (mean ± S.E. of normalized gene expression from two replicates). C, PU.1 ChIP-Seq performed in murine erythroblast cells indicated a peak at the same intragenic region in intron 1. The HA antibody was used as an isotype control (14). D, qChIP assay performed after PU.1 pull-down using primers designed against the intronic regions demonstrated enrichment of the intragenic region during early erythroid differentiation. E, progressive decrease in PU.1 expression (mean ± S.E. (error bars) of normalized gene expression from two replicates) observed during terminal erythroid differentiation.
We then examined another important erythroid specific gene, SLC4A1 (band 3), that plays a pivotal role in the transport of anions and cytoskeleton structure. Examination of the SLC4A1 (band 3) locus also revealed small DMRs in the promoter (green bar) and an intragenic region (blue bar) that were methylated in early stages and progressively became hypomethylated during the late stages of erythroid development (supplemental Fig. 3A). These significant changes in discrete regions of the SLC4A1 gene correlated well with the change in SLC4A1 gene expression (supplemental Fig. 3B). These two examples demonstrate the utility of high resolution approaches to uncover novel regulatory regions of genes important in functions associated with erythroid differentiation. A comprehensive analysis of the global methylome map of all genes from two independent experiments has been performed as part of this study and has been made available publicly.
DISCUSSION
Lineage commitment, proliferation, and terminal differentiation of human hematopoietic stem cells into reticulocytes are accompanied by widespread phenotypic changes involving nuclear condensation followed by enucleation. During erythroid differentiation, the stem cells express transcription factors and surface receptors that signify commitment to the erythroid lineage followed by gradual expression of a host of erythroid specific genes that lead to morphologic and functional characteristics synonymous with erythroid lineage. For example, during the early phase of development, these cells express EPOR, GATA1, transferrin receptor, spectrin, and globin chains. As the cells further develop into an erythroblast, genes associated with heme biosynthesis, transporters, globin chains, and cytoskeletal proteins are further up-regulated. The kinetics of expression of these genes is quite precise and occurs in a differentiation stage-specific manner. As these cells reach orthochromatic stage (late stages in the differentiation program), overall gene transcription is drastically reduced, and cells cease to proliferate as they complete the assembly of the erythrocyte membrane skeleton and undergo enucleation. The in vitro model utilized in our studies is capable of recapitulating the various stages of human erythroid development program over a 13–16-day time period in vitro (15–18). Using this dynamic culture system, we examined changes in methylation by high resolution methylome analysis of the genome at multiple time points during the entire differentiation program. Parallel gene expression experiments using RNA isolated from the same cultures allowed us to directly correlate changes in methylation with gene expression. We find that during lineage commitment and subsequent terminal maturation, the genome undergoes progressive genome wide hypomethylation.
The significance of these findings is far reaching because they challenge the current paradigm in assuming that hypermethylation is synonymous with cellular differentiation and down-regulation of gene transcription seen during red cell development. A very recent report has shown that global DNA hypomethylation occurs during murine erythropoiesis in vivo by directly isolating various erythroid progenitor populations from fetal livers (22). Our finding of progressive hypomethylation using a dynamic model of human adult erythroid differentiation is all the more surprising because the nucleus undergoes progressive condensation and extrusion in human erythroblasts and was believed to be increasingly methylated during this process. Conservation of this phenomenon not only across species but also during fetal erythropoiesis as well as during definitive erythropoiesis in adult stem and progenitor cells points to the importance of demethylation during the development of red cells. Our current findings demonstrate that although there are significant differences in terms of site(s) of erythropoiesis and the types of genes expressed during fetal and adult erythropoiesis, the shift toward hypomethylation of the genome during erythroid differentiation remains intact in embryonic as well as in the adult programs.
Several other recent studies lend support to the notion of demethylation of the genome during stem cell commitment and progressive differentiation along a particular lineage. A recent genome-wide study performed on sorted murine hematopoietic cell populations has shown that less global DNA methylation is observed during myeloid lineage commitment (that includes erythroid lineage) when compared with lymphoid commitment. This is also supported functionally by myeloid skewing of progenitors following treatment with DNA methyltransferase inhibitors (23). In another study, loss of methyltransferase DNMT1 has been shown to decrease hematopoietic stem cell numbers and increase myeloid cell cycling (24), thus reinforcing that loss of DNA methylation is associated with myeloid differentiation of stem cells.
The murine study that observed demethylation during erythroid differentiation speculated that the loss of methylation was related to rapid cell division seen during erythropoiesis (22) because the authors could not correlate demethylation with changes in gene expression. The studies using mouse hematopoietic cells faced the challenge of a compressed differentiation program (2–3 days) as opposed to the human program, which occurs over a 13–16-day time period. Therefore, using a well characterized human cell system provides the distinct advantage of allowing us the opportunity to dissect molecular changes precisely without overlap of each phase of the maturation program. Based on our findings using human cells, we find that hypomethylation is not random and is in fact enriched at discrete genomic locations. The demethylation occurs at a high frequency at transcription factor binding sites and other regulatory regions of the genome at specific stages of differentiation. Furthermore, changes at these sites correlate with changes in gene expression of corresponding genes. More importantly, the expression of numerous genes critical in erythroid differentiation correlates with changes in DNA methylation and suggests that these epigenetic changes are functionally significant.
Additionally, our study provides a high resolution map of the changes in DNA methylation during each step of erythropoiesis and reveals that there are small genomic areas that are most differentially demethylated and are likely to be important regulatory areas. We illustrate this by the example of the GATA1 gene locus, which has a small intronic area that undergoes demethylation during commitment of CD34+ early progenitors to the erythroid lineage and maintains this change throughout the differentiation program, which correlates well with the GATA1 gene expression profile. This area turns out be highly conserved across species that contain a binding site for the PU.1 transcription factor. PU.1 is an important regulator of hematopoietic differentiation and has been shown to decrease during erythroid development. PU.1 has been shown to recruit DNA methyltransferases to enable site-specific methylation (25), and it is conceivable that the dissociation of PU.1 seen during erythroid differentiation (14, 21) may have triggered the loss of methylation at this locus. Furthermore, the intronic area where we observe differential methylation is located in intron 1, which is an important regulatory area based on the fact that a previous study had shown that deletion of this intron leads to decreased expression of GATA1 (26).
The two examples (GATA1 and SLC4A1) we have used to illustrate the potential importance of epigenetic changes during erythroid differentiation also provide insight into the dynamic nature of these changes. The fact that initiation of hypomethylation of GATA1 (early stage) and SLC4A1 (late stage) genes coincides with expression of transcripts for each of these genes suggests that epigenetic alterations and gene expression are precisely timed events. Therefore, utilizing a model where the kinetics of differentiation can be orchestrated in a relatively synchronous manner, one can appreciate the regulatory circuits that exist within the cells to initiate transcription only at the appropriate time during the differentiation program. Altogether, this study provides a comprehensive analysis of methylation changes together with gene expression profiling during commitment and terminal differentiation of human stem/early hematopoietic progenitors into reticulocytes.
Acknowledgments
We thank Jodie Ulaszek and the personnel at the University of Chicago Flow Cytometry Core Facility for technical assistance.
This work was supported, in whole or in part, by National Institutes of Health Grant R01HL116336 (to A. V. and A. W.) and Partnership for Cures and Immunooncology Training Program Grant T32 (National Institutes of Health) CA009173 (to A. V.). This work was also supported by the Leukemia and Lymphoma society (to A. V. and A. W.), the Department of Defense (to A. V.), the Giving Tree Foundation (to A. W.), the Searle Family Fund (Chicago Biomedical Consortium) (to A. W.), and the William Deputy Memorial Fund (to A. W. and A. A.).

This article contains supplemental Tables 1 and 2 and Figs. 1–3.
Data deposition: The data reported in this paper have been deposited in the Gene Expression Omnibus (GEO) database, www.ncbi.nlm.nih.gov/geo (accession no. GSE44054).
- HELP
- HpaII tiny fragment enrichment by ligation-mediated PCR
- TFBS
- transcription factor binding site(s)
- DMR
- differentially methylated region
- qChIP
- quantitative ChIP
- ChIP-Seq
- ChIP-sequencing
- EPO
- erythropoietin
- SCF
- stem cell factor.
REFERENCES
- 1. Esteller M. (2003) Cancer epigenetics. DNA methylation and chromatin alterations in human cancer. Adv. Exp. Med. Biol. 532, 39–49 [DOI] [PubMed] [Google Scholar]
- 2. Figueroa M. E., Lugthart S., Li Y., Erpelinck-Verschueren C., Deng X., Christos P. J., Schifano E., Booth J., van Putten W., Skrabanek L., Campagne F., Mazumdar M., Greally J. M., Valk P. J., Löwenberg B., Delwel R., Melnick A. (2010) DNA methylation signatures identify biologically distinct subtypes in acute myeloid leukemia. Cancer Cell 17, 13–27 [DOI] [PMC free article] [PubMed] [Google Scholar]
- 3. Khulan B., Thompson R. F., Ye K., Fazzari M. J., Suzuki M., Stasiek E., Figueroa M. E., Glass J. L., Chen Q., Montagna C., Hatchwell E., Selzer R. R., Richmond T. A., Green R. D., Melnick A., Greally J. M. (2006) Comparative isoschizomer profiling of cytosine methylation. The HELP assay. Genome Res. 16, 1046–1055 [DOI] [PMC free article] [PubMed] [Google Scholar]
- 4. Thompson R. F., Reimers M., Khulan B., Gissot M., Richmond T. A., Chen Q., Zheng X., Kim K., Greally J. M. (2008) An analytical pipeline for genomic representations used for cytosine methylation studies. Bioinformatics 24, 1161–1167 [DOI] [PMC free article] [PubMed] [Google Scholar]
- 5. Arai E., Kanai Y. (2010) Genetic and epigenetic alterations during renal carcinogenesis. Int. J. Clin. Exp. Pathol. 4, 58–73 [PMC free article] [PubMed] [Google Scholar]
- 6. Baldewijns M. M., van Vlodrop I. J., Schouten L. J., Soetekouw P. M., de Bruïne A. P., van Engeland M. (2008) Genetics and epigenetics of renal cell cancer. Biochim. Biophys. Acta 1785, 133–155 [DOI] [PubMed] [Google Scholar]
- 7. Irizarry R. A., Ladd-Acosta C., Wen B., Wu Z., Montano C., Onyango P., Cui H., Gabo K., Rongione M., Webster M., Ji H., Potash J. B., Sabunciyan S., Feinberg A. P. (2009) The human colon cancer methylome shows similar hypo- and hypermethylation at conserved tissue-specific CpG island shores. Nat. Genet. 41, 178–186 [DOI] [PMC free article] [PubMed] [Google Scholar]
- 8. Ball M. P., Li J. B., Gao Y., Lee J. H., LeProust E. M., Park I. H., Xie B., Daley G. Q., Church G. M. (2009) Targeted and genome-scale strategies reveal gene-body methylation signatures in human cells. Nat. Biotechnol. 27, 361–368 [DOI] [PMC free article] [PubMed] [Google Scholar]
- 9. Alvarez H., Opalinska J., Zhou L., Sohal D., Fazzari M. J., Yu Y., Montagna C., Montgomery E. A., Canto M., Dunbar K. B., Wang J., Roa J. C., Mo Y., Bhagat T., Ramesh K. H., Cannizzaro L., Mollenhauer J., Thompson R. F., Suzuki M., Meltzer S., Melnick A., Greally J. M., Maitra A., Verma A. (2011) Widespread hypomethylation occurs early and synergizes with gene amplification during esophageal carcinogenesis. PLoS Genet. 7, e1001356. [DOI] [PMC free article] [PubMed] [Google Scholar]
- 10. Oda M., Glass J. L., Thompson R. F., Mo Y., Olivier E. N., Figueroa M. E., Selzer R. R., Richmond T. A., Zhang X., Dannenberg L., Green R. D., Melnick A., Hatchwell E., Bouhassira E. E., Verma A., Suzuki M., Greally J. M. (2009) High-resolution genome-wide cytosine methylation profiling with simultaneous copy number analysis and optimization for limited cell numbers. Nucleic Acids Res. 37, 3829–3839 [DOI] [PMC free article] [PubMed] [Google Scholar]
- 11. Figueroa M. E., Reimers M., Thompson R. F., Ye K., Li Y., Selzer R. R., Fridriksson J., Paietta E., Wiernik P., Green R. D., Greally J. M., Melnick A. (2008) An integrative genomic and epigenomic approach for the study of transcriptional regulation. PloS One 3, e1882. [DOI] [PMC free article] [PubMed] [Google Scholar]
- 12. Figueroa M. E., Wouters B. J., Skrabanek L., Glass J., Li Y., Erpelinck-Verschueren C. A., Langerak A. W., Löwenberg B., Fazzari M., Greally J. M., Valk P. J., Melnick A., Delwel R. (2009) Genome-wide epigenetic analysis delineates a biologically distinct immature acute leukemia with myeloid/T-lymphoid features. Blood 113, 2795–2804 [DOI] [PMC free article] [PubMed] [Google Scholar]
- 13. Heinz S., Benner C., Spann N., Bertolino E., Lin Y. C., Laslo P., Cheng J. X., Murre C., Singh H., Glass C. K. (2010) Simple combinations of lineage-determining transcription factors prime cis-regulatory elements required for macrophage and B cell identities. Mol. Cell 38, 576–589 [DOI] [PMC free article] [PubMed] [Google Scholar]
- 14. Wontakal S. N., Guo X., Will B., Shi M., Raha D., Mahajan M. C., Weissman S., Snyder M., Steidl U., Zheng D., Skoultchi A. I. (2011) A large gene network in immature erythroid cells is controlled by the myeloid and B cell transcriptional regulator PU.1. PLoS Genet. 7, e1001392. [DOI] [PMC free article] [PubMed] [Google Scholar]
- 15. Wickrema A., Crispino J. D. (2007) Erythroid and megakaryocytic transformation. Oncogene 26, 6803–6815 [DOI] [PubMed] [Google Scholar]
- 16. Yamamoto M. L., Clark T. A., Gee S. L., Kang J. A., Schweitzer A. C., Wickrema A., Conboy J. G. (2009) Alternative pre-mRNA splicing switches modulate gene expression in late erythropoiesis. Blood 113, 3363–3370 [DOI] [PMC free article] [PubMed] [Google Scholar]
- 17. Kang J. A., Zhou Y., Weis T. L., Liu H., Ulaszek J., Satgurunathan N., Zhou L., van Besien K., Crispino J., Verma A., Low P. S., Wickrema A. (2008) Osteopontin regulates actin cytoskeleton and contributes to cell proliferation in primary erythroblasts. J. Biol. Chem. 283, 6997–7006 [DOI] [PMC free article] [PubMed] [Google Scholar]
- 18. Uddin S., Ah-Kang J., Ulaszek J., Mahmud D., Wickrema A. (2004) Differentiation stage-specific activation of p38 mitogen-activated protein kinase isoforms in primary human erythroid cells. Proc. Natl. Acad. Sci. U.S.A. 101, 147–152 [DOI] [PMC free article] [PubMed] [Google Scholar]
- 19. Wontakal S. N., Guo X., Smith C., MacCarthy T., Bresnick E. H., Bergman A., Snyder M. P., Weissman S. M., Zheng D., Skoultchi A. I. (2012) A core erythroid transcriptional network is repressed by a master regulator of myelo-lymphoid differentiation. Proc. Natl. Acad. Sci. U.S.A. 109, 3832–3837 [DOI] [PMC free article] [PubMed] [Google Scholar]
- 20. Rekhtman N., Choe K. S., Matushansky I., Murray S., Stopka T., Skoultchi A. I. (2003) PU.1 and pRB interact and cooperate to repress GATA-1 and block erythroid differentiation. Mol. Cell. Biol. 23, 7460–7474 [DOI] [PMC free article] [PubMed] [Google Scholar]
- 21. Stopka T., Amanatullah D. F., Papetti M., Skoultchi A. I. (2005) PU.1 inhibits the erythroid program by binding to GATA-1 on DNA and creating a repressive chromatin structure. EMBO J. 24, 3712–3723 [DOI] [PMC free article] [PubMed] [Google Scholar]
- 22. Shearstone J. R., Pop R., Bock C., Boyle P., Meissner A., Socolovsky M. (2011) Global DNA demethylation during mouse erythropoiesis in vivo. Science 334, 799–802 [DOI] [PMC free article] [PubMed] [Google Scholar]
- 23. Ji H., Ehrlich L. I., Seita J., Murakami P., Doi A., Lindau P., Lee H., Aryee M. J., Irizarry R. A., Kim K., Rossi D. J., Inlay M. A., Serwold T., Karsunky H., Ho L., Daley G. Q., Weissman I. L., Feinberg A. P. (2010) Comprehensive methylome map of lineage commitment from haematopoietic progenitors. Nature 467, 338–342 [DOI] [PMC free article] [PubMed] [Google Scholar]
- 24. Trowbridge J. J., Snow J. W., Kim J., Orkin S. H. (2009) DNA methyltransferase 1 is essential for and uniquely regulates hematopoietic stem and progenitor cells. Cell Stem Cell 5, 442–449 [DOI] [PMC free article] [PubMed] [Google Scholar]
- 25. Suzuki M., Yamada T., Kihara-Negishi F., Sakurai T., Hara E., Tenen D. G., Hozumi N., Oikawa T. (2006) Site-specific DNA methylation by a complex of PU.1 and Dnmt3a/b. Oncogene 25, 2477–2488 [DOI] [PubMed] [Google Scholar]
- 26. Seshasayee D., Geiger J. N., Gaines P., Wojchowski D. M. (2000) Intron 1 elements promote erythroid-specific GATA-1 gene expression. J. Biol. Chem. 275, 22969–22977 [DOI] [PubMed] [Google Scholar]