

Background: Focal adhesion kinase (FAK) activation is essential for cell migration.
Results: A toolbox of FRET sensors demonstrate that a key regulatory interaction in FAK is sensitive to pH.
Conclusion: FAK is a pH sensor with maximal activity at cancer cell pH.
Significance: This is a broadly applicable approach to studying the effects of modulating individual protein-protein interactions in live cells.
Keywords: Cancer, Cell Migration, Fluorescence Resonance Energy Transfer (FRET), Focal Adhesion Kinase, pH Regulation
Abstract
Focal Adhesion Kinase (FAK) is essential for cell migration and plays an important role in tumor metastasis. However, the complex intermolecular and intramolecular interactions that regulate FAK activity at the focal adhesion remain unresolved. We have engineered a toolbox of FRET sensors that retain all of the individual FAK domains but modulate a key intramolecular regulatory interaction between the band 4.1/ezrin/radixin/moesin (FERM) and kinase domains of FAK. We demonstrate systematic control and quantitative measurement of the FERM-kinase interaction at focal adhesions, which in turn allows us to control cell migration. Using these sensors, we find that Tyr-397 phosphorylation, rather than kinase activity of FAK, is the key determinant of cell migration. Our sensors directly demonstrate, for the first time, a pH-dependent change in a protein-protein interaction at a macromolecular structure in live cells. The FERM-kinase interaction at focal adhesions is enhanced at acidic pH, with a concomitant decrease in Tyr-397 phosphorylation, providing a potential mechanism for enhanced migration of cancer cells.
Introduction
The focal adhesion is a macromolecular structure with a large network of interacting proteins (1). Within the focal adhesion, proteins such as focal adhesion kinase (FAK)2 and PKC act as signaling “hubs” in the interaction network (1). These multidomain proteins coordinate several intra- and intermolecular protein interactions that are essential for normal cellular signaling initiated at the focal adhesion (2, 3). Although traditional biochemical and cell biological approaches have yielded detailed insights into the individual interactions (4), little is known about the spatial and temporal coordination of these interactions in live cells.
A key event in FAK activation is the phosphorylation of residue Tyr-397 (5). Tyr-397 phosphorylation is necessary for Src binding to FAK, an essential step in promoting cell migration (5). Accordingly, FAK overexpression and Tyr-397 phosphorylation correlate with an invasive phenotype in tumors (6). The FERM domain of FAK is located N-terminally to its kinase domain and contains the Tyr-397 phosphorylation site (7). It is suggested that the FERM domain also has an autoinhibitory effect on the kinase domain by masking the kinase active site (7). At the focal adhesion, the autoinhibitory effect of the FERM domain is thought to be released by interactions with other focal adhesion molecules (e.g. β-integrin (8), phospholipids (9, 10), Arp3 (11), paxillin (12), and talin (13)) that “open” the molecule, resulting in increased Tyr-397 phosphorylation (8). However, studies using FRET-based sensors to detect the conformational changes in FAK at focal adhesions have provided conflicting results (14, 15). Cai et al. (14) detected a decrease in FRET between the FERM and kinase domains following translocation of FAK to the focal adhesion. In contrast, Papusheva et al. (15) found an increase in FRET with a very similar sensor design. The opposing FRET responses of these sensors have been attributed to changes in fluorophore orientation that stem from small differences in sensor design (15). Therefore, the conformation and regulation of FAK at focal adhesions still remains unresolved.
In this model of FAK function at focal adhesions, kinase activity and Tyr-397 phosphorylation are considered to be synonymous in cell migration, but their relative importance has not yet been evaluated (7). The need to separate the functional consequences of these two effects is underscored by the emergence of FAK inhibitors that target either kinase activity (16–18) or mask the Tyr-397 residue (19). The problem is further complicated by the fact that although Tyr-397 is structurally associated with the FERM domain (7), kinase activity is typically measured using an exogenous substrate (e.g. E4Y1) (20, 21). Therefore, kinase activity alone may not be an accurate indicator of the ability of the kinase to phosphorylate Tyr-397.
Although FAK overexpression (22–24) and Tyr-397 phosphorylation levels (25, 26) have been shown to be important indicators of the metastatic potential of cancer cells, the mechanisms that result in variable Tyr-397 phosphorylation levels in different cancer cell lines is unknown. It has been suggested previously that altered cellular pH gradients, resulting from the altered physiology of cancer cells, could play a role in controlling protein conformation and function, ultimately contributing to a cancerous phenotype (27). Alternately, changes in the macromolecular structure of the focal adhesion can alter FAK interactions, in turn influencing Tyr-397 phosphorylation (11). Increased knowledge of such mechanisms are likely to lead to better and more specific suppression of Tyr-397 phosphorylation, in turn targeting cell migration in cancer.
In this study, we derive insights into these important questions with a toolbox of FAK FRET sensors engineered using a new technique, systematic protein affinity strength modulation (SPASM), that probes specifically for changes in the affinity of interaction between two proteins or protein domains in live cells (28). The SPASM sensors retain all domains of native FAK and control the interaction between the FERM and kinase domains with a genetically encoded ER/K linker, the length of which controls the strength of interaction between the FERM and kinase domains. We report that unlike conventional FRET sensors, the SPASM sensor consistently and quantitatively detects the effects of mutations that are known to alter FAK activity (7, 29). The SPASM sensors are engineered to reverse the relationship between the kinase activity and Tyr-397 phosphorylation compared with native FAK. This design allows us to demonstrate that Tyr-397 phosphorylation, rather than kinase activity, is the important determinant for cell migration. Our SPASM sensors, with matched controls, allow for quantitative measurement of the effects of environmental variables like pH on the FERM-kinase interaction. Using these sensors, we quantitatively demonstrate that the FERM-kinase interaction at focal adhesions is enhanced at acidic pH with concomitant reduction in Tyr-397 phosphorylation. Our findings suggest a potential mechanism by which cancer cells stimulate Tyr-397 phosphorylation, independent of FAK overexpression, to provide enhanced cellular migration, which is a hallmark of tumorigenesis.
EXPERIMENTAL PROCEDURES
Constructs
FAK from Gallus gallus (1053 amino acids) was used as a template to perform PCR on the FERM (amino acids 1–409) and kinase-FAT (amino acids 410–1053) domains and full-length wild-type FAK. All constructs contain an N-terminal FLAG tag immediately followed by mCitrine. In sequence behind the mCitrine are the FERM domain, a TEV-protease site (ENLYFQ), ER/K α-helix linker (or Gly-Ser-Gly linker in the case of FAK 0), mCerulean, and the kinase and FAT domains. All domains and fluorophores are linked with three to four [Gly-Ser-Gly] repeats to allow rotational flexibility and are cloned between unique restriction sites. Mutations were generated by either quick-change PCR or were incorporated in the original PCR primers. Affinity mutations used were Y180A+M183A and R28S+K38A. pH affinity mutations were H58A and E466A. Mutations directly affecting enzyme activity were K454R (kinase-dead) (29) and Y397F. Constructs used for sf9 cell expression were cloned between unique restriction sites in the pBiex1 vector. Recombinant protein used for fluorescence measurements in Figs. 1 and 5 feature the Y397F mutation. Mammalian cells were transfected with constructs cloned between unique restriction sites in the pcDNA/FRT vector.
FIGURE 1.
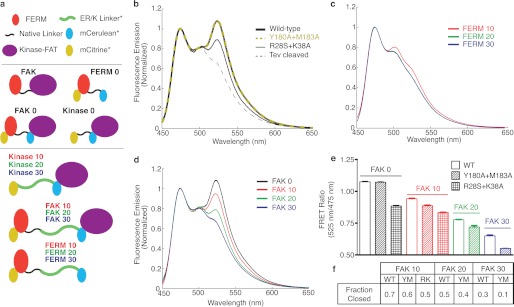
Comparison of conformational and SPASM sensors. a, schematic of sensors used in this work. SPASM sensors consist of a single polypeptide with (N to C terminus) mCitrine, a FERM domain with a native linker (amino acids 1–409), an ER/K α-helix linker, mCerulean, and kinase and FAT domains (KFAT, amino acids 409–1053). Three ER/K linkers with lengths of 10, 20, and 30 nm were used. FAK 0 does not contain an ER/K linker (conformational sensor). Protein domains are separated by three to four Gly-Ser-Gly linkers. b, FRET emission spectra (430-nm excitation) of purified FAK 0 sensor containing FERM domain mutations. Y180A+M183A directly overlays with FAK 0 (e). TEV cleavage cuts a predesigned site between the FERM domain and mCerulean. c, purified protein FRET emission spectra (430-nm excitation) of FERM 10, 20, and 30 display no significant FRET. FERM 20 and FERM 30 overlay almost directly. d, FRET emission spectra of FAK 0, 10, 20, and 30 (compare with controls in c). e, FRET ratios (mCitrine/mCerulean, 525 nm/475 nm) for wild-type and mutant (Y180A+M183A (YM); R28S+K38A (RK)) sensors. f, relative fraction of protein in the “closed,” high-FRET conformation as compared with the controls in c (for calculation, see “Experimental Procedures”).
FIGURE 5.

Effect of pH on the interaction between the FERM and kinase domains. a, FRET emission spectra (430-nm excitation) of FAK 0 with paired control FERM 0 at pH 5. 85 and 7.5. b, FRET ratio (mCitrine/mCerulean (mCit/mCer), 525 nm/475 nm) change with pH for FAK 0 and FERM 0. c, FRET emission spectra (430-nm excitation) of FAK 10 with paired control FERM 10 at pH 5.85 and 7.5. d, FRET ratio (mCit/mCer, 525 nm/475 nm) change with pH for FAK 10 and FERM 10. Note that the sharp increase in FRET correlates with the pKa of the histidine side chain (pH ∼6.0). e, the fraction of the FAK 10 wild type and the H58A and E466A mutant sensors in the closed conformation at the indicated pH relative to pH 7.5 (fpHx/fpH7.5). f, FRET emission spectra (430-nm excitation) of FAK 0 and FAK 10 constructs containing the R28S+K38A mutation.
Insect Cell Culture and Protein Purification
sf9 cells were cultured in sf900-II medium (Invitrogen) with 1% antibiotic-antimycotic (Invitrogen). Cells were incubated with shaking at 28 °C. Constructs were transiently transfected into sf9 cells using Escort IV transfection reagent (Sigma-Aldrich) in antibiotic-free medium. Cells were lysed 3 days post-transfection in HEPES lysis buffer (0.5% IGEPAL, 4 mm MgCl2, 200 mm NaCl, 7% sucrose, 20 mm HEPES (pH 7.5), 5 mm DTT, 50 μg/ml PMSF, 5 μg/ml aprotinin, 5 μg/ml leupeptin). Lysates were clarified by ultracentrifugation (200,000 × g, 4 °C, 45 min) and bound to anti-FLAG M2 affinity gel (Sigma-Aldrich). Gel was washed with HEPES wash buffer (150 mm KCl, 20 mm HEPES (pH 7.5), 5 mm MgCl2) and eluted using FLAG peptide. Protein was desalted using Zeba Spin desalting columns (Pierce) into desalting buffer (5 mm HEPES (pH 7.5), 0.1 mm EDTA, 2 mm MgCl2) for pH measurements or 50 mm HEPES (pH 7.5), 0.1 mm EDTA, and 2 mm MgCl2 for all other purposes.
Fluorometer Data Acquisition
Data were acquired on a FluoroMax-4 fluorometer (Horiba Scientific). FRET spectra were generated by exciting samples at 430 nm (spectral band pass, 8 nm), and emission was scanned from 450–650 nm (band pass, 4 nm). For mCitrine-only measurements, samples were excited at 490 nm (band pass, 8 nm), and emission was scanned from 500–650 nm (band pass, 4 nm). In vitro data were collected using a concentration of ∼50 nm on the basis of mCitrine fluorescence (extinction coefficient, ∼77,000 M/cm). Measurements were taken in 50 mm HEPES with the pH adjusted to the desired level with KOH. All samples also contain 0.05 mg/ml BSA to limit nonspecific surface adsorption of sensor proteins. Cellular pH was manipulated using nigericin, as described previously (30). Briefly, for live cell measurements, HeLa cells were trypsinized and washed twice with PBS to remove phenol red. Cells were then washed in Tris/MES high-potassium buffer (140 mm KCl, 1 mm MgCl2, 2 mm CaCl2, 5 mm dextrose plus either 20 mm Tris base or 20 mm MES and titrated to the desired pH by adding proportionally more of either the Tris base salt solution or MES salt solution) (30). Cells were incubated in Tris/MES high-potassium buffer for 30 min with 2 μg/ml nigericin at room temperature (30).
Kinase Assay
Kinase assays were performed in a volume of 120 μl and assayed for activity using a Kinase-Glo Max luminescence assay kit (Promega). Tubes contained a concentration of 0.05 mg/ml BSA to limit nonspecific adsorption of protein to surfaces. The assay buffer was 50 mm HEPES (at either pH 7.5 or 5.85) containing 2 mm MnCl2, a 1:1000 dilution of phosphatase inhibitor mixture II (Sigma-Aldrich), 5 μg/ml aprotinin, and 5 μg/ml leupeptin. The substrate used was poly(Glu, Tyr) sodium salt (Glu-4:Tyr-1, molecular mass 20,000–50,000 Da, Sigma-Aldrich) at a concentration of 166 μg/ml. ATP was added to start the reaction at a final concentration of 100 μm. Reactions were divided into 30-μl aliquots and halted by the addition of an equal volume of Kinase-Glo reagent. Activity was measured by luciferase activity as read by a 96-well plate reader (Synergy 2, BioTek).
ATP Autophosphorylation Assay
For the ATP/phosphatase reactions, phosphorylation was performed in the same buffer as the kinase assay, without phosphatase inhibitors, and with E4Y1 peptide. 10 units of calf intestinal phosphatase (New England Biolabs) were used to abolish phosphorylation. Reactions were performed at 30 °C for 30 min and stopped by addition of SDS Laemmli sample buffer.
TEV Immunoprecipitation
Purified FAK constructs bound to FLAG resin were washed three times into 5 mm HEPES (pH 7.5) + 100 mm NaCl, 0.1 mg/ml BSA, and protease inhibitors (as above). Samples were incubated overnight at 4 °C with TEV protease in ∼100 μl volume to cleave at the TEV-specific site between the FERM and kinase-FAT domains. 1 ml of 50 mm HEPES at either pH 5.85 or 7.5 was added with NaCl and BSA (as above), and the resin was incubated on ice for 10 min. Samples were washed three times with 50 mm HEPES buffer at the corresponding pH before being eluted by addition of 400 mm NaCl (final, 500 mm NaCl) in a volume of ∼100 μl. Samples were normalized to mCitrine fluorescence on the basis of fluorometer readings of mCitrine excitation. Gels were imaged for fluorescence using a Typhoon gel imager (GE Healthcare) and analyzed using ImageJ (National Institutes of Health).
Mammalian Cell Culture and Transfection
HeLa cells were cultured in culture medium (DMEM supplemented with 10% FBS, 4.5 g/liter D-glucose, 1% Glutamax, 20 mm HEPES (pH 7.5) and 1% antibiotic-antimycotic) and incubated at 37 °C at 5% CO2. Constructs were transfected into HeLa cells using FuGENE HD (Promega) in medium without antibiotics. 3T3 Flp-in and CHO Flp-in cell lines stably expressing the FAK sensors were generated and propagated in accordance with the protocol of the manufacturer (Invitrogen). Stable lines were cultured in culture medium supplemented with 200 μg/ml hygromycin (Invitrogen) as the selection reagent.
Cell Migration Assay
The wound-healing assay was performed as described previously (31). Briefly, HeLa cells were transfected as described above. Two days post-transfection, cells were trypsinized, washed in culture medium, and ∼450,000 cells were replated on fibronectin-coated 35-mm glass bottom dishes (MatTek Corp.). Cells were allowed to adhere for ∼2 h before a wound was created with a 10-μl gel-loading pipette tip. Two parallel wounds separated by ∼260 μm were created per plate. Plates were incubated at 37 °C in serum-free culture medium supplemented with 0.5% FBS. Cell migration was imaged ∼8 h after the wound was created. Cell migration was analyzed using ImageJ (National Institutes of Health) by calculating the average width of the gap (total area of the wound with confluent sides divided by the length of that area).
Live Cell Fluorescence Imaging
Cells were imaged at ×60 magnification using a Nikon TiE microscope equipped with a mercury arc lamp, ×63 and 100 × 1.4 Numerical Aperture Plan-Apo oil objectives, and a Dual-View filter setup (Photometrics) for simultaneous acquisition of mCerulean and mCitrine fluorescence on an Evolve 512 × 512 EM-Charge-Coupled-Device camera (Photometrics). Cells were imaged on 35 mm glass bottom dishes (MatTek Corp) coated with 10 μg/ml fibronectin for either 2 h at room temperature or overnight at 4 °C. Cells were plated on fibronectin and allowed to spread for ∼ 2 h before imaging. For experiments with manipulation of cellular pH, cells were trypsinized and washed in culture medium with trypsin inhibitor (soybean trypsin inhibitor, Sigma) prior to being plated. Plated cells were washed with PBS to remove excess phenol red immediately prior to imaging. Cells were imaged in PBS supplemented with 5 mm dextrose. For imaging cells under varying pH levels, cells were plated as above but washed twice with PBS and washed once with Tris/MES high-potassium buffer at the desired pH. Nigericin in 100% ethanol was added to a final concentration of 2 μg/ml (<0.08% ethanol) in 3 ml of medium and incubated for 30 min at room temperature prior to imaging.
Image Analysis
Images were analyzed using custom software in Matlab (Mathworks, Inc.). Briefly, images were subjected to a background threshold/subtraction and selected for well defined, in-focus, peripheral focal adhesions. FRET ratios were acquired by overlaying mCitrine and mCerulean emission images using the thresholded images as a mask.
Western Blotting
Lysates were prepared from stably expressing CHO and 3T3 cells and transiently transfected HeLa cells. For fibronectin lysis, cells were allowed to adhere for ∼2 h to glass-bottom dishes precoated with fibronectin at a concentration of 10 μg/ml (see above). Cells lysed in suspension were trypsinized, washed with medium to remove trypsin, and rotated at 37 °C for 1 h with medium containing trypsin inhibitor (Sigma) at a concentration of 1 mg/ml. All cells were washed in cold HEPES-buffered saline and lysed with a modified radioimmune precipitation assay buffer (50 mm HEPES (pH 7.5), 150 mm NaCl, 10% glycerol, 1.5 mm MgCl2, 1 mm EGTA, 1:100 phosphatase inhibitor mixture II (Sigma-Aldrich), 1% Triton X-100, 1% deoxycholate, 0.1% SDS and containing 10 μg/ml aprotinin, 10 μg/ml leupeptin, and 1 mm PMSF) on ice. Lysates were syringed with a 26-gauge needle and clarified by spinning at 16,000 × g (10 min, 4 °C). Lysates were separated on 10% polyacrylamide/SDS gels and scanned for fluorescence on a Typhoon gel imager (GE Healthcare) before being transferred to PVDF membranes for 3 h at 300 mA. Blots were blocked with 5% milk/TBS + 0.1% Tween (TBST) for 1 h. Primary phospho-FAK (Tyr-397) antibody (catalog no. SC-11765-R, Santa Cruz Biotechnology, Inc.) was used at a concentration of 1:1000 in 2% BSA/TBST and incubated overnight at 4 °C. Blots were washed with TBST (3 × 10 min) before addition of secondary antibody (goat anti-rabbit (Jackson ImmunoResearch Laboratories, Inc., 1:5000 in 5% milk/TBST) and incubated at room temperature for 1 h. Blots were washed again with TBST (3 × 10 min) and developed using Immobilon Western chemiluminescent HRP substrate (Millipore). Blots were either imaged using film or using a ChemiDoc-it imaging system (UVP) with no discernible difference in quality of signal. Blots were stripped with Restore PLUS Western stripping buffer (Thermo Scientific) and reblotted with c-20 anti-FAK antibody (catalog no. sc558, Santa Cruz Biotechnology Inc.) under similar conditions (1:1000, 5% milk/TBST) and developed as above. Blot quantitation was performed using ImageJ (National Institutes of Health), and a statistical analysis was performed with GraphPad Prism (GraphPad Software). The chemiluminescent signal was normalized to either the fluorescent signal from the scanning of the gel or from reblotting with c-20 antibody (see above).
Interaction with Paxillin and Grb7
Two plates of confluent cells (Grb7 from HeLa cells and paxillin from 3T3 cells) were lysed per condition using a 1% IGEPAL, 20 mm HEPES, 0.5 mm EDTA, 0.5 mm EGTA, 137 mm NaCl lysis buffer with protease inhibitors (as above). Lysates were otherwise prepared as above. Lysates were passed over purified FAK constructs (from sf9 culture bound to FLAG resin) for 2 h at 4 °C with rotation. Samples were washed three times with the same buffer and eluted by drawing off the supernatant from the resin and released using 1× Laemmli sample buffer. Sample volumes were normalized to fluorescence on the basis of fluorescent gel scans. Both gels were transferred and immunoblotted as above (Grb7, rabbit polyclonal, Santa Cruz Biotechnology, Inc.; paxillin, mouse monoclonal, BD Biosciences).
Fraction of Sensors in the Closed Conformation (fc)
We have reported previously that the FRET ratio of SPASM sensors is linearly proportional to fc (28),
where Robs is the measured FRET ratio, RLow is the matched low FRET control (kinase 10–30 or FERM 10–30), and RHigh is the high FRET control (no ER/K linker, FAK 0). Equation 1 was used to directly calculate fc, with appropriate low and high FRET control ratios (Fig. 1f).
Relative Fraction of Sensors in the Closed Conformation (fpHx/fpH7.5)
This metric is designed to quantify the effect of pH on the protein interaction within the SPASM sensor. Consider a donor-acceptor pair with quantum yields QD (donor) and QA (acceptor) and FRET efficiency (E). For N photons absorbed by the donor, the donor emission is NQD(1-E), and the acceptor emission is NQDQAE. The FRET ratio is therefore as follows.
The FRET efficiency is defined as E = ro6 / (ro6 + r6) with Förster's radius ro (ro6 = CQDκ2n−4J). r is the distance between fluorophores, C is a constant, κ quantifies the relative orientation of fluorophores dipoles, n is the refractive index of the medium, and J is the overlap integral that describes the degree of spectral overlap between donor emission and acceptor absorbance (32). Substituting E and ro into Equation 2:
Further, Robs for SPASM sensors is linearly proportional to ff (28). Therefore,
For a control sensor, we assume that Cκ2n−4J/r6 is not affected by pH. This assumption is supported by the fact that the helicity of the ER/K linker is not affected over a broad range of pH (4–9, 33). Further, assuming that fluorophore distance and relative orientation, and therefore the term (Cκ2n−4J/r6) in the closed state of the SPASM sensor is not affected by pH, Equation 4 yields
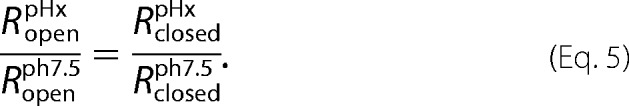 |
Combining Equations 4 and 5, we derive
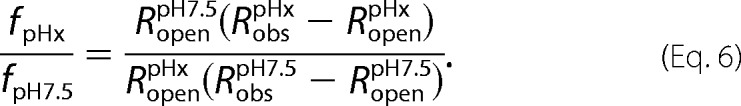 |
Using Equation 6 and measured values for Robs and Ropen (matched control) at two different pH values, we can directly quantify the changes in interaction strength both in vitro and in vivo as a function of pH (Figs. 5e, 6j, and 7a).
FIGURE 6.

Measuring the effects of pH on the FERM-kinase interaction at the focal adhesion. a–d, mCerulean (Cer) images of live HeLa cells expressing either FAK 30 or matched focal adhesion-localized control kinase 30 at either pH 7. 5 or 5.85. Cit, mCitrine. e–h, ratiometric FRET images for cells in a–d. For all FRET images, blue to red = low to high FRET (see inset heatmap for range). i, quantification of live cell imaging data for indicated sensors/pH (ratio averaged across cells, n ≥ 20 cells/condition, at least three independent experiments). The inset (j) represents the fraction of FAK 30 sensors in the closed conformation at pH 5.85 compared with pH 7.5. ***, p < 0.001.
FIGURE 7.

Measuring the effect of pH on the FERM-kinase interaction and Tyr-397 phosphorylation. a, the fraction of sensors in the closed conformation in live HeLa cells at the indicated pH relative to pH 7. 5 (fpHx/fpH7.5). b, representative anti-pTyr-397 immunoblot analysis for FAK 0 and FAK 30 at pH 7.5 and 5.85. Sensor levels (FAK) were assessed using a fluorescence gel scan before anti-pTyr-397. Immunoblotting with anti-FAK produced indistinguishable results. c, quantification of data pTyr-397 relative to total FAK (mean ± S.E., at least three independent experiments). d, representative anti-pTyr-397 immunoblot analysis for overexpressed wild-type FAK and H58A FAK at pH 7.5 and 5.85. e, quantification of data comparing the pTyr-397 levels of WT FAK and H58A FAK at pH 7.5.
Statistical Analysis
Error bars on data represent mean ± S.E. and/or a relative percent deviation in the value. Error for fraction closed is calculated for the function using the S.E. of all values as combined by the function,
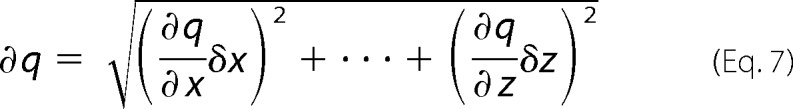 |
where ∂q is the error in the function q consisting of q(x,..,z), and δ denotes the derivative with respect to the following variable (34). Significance (*) was determined by Student's unpaired t test using GraphPad Prism (GraphPad Software).
RESULTS
SPASM FRET Sensors Provide More Consistent and Quantitative Measurements of Interactions Compared with Conventional FRET Sensors
We compared the FRET response of conventional FRET sensors to SPASM FRET sensors. Conventional intramolecular FRET sensors consist of a single polypeptide that encodes for a FRET pair separating two linked proteins or protein domains (35–37). The protein elements in intramolecular FRET sensors are connected by naturally occurring or synthetic unstructured linkers (composed of Gly, Ser, Pro, and Ala) (35). Such sensors rely on conformational changes that influence both the mean separation distance and the relative orientation of fluorophore dipoles to drive a change in FRET. As a consequence, the FRET readout of such conformational sensors is strongly dependent on the linker sequence used between protein domains (38). In the context of FAK, two different conformational sensors with the same organization of protein domains but with different truncations of the naturally occurring linker between the FERM and kinase domains (FERM (1–391) (14) or FERM (1–413) (15)) show, respectively, an increase and decrease in FRET following FAK translocation to focal adhesions (14, 15). Here, we used a similar conventional FRET sensor (FAK 0, FERM (1–409)). Unlike previous reports, the four protein domains mCitrine, FERM, mCerulean, and kinase-FAT in FAK 0 were separated by (Gly-Ser-Gly)×4 linkers to provide rotational flexibility (Fig. 1a) (28). FAK 0 FRET arises from an intramolecular interaction between FERM and kinase-FAT domains, as witnessed by the loss of FRET following TEV protease cleavage of a specific site engineered between the FERM domain and mCerulean (Fig. 1b). Two different sets of mutations, Y180A+M183A (7) and R28S+K38A (29), which target two distinct binding interfaces between the FERM and kinase domains (supplemental Fig. 1), were examined (Fig. 1b). Both sets of mutations have been shown previously to increase basal FAK kinase activity and Tyr-397 phosphorylation (7, 29). FAK 0 showed a substantial decrease in FRET in the presence of R28S+K38A but no change in the presence of Y180A+M183A (Fig. 1b).
In contrast to conventional FRET sensors, SPASM sensors rely on the separation of the FERM and kinase domain by a genetically encoded ER/K α-helix linker (Fig. 1a) (39). The use of long ER/K linkers (≥ 10 nm) provides a low basal FRET state (FERM 10–30) that serves to increase the dynamic range of FRET detection (Fig. 1c). Increasing the length of the ER/K linker (FAK 10–30 contain 10-, 20-, and 30-nm ER/K linkers) decreased FRET levels (Fig. 1d). Unlike the conventional FRET sensor (FAK 0), the SPASM sensors show a substantial decrease in FRET for both the Y180A+M183A and R28S+K38A mutations (Fig. 1e). Therefore, the SPASM sensors are more consistent in reporting changes in the interaction relative to conventional FRET sensors. Further, the use of SPASM sensors allows us to quantify the interaction in terms of the fraction of sensors with the FERM and kinase domains in the bound state (fraction closed, fc) (Fig. 1f, see “Experimental Procedures”). Comparing fc values, we find that although mutagenesis and ER/K linker length both affect the interaction strength, varying the length of the ER/K linker has a greater effect (Fig. 1f). Therefore, SPASM is an attractive alternative to mutagenesis for the purpose of varying the strength of protein-protein interactions over a broad range.
Tyr-397 Phosphorylation Levels Dominate Kinase Activity in Determining Cell Migration
Tyr-397 is structurally associated with the FERM domain (7). The FERM domain masks the active site of the kinase, thereby preventing it from phosphorylating Tyr-397. This model of FAK activation suggests that release of FERM autoinhibition permits the kinase to access and phosphorylate Tyr-397 (6). The release of FERM autoinhibition also allows the kinase to phosphorylate other substrates, which in turn can indirectly influence Tyr-397 phosphorylation (6). The presence of the ER/K linker between the FERM (1–409) and kinase domains is intended to decouple these two effects. This is witnessed in the systematic decrease in fc with increasing ER/K linker length (Fig. 1f). To examine the effect of the ER/K linker at focal adhesions in live cells, high FRET (kinase 0) and low FRET (kinase 30) controls were used to establish the dynamic range of FRET measurements in the focal adhesion microenvironment (Fig. 2, e and f). It must be emphasized that the SPASM sensor retains all of the native domains of FAK so that it retains its ability to translocate to focal adhesions and bind accessory proteins. Insertion of the ER/K linker does not affect the ability of the sensor to bind either paxillin or Grb7 (supplemental Fig. 2). Paxillin is known to bind the FAT domain (12), whereas Grb7 interacts with the FERM domain in a phosphorylation-dependent manner (40). Accordingly, FAK 0 and FAK 30, but not FERM 0, bind paxillin (supplemental Fig. 2a). Further, FAK 0 binds Grb7 more avidly than either FAK 30 (lower phosphorylation levels, see below) or kinase 0 (supplemental Fig. 2b). Using the control sensors (FERM 0–30) in conjunction with FAK 0–30, we found that the FRET ratio at focal adhesions systematically decreases with increasing ER/K linker length (Fig. 2, g, h, and m). Further, this measurement is independent of the cell type (3T3 or HeLa) (Fig. 2, i–m). These results suggest that the ER/K linker effectively controls the interaction at focal adhesions.
FIGURE 2.

The FRET measurement at focal adhesions correlates with ER/K linker length. a–d, mCerulean (Cer) images of live HeLa cells expressing indicated sensors. Cit, mCitrine. e–h, ratiometric FRET images for cells in a–d. i and j, mCerulean images of live 3T3 cells expressing the indicated sensors. k and l, ratiometric FRET images for cells in i and j. For all FRET images, blue to red = low to high FRET (see inset heatmap for range). m, quantification of live cell imaging data in HeLa and 3T3 cells (ratio averaged across cells, n ≥ 20 cells/condition, at least three independent experiments).
We next evaluated the kinase activity and Tyr-397 phosphorylation of these SPASM sensors. In the absence of a protein interaction, the ER/K linker exists mostly in an extended (low-FRET) state (Fig. 1c) (28). Therefore, release of the FERM-kinase interaction in the SPASM sensors is expected to separate these domains and enhance kinase access to exogenous substrates. Accordingly, the introduction of an ER/K linker enhances kinase activity of FAK, as measured by phosphorylation of a peptide (E4Y1) substrate (Fig. 3a). In this model of FAK activation, FAK translocation to focal adhesions results in the release of FERM autoinhibition with subsequent autophosphorylation of Tyr-397 (29). To test autophosphorylation of SPASM sensors, they were expressed in Sf9 insect cells. Sensor proteins expressed in insect cells do not display detectable phosphorylation at Tyr-397 in accordance with the suspension culture of these cells (Fig. 3b). However, the sensor protein is capable of Tyr-397 autophosphorylation when incubated with ATP under standard in vitro kinase assay conditions (Fig. 3b). The addition of phosphatase to the kinase assay suppresses Tyr-397 phosphorylation, attesting to a kinase-phosphatase equilibrium that sets Tyr-397 phosphorylation levels (Fig. 3b). In the context of FAK expressed in adherent cells, increasing ER/K linker length reduces kinase access to Tyr-397, thereby systematically decreasing Tyr-397 phosphorylation (Fig. 3, c and e). This effect was not dependent on cell plating conditions (Fig. 3, d and e) or cell type (HeLa, CHO, and 3T3; supplemental Fig. 3). Further, Tyr-397 phosphorylation is enhanced following FAK translocation to focal adhesions (suspension (Susp) versus adherent (Adh), Fig. 3, d and e). Previous studies suggest that Tyr-397 phosphorylation derives from intramolecular (cis) and intermolecular (trans) events (5, 41). To investigate the relative extent of cis and trans phosphorylation of Tyr-397 in the presence of the ER/K linker, the K454R mutation was introduced in the kinase domain to render it inactive. Supporting the contribution of both cis and trans interactions to Tyr-397 phosphorylation, the K454R mutation had no significant effect on the Tyr-397 phosphorylation relative to the wild type (Fig. 3f). However, with both the wild type and the K454R mutant, Tyr-397 phosphorylation is substantially lower in FAK 30 compared with FAK 0. Therefore, the ER/K linker controls the strength of both the cis and trans phosphorylation events. Taken together, our results show that in the SPASM sensor, Tyr-397 phosphorylation is decoupled from kinase activity. We then used a wound-healing assay (31) to quantify migration of cells overexpressing our SPASM sensors (9-fold overexpression relative to endogenous FAK, data not shown). FAK 0 showed greater cell migration compared with FAK 30 (Fig. 4). This effect is preserved in both HeLa and 3T3 cells expressing these sensor proteins (Fig. 4i). FAK 0 and FAK 30 protein expression was similar for a given cell line, as confirmed by analysis of sensor expression relative to cellular protein content (data not shown). Therefore, cell migration tracks Tyr-397 phosphorylation rather than kinase activity levels.
FIGURE 3.

ER/K linker length correlates directly with Tyr-397 phosphorylation but inversely with exogenous substrate phosphorylation. a, specific activity of purified FAK sensors with exogenous E4Y1 substrate. **, p < 0.01, Student's unpaired t test. b, pTyr-397 immunoblot analysis of FAK sensors expressed in Sf9 cells. Recombinant protein was incubated for 30 min (30 °C) without (-) or with 100 μm ATP (+ATP) and calf intestinal phosphatase (+ATP+CIP). a and b, sensor levels (FAK) were assessed using a fluorescence gel scan before anti-pTyr-397. Immunoblotting with anti-FAK produced indistinguishable results. c, HeLa lysates from adherent cells expressing the indicated FAK sensors. d, HeLa cell lysates from a variety of plating conditions. Susp, suspension; Adh, adherent; FN, fibronectin. e, quantification of data pTyr-397 relative to total FAK expression. Results are expressed in arbitrary units as normalized to the signal from adherent FAK 30 HeLa lysates (mean ± S.E., at least three independent experiments). f, phosphoblot analysis and total FAK fluorescence of HeLa lysates from adherent cells overexpressing either wild-type, Tyr-397F mutant protein, or K454R mutant protein.
FIGURE 4.

Cellular migration in the scratch wound assay correlates with ER/K linker length. Representative brightfield images of HeLa cells (a and b) and 3T3 cells (c and d) transiently expressing the listed sensors immediately after scratch. Matched brightfield images of HeLa cells 8 h post-scratch (e and f) and 3T3 cells 16 h post-scratch (g and h). i, scratch wound data in HeLa and 3T3 cells quantified as the average distance moved toward the center of the wound (mean ± S.E., at least three independent experiments). **, p < 0.01, Student's unpaired t test. Scale bars = 150 μm.
FAK Senses Cellular pH through Changes in the FERM-Kinase Interaction
Cancer cells (where FAK is overexpressed) have an altered intracellular pH (pHi ∼7.5 compared with normal cell pHi of 6.8–7.2) (27). The R28S+K38A mutation that is known to release FERM autoinhibition is in close proximity to His-58 (supplemental Fig. 1). Given the fact that histidine is protonated at acidic pH, we used our SPASM sensors to examine the effects of pH on the FERM-kinase interaction in FAK. Both FAK 0 and FAK 10 showed a substantial increase in FRET ratio below a pH of 6.0, with a greater increase for FAK 10 (Fig. 5, a–d). Acidic pH substantially reduced the emission of the FRET acceptor (mCitrine) without a significant change for the FRET donor (mCerulean, supplemental Fig. 4a). The reduced emission for the FRET acceptor (mCitrine) correlates with a pH-dependent decrease in the FRET ratio (supplemental Fig. 4), which is consistent with a previous report (42). FERM 0 and FERM 10 control sensors were used to correct for loss in FRET arising from pH effects (Fig. 5, a–d). FAK 0 has a lower FRET ratio compared with FERM 0, attesting to the dominant effect of fluorophore orientation in the FRET readout of this sensor (Fig. 5, a and b). In contrast, FAK 10 has higher FRET relative to FERM 10 (Fig. 5, c and d). The FERM 10 control allows us to quantify fc as a function of pH for FAK 10 (Fig. 5e and “Experimental Procedures”). Our results show that the FERM-kinase interaction is steeply enhanced below a pH of 6.0, with over a 3-fold increase in the fc at pH 5.5 relative to pH 7.5 (Fig. 5e). The sensor results were verified by a standard coimmunoprecipitation assay, wherein the intact FAK 0 or FAK 30 sensor was cleaved at a specific site (between the FERM and kinase domains, see “Experimental Procedures”) by Tev protease. The Tev-cleaved kinase domain of both FAK 30 and FAK 0 showed enhanced interaction with the FERM domain at pH 5.8 compared with pH 7.5 (supplemental Fig. 5). FERM 0 was used as a negative control for this assay and did not detect a significant nonspecific interaction (supplemental Fig. 5). The steep increase in interaction strength below pH 6.0 (Fig. 5e) is consistent with the protonation of a histidine residue (side chain pKa ∼6.0). The involvement of His-58 is confirmed by the substantial loss in fc for FAK 10 sensors with an H58A mutation (Fig. 5e). The cocrystal of FAK reveals that the three positive charges (His-58, Arg-28, and Lys-38) on the FERM domain are located in close proximity to a negative charge (Glu-466) on the kinase domain (supplemental Fig. 1), suggesting a potential electrostatic interaction that is enhanced at acidic pH. Accordingly, mutation of Glu-466 substantially decreases fc (Fig. 5e). The significance of this interaction is further confirmed by the rescue in FRET signal for the R28S+K38A double mutant at acidic pH (Fig. 5f). Overall, our results suggest that the interface comprising residues Arg-28, Lys-38, His-58, and Glu-466 have a greater influence on autoinhibition than proposed previously (43), especially for pH-sensing by FAK.
The pH-dependent change in the FERM-kinase interaction was also observed at focal adhesions of cells whose intracellular pH was systematically altered by nigericin treatment (Fig. 6). Specifically, although no difference in FRET was observed between FAK 30 and kinase 30 (matched control) at pH 7.5 (Fig. 6, e and f), a substantial increase in FRET for FAK 30 was detected at pH 5.85 (g and h). Quantitative measurement of FRET ratios at focal adhesions (FRET ratio (Fig. 6i) and fpHx/fpH7.5 (j)) showed a 2-fold increase in the strength of interaction at acidic pH. The relative fraction of molecules in the closed conformation (fpHx/fpH7.5, see “Experimental Procedures” for details) was lowest at pH 7.5 and steadily increased in live cells as the pH decreased (Fig. 7a). In contrast to a sharp increase in fc at pH < 6.0 in vitro, in live cells we detected a gradual increase in fc below pH 7.5 (Fig. 7a). Although the molecular basis for this difference is unclear, our measurements at focal adhesions suggest that the FERM-kinase interaction can sense physiologically relevant changes in pH (pH 6.5–7.5). In addition to an enhanced FERM-kinase interaction, decreases in pH also decreased the kinase activity of FAK (Fig. 7b and supplemental Fig. 6). Reduced kinase activity combined with the enhanced autoinhibition of FAK translates into a decrease in Tyr-397 phosphorylation for FAK 0 (Fig. 7b). In contrast, we did not find a pH-dependent change in Tyr-397 phosphorylation for FAK 30 (Fig. 7b), consistent with the dominant effect of the ER/K linker (f). The pH-dependent effects on Tyr-397 phosphorylation observed for the SPASM sensors were also evident for native FAK. Specifically, native FAK shows substantially lower Tyr-397 phosphorylation levels at pH 5.8 compared with pH 7.5 (Fig. 7, d and e). Introduction of the H58A mutation into native FAK enhances Tyr-397 phosphorylation at pH 7.5 (Fig. 7, d and e). However, neither WT nor H58A mutant FAK show significant Tyr-397 phosphorylation at pH 5.8, suggesting that a combination of the residual autoinhibitory interaction and reduced kinase activity are responsible for the reduced Tyr-397 phosphorylation at lower pH. Taken together, these results suggest that FAK can sense pathophysiological changes in pH at focal adhesions by altering in Tyr-397 phosphorylation.
DISCUSSION
FAK Toolbox
We have developed a library of modular FAK sensors that are capable of regulating FAK activity and influencing downstream cell signaling while maintaining all of the individual protein domains (Fig. 8a). Rather than acting as an “on/off” switch, these sensors allow us to “dial in” the activity of FAK. Further, their matched controls accurately account for nonspecific cellular effects on sensor readout. These FAK sensors successfully retain interactions with targeting and regulatory proteins such as paxillin and Grb7 (supplemental Fig. 2). The targeted localization of these sensors to focal adhesions allows them to monitor events, such as changes in pH, that might be confined to a local microenvironment. Importantly, these sensors allow us to simultaneously measure both the change in pH in the immediate vicinity of the molecule as well as the change in interaction in the molecule itself, a feature that is lacking in commonly used diffusive probes SNARF-1 and BCECF (44). Last but not least, our SPASM sensors have a modular design of plasmid DNA with individual “building blocks” located between unique restriction sites. Although we have reported previously on the use of the SPASM approach to control the interaction between calmodulin and its binding peptides in vitro (28), our study with FAK is the first successful demonstration of the use of this technique in live cells. Therefore, our system of engineering protein interactions is both broadly and easily applied to examine intermolecular and intramolecular interactions both in vitro and in vivo.
FIGURE 8.

Schematic of FERM-kinase regulation and toolbox of FAK sensors. a, toolbox of FAK sensors used in this work with engineered interaction between the FERM and kinase domains (FAK) along with matched controls (FERM and kinase). These sensors can be broadly applied to probe or control FAK regulation in vivo. Cit, mCitrine; Cer, mCerulean. b, increasing ER/K linker length decreases the strength of the FERM-kinase interaction and translates into reduced FRET, Tyr-397 phosphorylation, and cell migration speed while increasing kinase activity. Increasing the pH decreases the strength of the FERM-kinase interaction and translates into reduced FRET and increased Tyr-397 phosphorylation while increasing kinase activity. The difference in Tyr-397 phosphorylation response to increasing ER/K linker length versus pH arises from the presence of Tyr-397 on the FERM domain of FAK. This sensor design was engineered to decouple kinase activity and Tyr-397 phosphorylation.
SPASM Sensors versus Conventional FRET Sensors
Conventional FRET sensors have high basal FRET because of the close proximity of the FRET pair when linked to the native protein (35). The unstructured linkers in these sensors have small end-to-end distances under physiological conditions, regardless of their length (∼3 nm) and therefore maintain the fluorophores within the Förster's radius (Ro ∼5 nm for mCerulean-mCitrine) (45). As such, these sensors depend mainly on changes in dipole orientation of the fluorophores rather than changes in distance between protein domains. This feature of conventional FRET sensors makes it difficult to predict their ability to detect changes in interaction strength (Fig. 1a). Further, they have been used primarily to detect qualitative changes in interaction rather than quantitatively report on the strength of the interaction (35, 37). Cai et al. (14) reported a decrease in FRET at focal adhesions with such a sensor, leading to the conclusion that FAK adopts an open conformation at focal adhesions. In contrast, a similar FRET sensor (15) showed an increase in FRET, suggesting that interpretation of the conformational changes (open/closed) is complicated for these sensors. The SPASM technique overcomes these two limitations of conventional FRET sensors to allow for consistent and quantitative detection of changes in interaction strength between the FERM and kinase domains of FAK at focal adhesions (Figs. 1, e and f; 5e; and 7a). The ER/K linker can successfully control the strength of the interaction over a wide physiologically relevant range (100 nm-10 μm (28) (Fig. 1, d and e). This latter feature of SPASM sensors allows us to systematically perturb the interaction strength without mutagenesis and examine its effects on cellular function (Fig. 4). In the absence of a protein interaction, the ER/K linker prefers an extended conformation (Fig. 1c). This allows us to develop reliable matched controls for the SPASM sensors (e.g. kinase 10–30 and FERM 10–30) that account for the effects of the cellular microenvironment and environmental variables such as pH. In contrast, similar controls for conventional FRET sensors do not provide a predictable readout (Fig. 5b). The use of multiple ER/K linkers allows us to correlate the FRET readout with Tyr-397 phosphorylation (↑ ER/K length = ↓ pTyr-397). Therefore, the SPASM sensors inform phosphorylation levels, unlike conventional sensors that can only infer a conformational change. Last but not least, we have demonstrated that the FRET ratio of SPASM sensors is directly proportional to fc (equilibrium fraction of sensor protein in the bound state) (28). When combined with the matched control, this feature allows us to convert the FRET readout in live cells to a quantitative measure of the interaction (Figs. 1f; 6j, and 7a; see “Experimental Procedures”). The SPASM sensors mirror interactions in the native protein and inform its function. For instance, the pH-dependent change in Tyr-397 phosphorylation observed in the SPASM sensors translated to the native protein (Fig. 7, d and e). The sensor FRET readout can be verified by standard approaches. For example, the enhanced pH-dependent interaction between the FERM and kinase domains detected from sensor FRET was reproducible in a coimmunoprecipitation assay (supplemental Fig. 5). These benefits of SPASM sensors, combined with their modular design, allows for ready extension of the approach outlined in this work to control and monitor any protein interaction at a macromolecular structure in live cells.
FAK Kinase Activity versus Tyr-397 Phosphorylation
The central role of FAK overexpression in tumor cell migration and survival has made FAK an important therapeutic target in cancer (46). Small molecular inhibitors of FAK include ATP analogs (e.g. TAC-544 (Novartis) (47) and PF-228 (Pfizer) (48)) and Tyr-397 targets (Tyr-11 (19)). Although both kinds of inhibitors reduce Tyr-397 phosphorylation of FAK, the ATP analogs also affect other substrates of FAK, such as paxillin (49, 50), by disrupting FAK kinase activity. Because kinase activity of FAK and Tyr-397 phosphorylation are tightly coupled in native FAK, it is difficult to ascertain their relative roles in cell migration and survival. Specifically, in the context of cell migration, it is unclear whether the kinase activity of FAK is necessary beyond Tyr-397 phosphorylation. In this study, we have designed our SPASM sensors to decouple kinase activity from Tyr-397 phosphorylation. We find that cell migration tracks Tyr-397 phosphorylation rather than kinase activity (Fig. 8b). Our findings suggest that targeting Tyr-397 phosphorylation is sufficient to suppress the role of FAK in cell migration. Although it is outside the scope of this work, our sensors can similarly be used to examine the relative importance of Tyr-397 and kinase activity on other events (e.g. growth factor signaling) initiated by FAK.
Spatial Patterning of the FERM-Kinase Interaction at Focal Adhesions
The focal adhesion was shown recently to have a layered macromolecular architecture (51). The N-terminal FERM domain of FAK is known to interact with β-integrin (52), phospholipids (9, 10), and Arp3 (11), each of which are localized to a different horizontal layer compared with paxillin and talin, which interact with the C-terminal FAT domain (12, 13). The layered architecture of the focal adhesion gives rise to two possible models for distribution of interactions between FAK domains at the focal adhesion, namely random (supplemental Fig. 7a) and segregated (supplemental Fig. 7b). Given the proximity of the different domains in the native FAK molecule, conventional FRET sensors cannot discern between these two spatial distributions. The use of SPASM sensors with the ER/K linker allows us to spatially separate the FERM and kinase domains of FAK to distinguish between the two models. The systematic changes in FRET and Tyr-397 phosphorylation with ER/K linker length strongly support the segregated distribution of FAK interactions (Fig. 2 and 3). An important functional consequence of spatial segregation of FAK interactions is that changes in the architecture of the focal adhesion will influence the FERM-kinase interaction and, thereby, Tyr-397 phosphorylation of FAK. Our toolbox of SPASM sensors is well suited to probe for such differences in different normal and tumor cell lines to understand the molecular mechanisms that provide varying levels of Tyr-397 phosphorylation.
FAK as a pH Sensor
The importance of pH dependence of FAK activity stems from extensive studies that suggest that the intracellular pH of cancer cells (pHi) increases from 6.8–7.0 to ∼7.5 (53). This paradoxical increase in cancer cell pH, in an extracellular environment acidified by metabolic acids, is a result of enhanced proton efflux driven by overexpression of membrane ion transporters (27). The alkalinization of cancer cells is known to enhance cell proliferation and cell migration, both of which are key for cancer progression (54). The central role of FAK and Tyr-397 phosphorylation in cancer cell migration (6) provides added significance to our finding that FAK acts as a pH sensor. We identify two factors that contribute to the pH sensitivity of FAK. First, the FERM-kinase interaction is sensitive to pH, partly because of the protonation of His-58 on the FERM domain that likely interacts with residue Glu-466 on the kinase domain (Fig. 5e and supplemental Fig. 1). Second, the kinase activity of FAK as measured using an exogenous substrate (E4Y1) decreases at lower pH (supplemental Fig. 6). Taken together, the enhanced autoinhibition of the FERM domain and reduced activity of the kinase domains act in concert to keep FAK activity in check in normal cells. The alkalinization of cancer cells (pHi ∼7.5) leads to enhanced FAK activity and Tyr-397 phosphorylation (Fig. 7, b and c) that can promote cell migration in cancer. Accordingly, introducing the H58A mutation releases residual autoinhibition of the FERM domain to enhance Tyr-397 phosphorylation at pH 7.5 (Fig. 7, d and e).
Measuring pH-dependent Changes in the Protein Interaction in Live Cells
Our knowledge of pH-dependent changes in protein interactions comes from a combination of in vitro measurements and inferences from the cellular effects of mutagenesis of specific amino acid residues (primarily His substitutions) in proteins (44). Although there are several organic dyes (e.g. BCECF and SNARF-1 (55)) that have been used for measuring the changes in intracellular pH, we are not aware of any studies that have directly examined the effect of intracellular pH on the strength of a protein interaction in cells. To the best of our knowledge, this work is the first quantitative measurement of the pH-dependent change in a protein interaction at a macromolecular structure in live cells. A major limitation in the use of FRET-based sensors to measure effects of cellular pH on protein interactions stems from the effect of pH on the emission of the donor and/or acceptor fluorophores (supplemental Fig. 4) (42). In this work, we demonstrate that we can directly quantify the effects of pH in live cells by using the SPASM technique with matched controls (Figs. 5e, 6j, and 7a). We find that unlike in vitro measurements, where a steep increase in interaction strength is detected below a pH of 6.0 (consistent with protonation of His-58), in live cells a more gradual change is observed over a more physiological range (pH 6.5–7.5). The difference between these observations likely derives from the complexity of the intracellular environment and provides physiological relevance to the pH regulation of FAK in vivo.
Acknowledgments
We thank Hugo Acosta-Jaquez and Amparo Serna Alarcon for useful discussions.
This work was supported by American Heart Association National Scientist Development Grant 13SDG14270009, the McKay Award, and University of Michigan startup funds (to S. S.). This work was also supported in part by National Institutes of Health Grant CA 163493 (to J. L. G.).

This article contains supplemental Figs. 1–7.
- FAK
- focal adhesion kinase
- SPASM
- systematic protein affinity strength modulation
- FAT
- focal adhesion targeting
- TEV
- tobacco etch virus
- FERM
- band 4.1/ezrin/radixin/moesin.
REFERENCES
- 1. Zaidel-Bar R., Itzkovitz S., Ma'ayan A., Iyengar R., Geiger B. (2007) Functional atlas of the integrin adhesome. Nat. Cell Biol. 9, 858–867 [DOI] [PMC free article] [PubMed] [Google Scholar]
- 2. Steinberg S. F. (2008) Structural basis of protein kinase C isoform function. Physiol. Rev. 88, 1341–1378 [DOI] [PMC free article] [PubMed] [Google Scholar]
- 3. Schaller M. D. (2001) Biochemical signals and biological responses elicited by the focal adhesion kinase. Biochim. Biophys. Acta 1540, 1–21 [DOI] [PubMed] [Google Scholar]
- 4. Arold S. T. (2011) How focal adhesion kinase achieves regulation by linking ligand binding, localization and action. Curr. Opin Struct. Biol. 21, 808–813 [DOI] [PMC free article] [PubMed] [Google Scholar]
- 5. Cary L. A., Chang J. F., Guan J. L. (1996) Stimulation of cell migration by overexpression of focal adhesion kinase and its association with Src and Fyn. J. Cell Sci. 109, 1787–1794 [DOI] [PubMed] [Google Scholar]
- 6. Zhao J., Guan J. L. (2009) Signal transduction by focal adhesion kinase in cancer. Cancer Metastasis Rev. 28, 35–49 [DOI] [PubMed] [Google Scholar]
- 7. Lietha D., Cai X., Ceccarelli D. F., Li Y., Schaller M. D., Eck M. J. (2007) Structural basis for the autoinhibition of focal adhesion kinase. Cell 129, 1177–1187 [DOI] [PMC free article] [PubMed] [Google Scholar]
- 8. Cooper L. A., Shen T. L., Guan J. L. (2003) Regulation of focal adhesion kinase by its amino-terminal domain through an autoinhibitory interaction. Mol. Cell. Biol. 23, 8030–8041 [DOI] [PMC free article] [PubMed] [Google Scholar]
- 9. Sun X., Shikata Y., Wang L., Ohmori K., Watanabe N., Wada J., Shikata K., Birukov K. G., Makino H., Jacobson J. R., Dudek S. M., Garcia J. G. (2009) Enhanced interaction between focal adhesion and adherens junction proteins. Involvement in sphingosine 1-phosphate-induced endothelial barrier enhancement. Microvasc. Res. 77, 304–313 [DOI] [PMC free article] [PubMed] [Google Scholar]
- 10. Leve F., Marcondes T. G., Bastos L. G., Rabello S. V., Tanaka M. N., Morgado-Díaz J. A. (2011) Lysophosphatidic acid induces a migratory phenotype through a crosstalk between RhoA-Rock and Src-FAK signalling in colon cancer cells. Eur. J. Pharmacol. 671, 7–17 [DOI] [PubMed] [Google Scholar]
- 11. Serrels B., Serrels A., Brunton V. G., Holt M., McLean G. W., Gray C. H., Jones G. E., Frame M. C. (2007) Focal adhesion kinase controls actin assembly via a FERM-mediated interaction with the Arp2/3 complex. Nat. Cell Biol. 9, 1046–1056 [DOI] [PubMed] [Google Scholar]
- 12. Scheswohl D. M., Harrell J. R., Rajfur Z., Gao G., Campbell S. L., Schaller M. D. (2008) Multiple paxillin binding sites regulate FAK function. J. Mol. Signal 3, 1. [DOI] [PMC free article] [PubMed] [Google Scholar]
- 13. Baumann K. (2012) Cell adhesion: FAK or talin: who goes first? Nat. Rev. Mol. Cell Biol. 13, 138. [DOI] [PubMed] [Google Scholar]
- 14. Cai X., Lietha D., Ceccarelli D. F., Karginov A. V., Rajfur Z., Jacobson K., Hahn K. M., Eck M. J., Schaller M. D. (2008) Spatial and temporal regulation of focal adhesion kinase activity in living cells. Mol. Cell. Biol. 28, 201–214 [DOI] [PMC free article] [PubMed] [Google Scholar]
- 15. Papusheva E., Mello de Queiroz F., Dalous J., Han Y., Esposito A., Jares-Erijmanxa E. A., Jovin T. M., Bunt G. (2009) Dynamic conformational changes in the FERM domain of FAK are involved in focal-adhesion behavior during cell spreading and motility. J. Cell Sci. 122, 656–666 [DOI] [PubMed] [Google Scholar]
- 16. Cabrita M. A., Jones L. M., Quizi J. L., Sabourin L. A., McKay B. C., Addison C. L. (2011) Focal adhesion kinase inhibitors are potent anti-angiogenic agents. Mol. Oncol. 5, 517–526 [DOI] [PMC free article] [PubMed] [Google Scholar]
- 17. Wendt M. K., Schiemann W. P. (2009) Therapeutic targeting of the focal adhesion complex prevents oncogenic TGF-β signaling and metastasis. Breast Cancer Res. 11, R68. [DOI] [PMC free article] [PubMed] [Google Scholar]
- 18. Tse K. W., Dang-Lawson M., Lee R. L., Vong D., Bulic A., Buckbinder L., Gold M. R. (2009) B cell receptor-induced phosphorylation of Pyk2 and focal adhesion kinase involves integrins and the Rap GTPases and is required for B cell spreading. J. Biol. Chem. 284, 22865–22877 [DOI] [PMC free article] [PubMed] [Google Scholar]
- 19. Golubovskaya V. M., Figel S., Ho B. T., Johnson C. P., Yemma M., Huang G., Zheng M., Nyberg C., Magis A., Ostrov D. A., Gelman I. H., Cance W. G. (2012) A small molecule focal adhesion kinase (FAK) inhibitor, targeting Tyr-397 site. 1-(2-hydroxyethyl)-3, 5, 7-triaza-1-azoniatricyclo [3.3.1.1(3,7)]decane; bromide effectively inhibits FAK autophosphorylation activity and decreases cancer cell viability, clonogenicity and tumor growth in vivo. Carcinogenesis 33, 1004–1013 [DOI] [PMC free article] [PubMed] [Google Scholar]
- 20. Withers B. E., Keller P. R., Fry D. W. (1996) Expression, purification and characterization of focal adhesion kinase using a baculovirus system. Protein Expr. Purif. 7, 12–18 [DOI] [PubMed] [Google Scholar]
- 21. Guan J. L., Shalloway D. (1992) Regulation of focal adhesion-associated protein tyrosine kinase by both cellular adhesion and oncogenic transformation. Nature 358, 690–692 [DOI] [PubMed] [Google Scholar]
- 22. Owens L. V., Xu L., Craven R. J., Dent G. A., Weiner T. M., Kornberg L., Liu E. T., Cance W. G. (1995) Overexpression of the focal adhesion kinase (p125FAK) in invasive human tumors. Cancer Res. 55, 2752–2755 [PubMed] [Google Scholar]
- 23. Miyazaki T., Kato H., Nakajima M., Sohda M., Fukai Y., Masuda N., Manda R., Fukuchi M., Tsukada K., Kuwano H. (2003) FAK overexpression is correlated with tumour invasiveness and lymph node metastasis in oesophageal squamous cell carcinoma. Br. J. Cancer 89, 140–145 [DOI] [PMC free article] [PubMed] [Google Scholar]
- 24. Recher C., Ysebaert L., Beyne-Rauzy O., Mansat-De Mas V., Ruidavets J. B., Cariven P., Demur C., Payrastre B., Laurent G., Racaud-Sultan C. (2004) Expression of focal adhesion kinase in acute myeloid leukemia is associated with enhanced blast migration, increased cellularity, and poor prognosis. Cancer Res. 64, 3191–3197 [DOI] [PubMed] [Google Scholar]
- 25. Sawai H., Okada Y., Funahashi H., Matsuo Y., Takahashi H., Takeyama H., Manabe T. (2005) Activation of focal adhesion kinase enhances the adhesion and invasion of pancreatic cancer cells via extracellular signal-regulated kinase-1/2 signaling pathway activation. Mol. Cancer 4, 37. [DOI] [PMC free article] [PubMed] [Google Scholar]
- 26. Ding L., Sun X., You Y., Liu N., Fu Z. (2010) Expression of focal adhesion kinase and phosphorylated focal adhesion kinase in human gliomas is associated with unfavorable overall survival. Transl. Res. 156, 45–52 [DOI] [PubMed] [Google Scholar]
- 27. Webb B. A., Chimenti M., Jacobson M. P., Barber D. L. (2011) Dysregulated pH. A perfect storm for cancer progression. Nat. Rev. Cancer 11, 671–677 [DOI] [PubMed] [Google Scholar]
- 28. Sivaramakrishnan S., Spudich J. A. (2011) Systematic control of protein interaction using a modular ER/K α-helix linker. Proc. Natl. Acad. Sci. U.S.A. 108, 20467–20472 [DOI] [PMC free article] [PubMed] [Google Scholar]
- 29. Cohen L. A., Guan J. L. (2005) Residues within the first subdomain of the FERM-like domain in focal adhesion kinase are important in its regulation. J. Biol. Chem. 280, 8197–8207 [DOI] [PubMed] [Google Scholar]
- 30. Chow S., Hedley D. (2001) Flow cytometric measurement of intracellular pH. Curr. Protoc. Cytom. Chapter 9, Unit 9.3 [DOI] [PubMed] [Google Scholar]
- 31. Liang C. C., Park A. Y., Guan J. L. (2007) In vitro scratch assay. A convenient and inexpensive method for analysis of cell migration in vitro. Nat. Protoc. 2, 329–333 [DOI] [PubMed] [Google Scholar]
- 32. Lakowicz J. (1999) Principles of Fluorescence Spectroscopy, 2nd Ed., pp. 367–394, Kluwer Academic/Plenum Publishers, New York [Google Scholar]
- 33. Lyu P. C., Gans P. J., Kallenbach N. R. (1992) Energetic contribution of solvent-exposed ion pairs to α-helix structure. J. Mol. Biol. 223, 343–350 [DOI] [PubMed] [Google Scholar]
- 34. Taylor J. R. (1997) An Introduction to Error Analysis. The Study of Uncertainties in Physical Measurements, 2nd Ed., pp. 73–79, University Science Books, Sausalito, CA [Google Scholar]
- 35. Zhang J., Allen M. D. (2007) FRET-based biosensors for protein kinases. Illuminating the kinome. Mol. Biosyst. 3, 759–765 [DOI] [PubMed] [Google Scholar]
- 36. Ting A. Y., Kain K. H., Klemke R. L., Tsien R. Y. (2001) Genetically encoded fluorescent reporters of protein tyrosine kinase activities in living cells. Proc. Natl. Acad. Sci. U.S.A. 98, 15003–15008 [DOI] [PMC free article] [PubMed] [Google Scholar]
- 37. Kiyokawa E., Hara S., Nakamura T., Matsuda M. (2006) Fluorescence (Förster) resonance energy transfer imaging of oncogene activity in living cells. Cancer Sci. 97, 8–15 [DOI] [PMC free article] [PubMed] [Google Scholar]
- 38. Miyawaki A., Tsien R. Y. (2000) Monitoring protein conformations and interactions by fluorescence resonance energy transfer between mutants of green fluorescent protein. Methods Enzymol. 327, 472–500 [DOI] [PubMed] [Google Scholar]
- 39. Sivaramakrishnan S., Spink B. J., Sim A. Y., Doniach S., Spudich J. A. (2008) Dynamic charge interactions create surprising rigidity in the ER/K α-helical protein motif. Proc. Natl. Acad. Sci. U.S.A. 105, 13356–13361 [DOI] [PMC free article] [PubMed] [Google Scholar]
- 40. Chu P. Y., Huang L. Y., Hsu C. H., Liang C. C., Guan J. L., Hung T. H., Shen T. L. (2009) Tyrosine phosphorylation of growth factor receptor-bound protein-7 by focal adhesion kinase in the regulation of cell migration, proliferation, and tumorigenesis. J. Biol. Chem. 284, 20215–20226 [DOI] [PMC free article] [PubMed] [Google Scholar]
- 41. Toutant M., Costa A., Studler J. M., Kadaré G., Carnaud M., Girault J. A. (2002) Alternative splicing controls the mechanisms of FAK autophosphorylation. Mol. Cell. Biol. 22, 7731–7743 [DOI] [PMC free article] [PubMed] [Google Scholar]
- 42. Salonikidis P. S., Niebert M., Ullrich T., Bao G., Zeug A., Richter D. W. (2011) An ion-insensitive cAMP biosensor for long term quantitative ratiometric fluorescence resonance energy transfer (FRET) measurements under variable physiological conditions. J. Biol. Chem. 286, 23419–23431 [DOI] [PMC free article] [PubMed] [Google Scholar]
- 43. Frame M. C., Patel H., Serrels B., Lietha D., Eck M. J. (2010) The FERM domain. Organizing the structure and function of FAK. Nat. Rev. Mol. Cell Biol. 11, 802–814 [DOI] [PubMed] [Google Scholar]
- 44. Srivastava J., Barber D. L., Jacobson M. P. (2007) Intracellular pH sensors. Design principles and functional significance. Physiology 22, 30–39 [DOI] [PubMed] [Google Scholar]
- 45. Möglich A., Joder K., Kiefhaber T. (2006) End-to-end distance distributions and intrachain diffusion constants in unfolded polypeptide chains indicate intramolecular hydrogen bond formation. Proc. Natl. Acad. Sci. U.S.A. 103, 12394–12399 [DOI] [PMC free article] [PubMed] [Google Scholar]
- 46. Lim S. T., Mikolon D., Stupack D. G., Schlaepfer D. D. (2008) FERM control of FAK function: implications for cancer therapy. Cell Cycle 7, 2306–2314 [DOI] [PMC free article] [PubMed] [Google Scholar]
- 47. Weis S. M., Lim S. T., Lutu-Fuga K. M., Barnes L. A., Chen X. L., Göthert J. R., Shen T. L., Guan J. L., Schlaepfer D. D., Cheresh D. A. (2008) Compensatory role for Pyk2 during angiogenesis in adult mice lacking endothelial cell FAK. J. Cell Biol. 181, 43–50 [DOI] [PMC free article] [PubMed] [Google Scholar]
- 48. Slack-Davis J. K., Martin K. H., Tilghman R. W., Iwanicki M., Ung E. J., Autry C., Luzzio M. J., Cooper B., Kath J. C., Roberts W. G., Parsons J. T. (2007) Cellular characterization of a novel focal adhesion kinase inhibitor. J. Biol. Chem. 282, 14845–14852 [DOI] [PubMed] [Google Scholar]
- 49. Schaller M. D., Parsons J. T. (1995) pp125FAK-dependent tyrosine phosphorylation of paxillin creates a high-affinity binding site for Crk. Mol. Cell. Biol. 15, 2635–2645 [DOI] [PMC free article] [PubMed] [Google Scholar]
- 50. Bellis S. L., Miller J. T., Turner C. E. (1995) Characterization of tyrosine phosphorylation of paxillin in vitro by focal adhesion kinase. J. Biol. Chem. 270, 17437–17441 [DOI] [PubMed] [Google Scholar]
- 51. Kanchanawong P., Shtengel G., Pasapera A. M., Ramko E. B., Davidson M. W., Hess H. F., Waterman C. M. (2010) Nanoscale architecture of integrin-based cell adhesions. Nature 468, 580–584 [DOI] [PMC free article] [PubMed] [Google Scholar]
- 52. Guan J. L. (1997) Role of focal adhesion kinase in integrin signaling. Int. J. Biochem. Cell Biol. 29, 1085–1096 [DOI] [PubMed] [Google Scholar]
- 53. Stubbs M., Rodrigues L., Howe F. A., Wang J., Jeong K. S., Veech R. L., Griffiths J. R. (1994) Metabolic consequences of a reversed pH gradient in rat tumors. Cancer Res. 54, 4011–4016 [PubMed] [Google Scholar]
- 54. De Milito A., Fais S. (2005) Tumor acidity, chemoresistance and proton pump inhibitors. Future Oncol. 1, 779–786 [DOI] [PubMed] [Google Scholar]
- 55. Buckler K. J., Vaughan-Jones R. D. (1990) Application of a new pH-sensitive fluoroprobe (carboxy-SNARF-1) for intracellular pH measurement in small, isolated cells. Pflugers Arch. 417, 234–239 [DOI] [PubMed] [Google Scholar]