Background: The molecular identity of the intestinal vitamin C transporters is incomplete.
Results: Facilitative sugar transporters, GLUT2 and GLUT8, transport dehydroascorbic acid, the oxidized form of vitamin C.
Conclusion: Intestinal vitamin C absorption can occur via facilitative sugar transporters.
Significance: Vitamin C bioavailability may be inhibited by dietary factors, such as glucose and phytochemicals.
Keywords: Glucose Transport, Intestine, Membrane Transport, Polyphenols, Transporters, Vitamin C, Dehydroascorbic Acid, Enterocyte, Facilitative Transport
Abstract
Intestinal vitamin C (Asc) absorption was believed to be mediated by the Na+-dependent ascorbic acid transporter SVCT1. However, Asc transport across the intestines of SVCT1 knock-out mice is normal indicating that alternative ascorbic acid transport mechanisms exist. To investigate these mechanisms, rodents were gavaged with Asc or its oxidized form dehydroascorbic acid (DHA), and plasma Asc concentrations were measured. Asc concentrations doubled following DHA but not Asc gavage. We hypothesized that the transporters responsible were facilitated glucose transporters (GLUTs). Using Xenopus oocyte expression, we investigated whether facilitative glucose transporters GLUT2 and GLUT5–12 transported DHA. Only GLUT2 and GLUT8, known to be expressed in intestines, transported DHA with apparent transport affinities (Km) of 2.33 and 3.23 mm and maximal transport rates (Vmax) of 25.9 and 10.1 pmol/min/oocyte, respectively. Maximal rates for DHA transport mediated by GLUT2 and GLUT8 in oocytes were lower than maximal rates for 2-deoxy-d-glucose (Vmax of 224 and 32 pmol/min/oocyte for GLUT2 and GLUT8, respectively) and fructose (Vmax of 406 and 116 pmol/min/oocyte for GLUT2 and GLUT8, respectively). These findings may be explained by differences in the exofacial binding of substrates, as shown by inhibition studies with ethylidine glucose. DHA transport activity in GLUT2- and GLUT8-expressing oocytes was inhibited by glucose, fructose, and by the flavonoids phloretin and quercetin. These studies indicate intestinal DHA transport may be mediated by the facilitative sugar transporters GLUT2 and GLUT8. Furthermore, dietary sugars and flavonoids in fruits and vegetables may modulate Asc bioavailability via inhibition of small intestinal GLUT2 and GLUT8.
Introduction
Ascorbic acid (vitamin C, Asc)5 is essential for survival of humans, non-human primates, guinea pigs, and some laboratory rodents. Asc oxidizes to DHA, which is either reduced enzymatically or chemically back to Asc, or irreversibly hydrolyzed to 2,3-diketogulonic acid, with loss of vitamin C activity (1). The putative importance of Asc and DHA as physiologic substrates has been a subject of nutrition research for more than 60 years. Identification of Asc-specific and DHA-specific transporters has been vital to address the issue. Asc transport as such is now known to be mediated by at least two sodium-dependent Asc transporters, SVCT1, which is expressed in the intestine, liver, and kidney, and SVCT2, which is expressed in all other tissues (2). Whether Asc alone or DHA was the substrate for tissue accumulation was addressed first by creating knock-out mice lacking the generally distributed tissue transporter SVCT2. If Asc was the necessary substrate, mice engineered to lack SVCT2 would be expected to have severe deficiency and/or not survive. If DHA played a role in Asc physiology, then knock-out SVCT2 mice should continue to have Asc accumulated in tissues. SVCT2 knock-out mice were observed to have severe generalized Asc deficiency and die at birth, indicating that Asc transport as such is necessary for tissue accumulation, at least in all tissues measured (3). A corollary conclusion is that DHA transport is not a salvage pathway for generalized tissue accumulation. This conclusion is consistent with plasma measurements of Asc and DHA. Asc is the dominant species measured in plasma, whereas DHA plasma concentrations cannot be distinguished from zero (4).
Despite SVCT2 knock-out mouse data and plasma measurements, it remained possible that DHA had a tissue-specific physiologic role relevant to humans. To further explore this possibility, SVCT1 knock-out mice were created more recently (5). One potential tissue-specific role for DHA transport is in the intestine. Although an intestinal epithelial transporter for Asc transport and absorption was identified as SVCT1 (2), supporting functional evidence was lacking. In fact, when Asc was administered orally by gavage to SVCT1 knock-out mice, blood Asc concentrations still increased (5). These data were consistent with the existence of an alternate pathway(s) for Asc intestinal absorption. One pathway could involve another unidentified sodium-dependent Asc transporter(s). Another pathway could involve intraluminal intestinal oxidation to DHA, DHA transport into enterocytes, and then internal reduction to Asc. Asc administered orally cures scurvy in animals and humans (6, 7). DHA given enterally in about 10-fold higher amounts compared with Asc reverses scurvy in guinea pigs and the ODS rat, neither of which synthesize Asc (8, 9). These findings have two explanations, either DHA is reduced to Asc enterally in these animal models or DHA itself is transported.
Until now, there has not been a clear molecular candidate to mediate DHA intestinal absorption. DHA is transported by facilitated GLUT transporters GLUT1 and GLUT3 (10) and to a lesser extent by GLUT4 (11). Of note, GLUT1, GLUT3, and GLUT4 are not expressed on either the apical membrane or the basolateral membrane of the enterocyte in the gut. The major intestinal glucose-facilitated glucose transporters are GLUT2 and GLUT5, but these transporters do not appear to transport DHA when compared with GLUT1 and GLUT3 (10). However, because GLUT1 and GLUT3 are high capacity DHA transporters, lower DHA transport activity by GLUT2 and GLUT5 could be obscured in comparison, as was the case for GLUT4 (11). Alternatively, another facilitated glucose transporter could be responsible for DHA intestinal transport. For example, GLUT8 has recently been reported to be expressed in the intestine (12). Data showing that DHA is transported by intestinal GLUT transporters is potentially meaningful, because it suggests DHA transport across the intestine could be blocked by dietary sugars. For these reasons, we compared DHA with Asc intestinal absorption in vivo using the same dose of each, and based on the findings, we investigated whether DHA was transported by facilitated intestinal sugar transporters GLUT2, -5, -7, and -8, and as well as GLUT6, and -9–12 (13).
EXPERIMENTAL PROCEDURES
Measurement of Ascorbic Acid Concentrations in Rat Plasma Samples
180–250 g of adult male Sprague-Dawley rats with carotid artery catheters were purchased from Charles River Laboratories (Wilmington, MA). All animal experiments were conducted according to protocols approved by the Animal Care and Use Committee of NIDDK, National Institutes of Health. After 1 week of acclimatization, rodents were fasted overnight with full access to water and gavaged with 12 mg of DHA, Asc, or water vehicle, and post-gavage blood samples were collected at 0, 30, 60, 120, and 180 min. Blood was centrifuged in heparin-treated plasma collector tubes (BD Biosciences) for 10 min at 1,000 × g at 4 °C. Plasma was then diluted at 1:10 in 90% methanol plus 1 mm EDTA and centrifuged at 25,000 × g for 15 min at 4 °C. Plasma Asc levels were analyzed by HPLC with coulometric electrochemical detection as described previously (14). Treatments with alternative solutions were performed in each rat within a 2-week time span. At each time point, at least 10 animals were treated. Statistical significance between each treatment at individual time points was calculated by two-tailed paired t test.
Plasmids and Inserts
Rat GLUT1 was obtained as a plasmid constructs from G. I. Bell and C. F. Burant (University of Chicago). HA-tagged wild type human GLUT6 and mouse GLUT8 (GenBankTM accession numbers Y17802 and Y17803) containing the N-terminal di-leucine internalization motif, and HA-tagged mutant human GLUT6 and mutant mouse GLUT8 containing the di-leucine to di-alanine substitution (LL-AA) were obtained from H. Al-Hasani (University of Cologne). The HA tag was removed from GLUT6 and GLUT8 constructs using NcoI. Mutant rat GLUT8 containing the di-leucine to di-alanine substitution was obtained from B. Thorens (University of Lausanne). Plasmid constructs were described previously (10, 15–17).
Subcloning Human GLUT7, -9, -10, -11, and -12 and Substituting Wild Type Di-leucine Motifs with Mutant Di-alanine Motifs
Human GLUT7, GLUT9, GLUT10, GLUT11, and GLUT12 (GenBankTM accession numbers AY571960, NM020041, BC113423, AJ271290, and BC070149, respectively) were amplified by PCR using human kidney, brain, and adrenal cDNA libraries (Clontech) and the following primers: 5′-GLUT7 forward primer 5′-ATGGAGACAAAGAGGCGG-3′ and 3′-GLUT7 reverse primer 5′-CTAAAAGGAAGTTTCCTTG-3′; 5′-GLUT9 forward primer 5′-GGTCACTGAGACCCATGGCAAG-3′ and 3′-GLUT9 reverse primer 5′-GAGGAGGAAACTTGTTAAGGCCT-3′; 5′-GLUT10 forward primer 5′-CCGAGTCCCGCTCGCCATGGGCCACTCCCC-3′ and 3′-GLUT10 reverse primer 5′-TCCAGGCAGACGGATTCCTCAGGAGGCCGC-3′; 5′-GLUT11 forward primer 5′-AGTGCTGCGGCAGAGGCGGATGGAGGATGA-3′ and 3′-GLUT11 primer reverse 5′-TCTGGCCACCCCTTTGGGACTAGAGTTCTG-3′; and 5′-GLUT12 forward primer 5′-AACTTCTACGTGACCATGGTACCTGTTGAA-3′ and 3′-GLUT12 reverse 5′-TGTTGAGGCCATTAGGTCTCTGGAGAAAGC-3′. Cloned Pfu DNA polymerase (Stratagene) was used for 24–32 amplification cycles, followed by a 20-min incubation with Taq polymerase. PCR products were visualized on 1% agarose gel and subcloned into pGEM-Teasy (Promega). Substituting human GLUT9, -10, -11, and -12 N-terminal di-leucine motifs with di-alanine was undertaken using site-directed mutagenesis (Promega) and the following primers (mismatches underlined): human GLUT9 5′-GGCCAGGGAGGGCAGCCGCCGAGTGTGACCACCT-3′; human GLUT10 5′-TGTGTGCCTCTGTGTCTGCCGCCGGTGGCCTGAC-3′; human GLUT11 5′-CAGGGCAGGATCGCCGCCCTGACCATCTGCGCTG-3′; and human GLUT12 5′-ACCGAGGGCCCCAGTGCCGCCAACCAGAAGGGGA-3′. All cDNA sequences were verified by automated DNA sequencing.
Oocyte Isolation and Injection
Oocytes were isolated from Xenopus laevis and injected with mRNA using established methods (18). Briefly, mature adult female frogs were anesthetized with 3-aminobenzoic acid ethyl ester (2 g/750 ml) in ice water. Frog ovaries were resected, and their ovarian lobes were opened and incubated in OR-2 without calcium (5 mm HEPES, 82.5 mm NaCl, 2.5 mm KCl, 1 mm MgCl2, 1 mm Na2HPO4, 100 μg/ml gentamicin, pH 7.8) with collagenase type IV (2 mg/ml) for 30 min at 23 °C. Individual oocytes were isolated and transferred to OR-2 containing 1 mm CaCl2 and maintained at 18–20 °C until injection with mRNA. GLUT mRNA was prepared by cutting plasmid vectors with appropriate restriction enzymes followed by in vitro transcription utilizing SP6, T7, or T3 mMessage, mMachine (Ambion). DHA transport in oocytes injected to express GLUT2 is controversial with some authors detecting transport above sham (19), although others have not (10). To provide more consistent transport data, especially for transporters with low transport activity, we therefore routinely poly(A)-tailed GLUT cRNA prior to oocyte injection (20). mRNA was loaded into capillary pipettes generated using a micropipette puller (P-77, Sutter, Novato, CA), and oocytes were injected using a pressure controlled injected (Eppendorf transjector model 5246, Eppendorf, Hamburg, Germany). Injection volumes were between 30 and 50 nl, and mRNA concentration 0.5–1 mg/ml. Post-injected oocytes were incubated at 20 °C in OR-2 containing 1 mm pyruvate with daily media changes. Experiments were performed on 3–5 days after oocytes were injected with mRNA.
Preparation of [14C]Dehydroascorbic Acid
[14C]DHA was prepared from crystalline [14C]Asc (6.6 mCi/mmol, PerkinElmer Life Sciences) as described previously (10). Briefly, 5 μl of bromine solution (Fluka, Ronkonkoma, NY) was added to [14C]Asc solubilized in 600 μl of ultrapure water at a concentration of 20 mm. The solution was briefly vortexed and immediately purged with nitrogen on ice in the dark for 10 min. HPLC with electro-coulometric detection confirmed 100% conversion of [14C]Asc to DHA (14).
Oocyte Transport Protocol
Transport of [14C]DHA and 2-[1,2-3H]deoxy-d-glucose (26.2 mCi/mmol) was examined using groups of 10–20 oocytes injected to express GLUTs or water-injected sham oocytes at 23 °C in OR-2 containing different concentrations of freshly prepared [14C]DHA (0.6–5.5 μCi/ml) or sugar (0.5–1 μCi/ml labeled sugar with added nonlabeled sugar) for 10 min. After incubation in uptake medium, oocytes were immediately washed four times with ice-cold PBS solution. Inhibitors were added to the incubation medium as described in the text. Individual oocytes were dissolved in 500 μl of 10% SDS, and internalized radioactivity was measured using scintillation spectrometry.
Statistics and Kinetics Analyses
Data are expressed as the arithmetic mean ± S.D. of 10–20 oocytes at each data point, unless otherwise indicated. Statistical differences were determined using Student's t test. Transport kinetics were analyzed by best fit analysis of the data points in SigmaPlot using the nonlinear regression analysis equation Y = Vmax·X/Kt + X. IC50 values for inhibition of DHA transport were determined in SigmaPlot using the nonlinear regression analysis equation, y = min + (max − min)/1 + (x/IC50) − Hill slope four-parameter logistic curve.
RESULTS
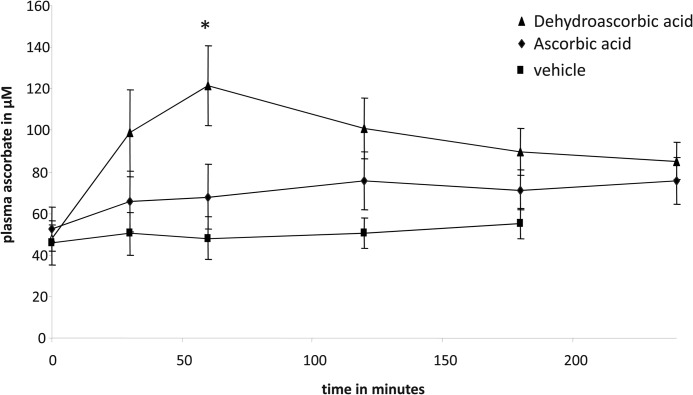
To compare Asc and DHA intestinal transport capacities, we examined their transport across rodent small intestine in vivo. Rats were gavaged with 12 mg of Asc, DHA, or PBS vehicle, and the appearance of Asc in peripheral blood was determined by HPLC. DHA gavage resulted in a rapid increase in plasma Asc concentrations, rising from a base line of 45 to 120 μm within 1 h of the DHA gavage (Fig. 1). In contrast, Asc gavage resulted in a modest increase in plasma Asc levels, from base line rising to ∼70 μm within 1–2 h of the gavage. Vehicle gavage had no effect on plasma Asc levels, which remained at base line 0–2 h after the PBS gavage (Fig. 1).
FIGURE 1.
Ascorbic acid and dehydroascorbic acid transport across rat intestine. Rats were gavaged with 12 mg of dehydroascorbic acid (▴), ascorbic acid (♦), or PBS vehicle (■). Post-gavage plasma ascorbic acid levels were determined by HPLC, as described under “Experimental Procedures.” Data represent the mean ± S.D. of at least 10 rats per gavage treatment. When compared with vehicle and ascorbic acid gavage, time-diet interactions reached significance at 60 min post-DHA gavage (*, p < 0.01 two-tailed paired t test).
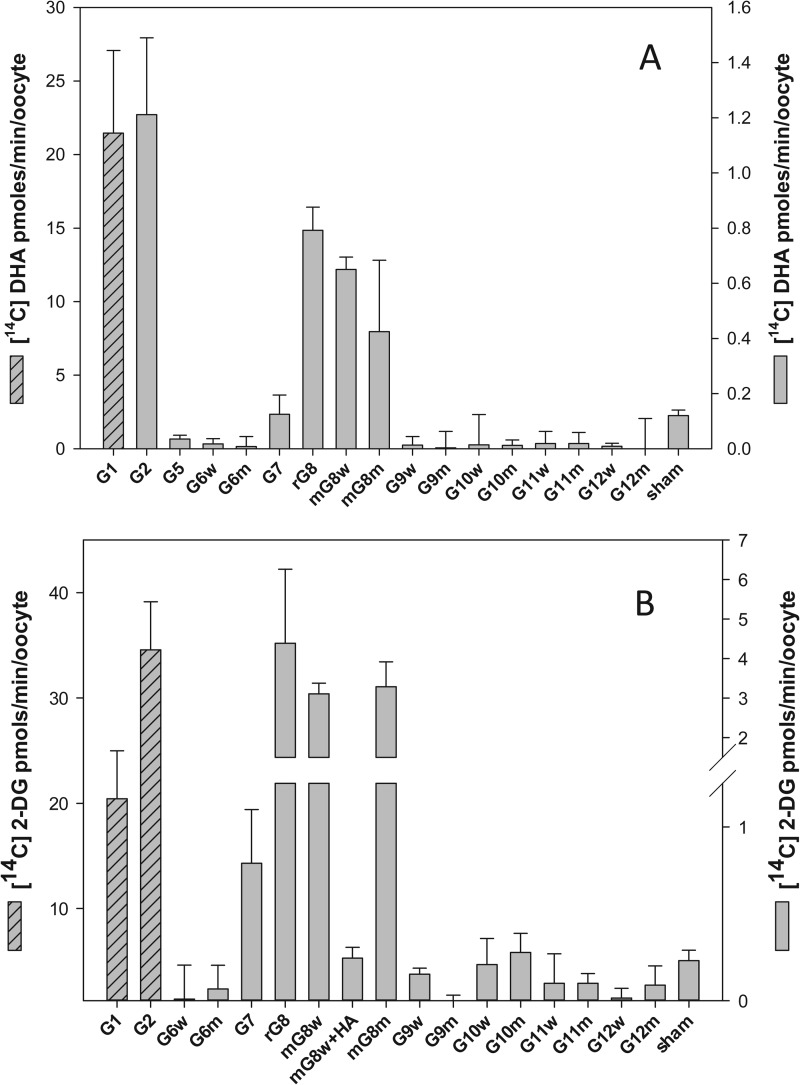
To identify candidate intestinal DHA transporters, we next investigated the DHA transport properties of GLUT1, -2, and -5–12. Previous studies (16) had shown that mutating the N-terminal di-leucine motif in rat GLUT8 to a di-alanine motif was necessary for plasma membrane expression and functional characterization in oocytes; we therefore studied the transport properties of selected human wild type (di-leucine) and mutant (di-alanine) GLUTs in injected oocytes. mRNA encoding the individual isoforms were injected into oocytes, and 3–5 days post-injection, oocytes expressing putative GLUTs were incubated with 300 μm [14C]DHA for 10 min, and radiolabeled uptake was assessed. GLUT1 mRNA was injected into oocytes and served as a positive control for GLUT-mediated DHA transport. 1 mm 2-[3H]DG uptake was also studied and served as a test for the expression of functional sugar transporters. DHA uptake into oocytes expressing human GLUT2, rat GLUT8 (LL-AA), and wild type and mutant mouse GLUT8 (LL-AA) was 5–10-fold greater than the sham-injected oocytes (Fig. 2A). Consistent with previous reports (10), DHA uptake into oocytes expressing GLUT1 was 100-fold greater than the sham control (Fig. 2A). DHA transport into GLUT5, -6, -7, -9, -10, -11, and -12 oocytes did not differ from the sham control. Radiolabeled 2-DG uptake into oocytes expressing GLUT1 and -2, rat GLUT8 (LL-AA), and wild type and mutant mouse GLUT8 was significantly greater than sham-injected oocytes (Fig. 2B). In contrast, radiolabeled 2-DG uptake in oocytes injected with mouse GLUT8 HA and wild type and mutant GLUT6, -7, -9, -10, -11, and -12 mRNA was not significantly different than the sham control. On a mole for mole basis, 2-DG and DHA uptake was similar in GLUT1-expressing oocytes, whereas for GLUT2-expressing oocytes 2-DG uptake was ∼30-fold greater than DHA, and for GLUT8 expressing oocytes 2-DG uptake was ∼5-fold greater than DHA.
FIGURE 2.
DHA and 2-DG uptake in oocytes injected to express sugar transporters. Xenopus oocytes previously injected with GLUT1, -2, and -5–12 were incubated for 10 min at room temperature with 300 μm [14C]DHA (A) or 1 mm 2-[3H]DG (B). Oocytes were then washed, and intracellular radioactivity was quantified. Control was sham water-injected oocytes. G, facilitative sugar transporter; m, mouse; r, rat; w, wild type GLUT (di-leucine motif); m, mutant GLUT (di-alanine motif); HA, human influenza hemagglutinin. Results are mean ± S.D. of 10–20 oocytes.
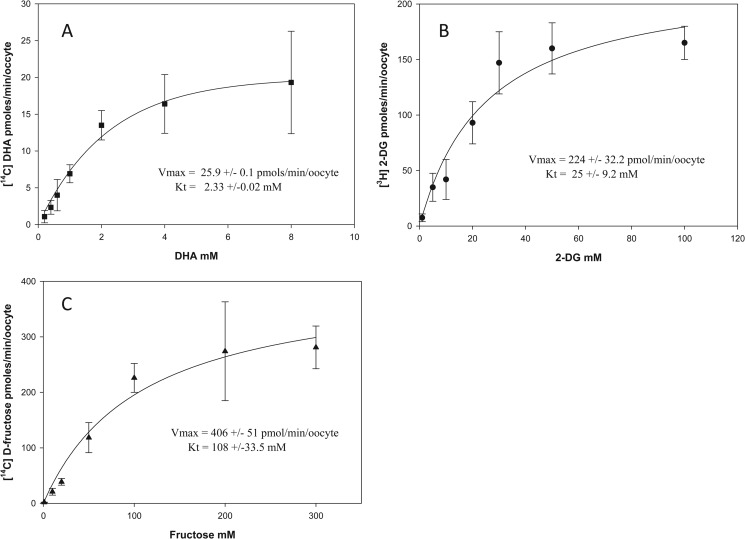
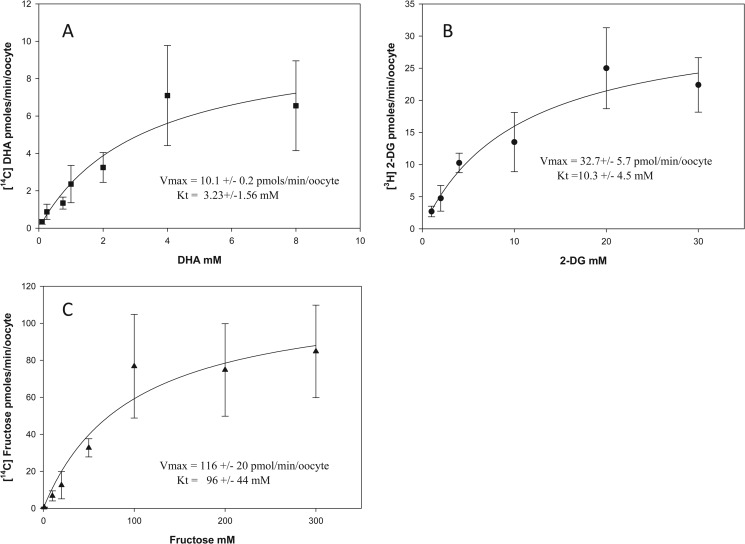
We next studied the kinetics of DHA, 2-DG, and d-fructose transport in GLUT2- and GLUT8-expressing oocytes. Oocytes injected to express GLUT2 and GLUT8 were incubated with different concentrations of [14C]DHA, 2-[3H]DG, and [14C]fructose for 10 min, and intracellular uptake of radiolabeled substrate was quantified. DHA, 2-DG, and d-fructose uptake into oocytes expressing GLUT2 (Fig. 3, A–C) and GLUT8 (Fig. 4, A–C) demonstrated Michaelis-Menten kinetics. Apparent transport kinetics was determined by nonlinear regression analysis. For GLUT2-mediated DHA uptake (Fig. 3A), the apparent Vmax was 25.9 pmol/min/oocyte, and the Km was 2.33 mm. For GLUT2-mediated 2-DG uptake (Fig. 3B), the apparent Vmax was 224 pmol/min/oocytes and the Km was 25 mm. For GLUT2-mediated fructose uptake (Fig. 3C), the apparent Vmax was 406 pmol/min/oocytes and Km was 108 mm. The differences in GLUT2 transport affinities and maximal rates for DHA, 2-DG, and fructose cannot be attributed to differences in the expression level of the transporter protein on the oocyte plasma membrane. This is because for each experimental condition oocytes were injected and incubated in an identical manner, indicating that there must be intrinsic differences in the exofacial binding, transmembrane translocation, or endofacial binding of DHA, 2-DG, and fructose by GLUT2.
FIGURE 3.
DHA, 2-deoxy-d-glucose, and d-fructose transport kinetics in GLUT2-injected oocytes. Oocytes previously injected with GLUT2 mRNA were incubated for 10 min with 0–8 mm [14C]DHA (A), 0–100 mm 2-[3H]DG (B), and 0–300 mm d-[14C]fructose (C). Oocytes were then washed and intracellular radioactivity quantified. A best fit curve was fitted to the collected data using the nonlinear regression function Y = Vmax·X/Kt + X (SigmaPlot). Data represent mean ± S.D. of 10–20 oocytes.
FIGURE 4.
DHA, 2-deoxy-d-glucose, and d-fructose transport kinetics in GLUT8-injected oocytes. Oocytes previously injected with GLUT8 mRNA were incubated for 10 min with 0–8 mm [14C]DHA (A), 0–100 mm 2-[3H]DG (B), and 0–300 mm d-[14C]fructose (C). Oocytes were then washed, and intracellular radioactivity was quantified. A best fit curve was fitted to the collected data using the nonlinear regression function Y = Vmax·X/Kt + X (SigmaPlot). Data represent mean ± S.D. of 10–20 oocytes
For GLUT8-mediated DHA uptake (Fig. 4A), the apparent Vmax was 10.1 pmol/min/oocyte, and the Km was 3.23 mm. For GLUT8-mediated 2-DG uptake (Fig. 4B), the apparent Vmax was 32.7 pmol/min/oocytes, and the Km was 10.3 mm. For GLUT8-mediated fructose uptake (Fig. 4C), the apparent Vmax was 116 pmol/min/oocytes, and the Km was 96 mm. Similar to GLUT2, the differences in the transport kinetics of GLUT8 for its substrates are most likely to be due to differences in substrate binding or translocation. Transport affinities (Km) for DHA were similar in GLUT2- (Fig. 3A) and GLUT8 (Fig. 4A)-expressing oocytes; however, the maximal transport rate (Vmax) for DHA uptake mediated by GLUT2 was 2-fold greater than that of GLUT8. This is unlikely to be due to differences between the protein expression levels of GLUT2 and GLUT8 in oocytes, because the maximal transport rates for 2-DG and fructose by GLUT2 were not 2-fold greater than GLUT8-mediated 2-DG and fructose uptake (2-DG uptake by GLUT2 was 7-fold higher than GLUT8, and d-fructose uptake by GLUT2 was 4-fold higher than GLUT8). It also unlikely to be due to intracellular reduction of DHA to Asc becoming rate-limiting for DHA transport, because previous studies have shown that intracellular accumulation of up to 1250 pmol of DHA/min/oocyte is rapidly (<10 min) and completely reduced to Asc (10).
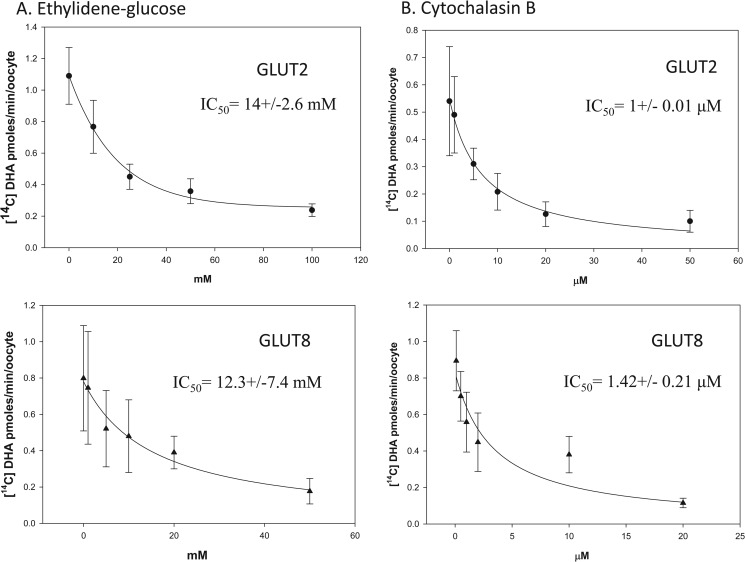
Differences in the exofacial and endofacial binding affinities of GLUT2 and GLUT8 for DHA were investigated. Oocytes expressing GLUT2 or GLUT8 were incubated with 300 μm [14C]DHA in the presence of increasing concentrations of the exofacial glucose transporter inhibitor 4,6-O-ethylidene glucose (Fig. 5A) or increasing concentrations of the endofacial glucose transporter inhibitor cytochalasin B (Fig. 5B). Intracellular uptake of radiolabeled DHA in the presence of inhibitors was quantified, and best fit curves were fitted using nonlinear regression analysis. The IC50 values for 4,6-O-ethylidene glucose inhibition of GLUT2- and GLUT8-mediated DHA uptake were 14 and 12 mm, respectively. The IC50 values for cytochalasin B inhibition of GLUT2- and GLUT8-mediated DHA uptake were 1 and 1.42 μm, respectively. These results suggest DHA binding to the external and internal face of GLUT2 and GLUT8 is comparable. Furthermore, these data suggest that the difference in the apparent maximal transport rates of GLUT2 and GLUT8 for DHA is due to differences in the transmembrane translocation of the substrate.
FIGURE 5.
Inhibition of GLUT2- and GLUT8-mediated DHA transport by exo- and endofacial sugar transporter inhibitors. Oocytes injected with GLUT2 (●) and GLUT8 (▴) were incubated with 300 μm [14C]DHA for 10 min in the presence of 0–100 mm of the exofacial sugar transporter inhibitor, ethyldiene glucose (A) and 0–50 μm of the endofacial sugar transporter inhibitor, cytochalasin B (B). Oocytes were washed, and internalized radioactivity was quantified. A best fit curve for the collected data were obtained using the nonlinear regression analysis equation, y = min + (max − min)/1 + (x/IC50) − Hill slope four-parameter logistic curve (SigmaPlot). Data represent mean ± S.D. of 10–20 oocytes.
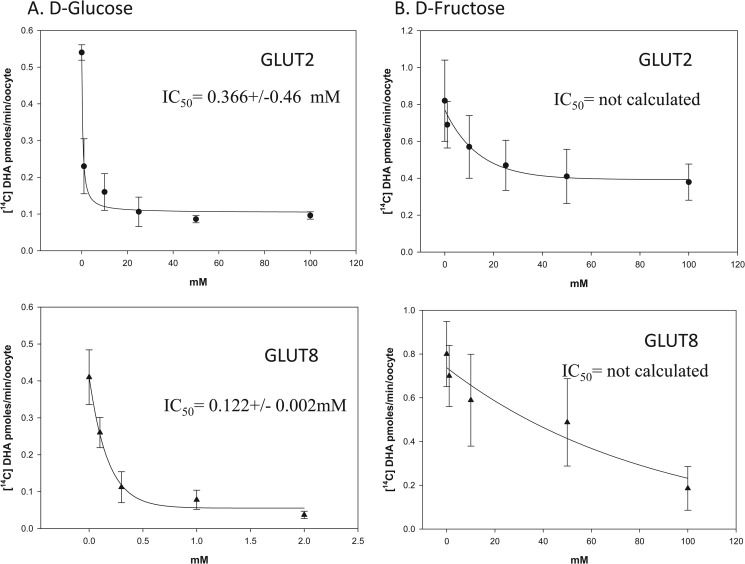
The in vivo relevance of GLUT2- and GLUT8-mediated DHA transport is dependent on oxidation of Asc to DHA and on the presence or absence of other substrates that could inhibit transport. To test whether DHA uptake by GLUT2 and GLUT8 could occur under physiologically relevant concentrations of glucose and fructose, oocytes expressing GLUT2 or GLUT8 were incubated for 10 min with 300 μm [14C]DHA in the presence of increasing concentrations of d-glucose and d-fructose (Fig. 6, A and B). The IC50 values for glucose inhibition of GLUT2- and GLUT8-mediated DHA uptake were 0.366 and 0.122 mm, respectively. The IC50 value for fructose inhibition of GLUT2 and GLUT8 could not be calculated. These data indicate that concentrations of sugars found in blood and in tissues are likely to completely inhibit DHA transport mediated by GLUT2 and GLUT8
FIGURE 6.
Inhibition of GLUT2- and GLUT8-mediated DHA uptake by sugars. Oocytes injected with GLUT2 (●) and GLUT8 (▴) were incubated with 300 μm [14C]DHA for 10 min in the presence of 0–100 mm d-glucose (A) and 0–100 mm d-fructose (B). Oocytes were washed, and internalized radioactivity was quantified. A best fit curve for the collected data was obtained using nonlinear regression analysis. Data represent mean ± S.D. of 10–20 oocytes.
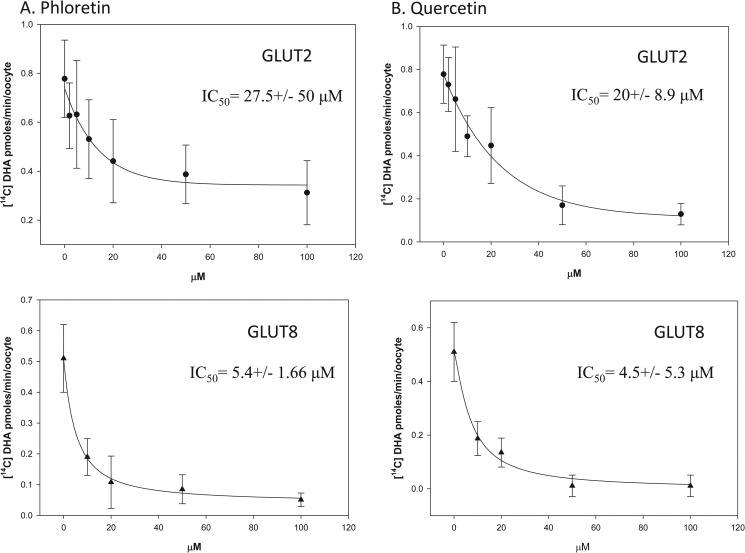
Previous reports have shown dietary flavonoids to be potent inhibitors of facilitative glucose transporters, GLUT1–4 (21–23). We therefore examined the ability of the flavonoids, phloretin, phlorizin, quercetin, and genistein to inhibit DHA uptake in oocytes expressing GLUT2 and GLUT8. Oocytes injected to express GLUT2 or GLUT8 were incubated for 10 min with 300 μm [14C]DHA in the presence of increasing concentrations of the selected flavonoids (Fig. 7, A and B). The IC50 values for phloretin inhibition of GLUT2- and GLUT8-mediated DHA uptake were 27.5 and 5.4 μm, respectively. The IC50 value for quercetin inhibition of GLUT2- and GLUT8-mediated DHA uptake were 20 and 4.5 μm, respectively. Phlorizin and genistein had no effect on GLUT2- and GLUT8-mediated DHA uptake (data not shown).
FIGURE 7.
Inhibition of GLUT2- and GLUT8-mediated DHA uptake by flavonoids. Oocytes injected with GLUT2 (●) and GLUT8 (▴) were incubated with 300 μm [14C]DHA for 10 min in the presence of 0–100 μm phloretin (A) and 0–100 μm quercetin (B). Oocytes were washed, and internalized radioactivity was quantified. A best fit curve for the collected data was obtained using nonlinear regression analysis. Data represent mean ± S.D. of 10–20 oocytes.
DISCUSSION
In this study, we demonstrated a robust DHA transport capacity across the rat intestine. Unexpectedly, the data here showed that DHA absorption was ∼3-fold more than Asc absorption, when equal doses were given. The data indicate that DHA absorption may contribute more to overall vitamin C availability than previously thought. DHA transport was also detected in oocytes injected to express human GLUT1, GLUT2, and rodent GLUT8, whereas wild type and mutant human GLUT6, -7, -9, -10, -11, and -12 failed to transport DHA when expressed in oocytes. Consistent with other reports (10, 16, 24), 2-DG uptake was detected in oocytes expressing GLUT1, GLUT2, GLUT7, and GLUT8 but not in oocytes injected to express GLUT6, -9, -10, -11, and -12.
The reasons are unclear for the lack of transport of 2-DG or DHA by human GLUT6-, -9-, -10-, -11-, and -12-injected in oocytes. We cannot rule out the possibility that GLUTs failed to express in the plasma membrane. However, for the following reasons we believe this is unlikely. Previous reports have already demonstrated that the new GLUTs have very low glucose transport activities when expressed in heterologous systems, suggesting the natural substrate may not in fact be glucose. For example, GLUT9 has recently been characterized as a uric acid transporter (25). We attempted to address the possibility of poor plasma membrane expression by mutating the N-terminal di-leucine motif of selected GLUTs to di-alanine, but without effect. In addition, to semi-quantitatively determine protein expression levels we obtained commercial antibodies to the new GLUTs, but peptide competition studies indicated that all antibodies tested were not capable of detecting new GLUTs (data not shown). HA tagging the proteins was also considered. However, mouse GLUT8 HA-tagged constructs had no glucose transport activity when compared with sham-injected oocytes, even though de-tagged GLUT8 had glucose transport activity (Fig. 2B). These data strongly suggest that HA tagging rendered GLUT8 nonfunctional and could have similar effects on other GLUT clones. Transport findings for HA-tagged GLUTs might not predict transport activity in either direction for untagged proteins and further tagging would not provide clarity.
The data here show that maximal rates for DHA transport mediated by GLUT2 and GLUT8 were much lower than for glucose and fructose transport. Several possibilities might explain these differences as follows: transactivation of transport by sugars but not by DHA; differences in the internal and external binding affinities of GLUTs for DHA and sugars; or differences in the transmembrane translocation of substrates through the transporter pore. Transactivation is unlikely to explain our data because previous studies have shown lower maximal transport rates for DHA than for sugar in oocytes expressing GLUTs independent to trans-activation (11). The external binding affinities of DHA and sugars might however be responsible because the calculated IC50 value for the exofacial sugar transport inhibitor 4,6-O-ethyldiene-d-glucose in GLUT2- and GLUT8-expressing oocytes transporting 300 μm DHA of 12–14 μm was much lower than the IC50 value for EG inhibition of sugar transport mediated by GLUT2 of 40–50 mm (26). Differences in the internal binding affinities of GLUT2 and GLUT8 for their substrates are unlikely to explain our data because the calculated IC50 values for the endofacial sugar transporter inhibitor cytochalasin B in GLUT2- and GLUT8-expressing oocytes transporting DHA of 1–1.4 μm were comparable with the IC50 for cytochalasin B inhibition of sugar transport by GLUT2 (26). We cannot rule out this completely, however, because DHA is immediately reduced back to Asc once it is internalized.
Based on the data in this report, we suggest that GLUT2, and possibly GLUT8, might be responsible for the glucose-sensitive transport of luminal DHA across the intestine. GLUT2 is a facilitative glucose/fructose transporter expressed in the gut, liver, pancreatic beta cell, and kidney. In the classic model of intestinal sugar transport, GLUT2 is expressed on the basolateral membrane and is responsible for the transport of glucose/fructose from the enterocyte into the portal circulation. More recent studies however have shown that luminal glucose activates the sweet taste receptor, T1R2/3, resulting in GLUT2 being expressed in the apical membrane (27). In this report, GLUT2-expressing oocytes transported DHA; and rat intestine, a tissue that is known to express GLUT2, also transported DHA, as shown by a robust appearance of Asc in the circulation. Because the apical membrane glucose/galactose transporter, SGLT1, and the fructose transporter, GLUT5, do not transport DHA (10), luminal uptake of DHA into the enterocyte could be mediated by apical GLUT2. If correct, this suggests luminal DHA, which is a structural analog of glucose, regulates apical GLUT2 expression levels via T1r2/3 activation. The regulation of gastrointestinal function by DHA activation of the sweet taste receptor warrants further investigation.
GLUT8 may also contribute toward intestinal DHA transport. GLUT8 is expressed in the small intestine (12), and in our report rodent GLUT8 transported DHA when expressed in oocytes. In previous reports a di-leucine motif in rat GLUT8 had been identified that was responsible for preventing the expression of the transporter in the plasma membrane (16, 17). In this study, the di-leucine motif did not prevent the functional expression of mouse GLUT8. We cannot explain why there may be a difference in the motifs responsible for regulating the plasma membrane expression of rat and mouse GLUT8, but the data suggest other motifs may be important.
The extent to which Asc is oxidized in the intestinal lumen to DHA is unknown. However, the robust increase in systemic Asc levels that occurred following DHA gavage when compared with Asc gavage suggests that Asc oxidation and uptake of DHA by apical GLUT2 (and possibly GLUT8) might substantially contribute to enteral absorption of vitamin C. DHA entering the enterocyte would be expected to be rapidly reduced back to Asc by NADPH-dependent thioredoxin reductase or glutathione-dependent DHA reductase (28). Asc would then be transported across the basolateral membrane into the portal circulation by a mechanism that has yet to be identified. An alternative possibility is that intracellular DHA is not reduced back to Asc, and instead it effluxes the enterocyte via basolateral GLUT2; it could then be reduced back to ascorbic acid via a basolateral membrane-localized oxidoreductase protein, such as hephaestin, which is involved in the conversion of Fe2+ to Fe3+ in portal blood (29).
Previous studies have shown that flavonoids present in vitamin C-rich foods (fruits and vegetables) can inhibit sodium-dependent Asc transporter-mediated Asc transport (30) and GLUT-mediated DHA transport (21). Physiologic levels of glucose can also inhibit GLUT-mediated DHA transport (10). In this study, the IC50 value for d-glucose inhibition of DHA transport by GLUT2 and GLUT8 in oocytes is 0.366 and 0.122 mm, respectively. Quercetin and phloretin were also potent inhibitors of DHA transport in oocytes expressing GLUT2 and GLUT8. Consumption of sugar-sweetened beverages or fruits juices containing free sugars and flavonoids might therefore result in diminished intestinal absorption of DHA, particularly in the proximal regions of the small intestine, and result in a lower predicted bioavailability for vitamin C. For meals containing complex carbohydrates, digestion and liberation of free sugars occur principally in the jejunum. We would therefore expect DHA uptake to be largely unimpeded in the duodenum and possibly the ileum.
In the intestine, glucose-insensitive DHA transport might occur if a fraction of luminal DHA is reduced back to Asc, which is then transported across the apical membrane by the glucose-insensitive SVCT1. For this to occur, a reducing agent must be present at the luminal surface. Duodenal cytochrome b561 (DcytB) is an apical membrane-expressed protein that catalyzes the reduction of Fe3+ to Fe2+ and facilitates iron absorption (31). Interestingly, iron absorption is normal in DcytB knock-out mice (32), suggesting the protein has alternative functions in vivo. Erythrocyte Cyt b561 is believed to be responsible for extracellular recycling of Asc via reduction of mono-DHA/DHA (33). We therefore speculate that DcytB acts as an apical membrane electron donor reducing DHA to Asc.
In summary, in this report we have shown the intestine can absorb both Asc and DHA. Intestinal uptake of Asc is mediated by the Na+-dependent transporter SVCT1. Kinetics studies in oocytes suggest GLUT2 and GLUT8 are low affinity/low capacity DHA transporters responsible for intestinal uptake of DHA. Furthermore, vitamin C bioavailability may be reduced by luminal dietary factors inhibiting DHA transport mediated by intestinal GLUT2 and GLUT8.
This work was supported, in whole or in part, by National Institutes of Health Intramural Research Program Grant DK054506-15 from NIDDK.
- Asc
- ascorbic acid
- DHA
- dehydroascorbic acid
- GLUT
- facilitative glucose transporter
- m
- mouse
- r
- rat
- WT
- wild type; GLUT (di-leucine motif)
- m
- mutant GLUT (di-alanine motif)
- HA
- human influenza hemagglutinin
- 2-DG
- 2-deoxy-d-glucose
- DcytB
- duodenal cytochrome b561.
REFERENCES
- 1. Koshiishi I., Mamura Y., Liu J., Imanari T. (1998) Degradation of dehydroascorbate to 2,3-diketogulonate in blood circulation. Biochim. Biophys. Acta 1425, 209–214 [DOI] [PubMed] [Google Scholar]
- 2. Tsukaguchi H., Tokui T., Mackenzie B., Berger U. V., Chen X. Z., Wang Y., Brubaker R. F., Hediger M. A. (1999) A family of mammalian Na+-dependent l-ascorbic acid transporters. Nature 399, 70–75 [DOI] [PubMed] [Google Scholar]
- 3. Sotiriou S., Gispert S., Cheng J., Wang Y., Chen A., Hoogstraten-Miller S., Miller G. F., Kwon O., Levine M., Guttentag S. H., Nussbaum R. L. (2002) Ascorbic acid transporter Slc23a1 is essential for vitamin C transport into the brain and for perinatal survival. Nat. Med. 8, 514–517 [DOI] [PubMed] [Google Scholar]
- 4. Li H., Tu H., Wang Y., Levine M. (2012) Vitamin C in mouse and human red blood cells: an HPLC assay. Anal. Biochem. 426, 109–117 [DOI] [PMC free article] [PubMed] [Google Scholar]
- 5. Corpe C. P., Tu H., Eck P., Wang J., Faulhaber-Walter R., Schnermann J., Margolis S., Padayatty S., Sun H., Wang Y., Nussbaum R. L., Espey M. G., Levine M. (2010) Vitamin C transporter Slc23a1 links renal reabsorption, vitamin C tissue accumulation, and perinatal survival in mice. J. Clin. Invest. 120, 1069–1083 [DOI] [PMC free article] [PubMed] [Google Scholar]
- 6. Oliveira J. E., Pearson W. N., Darby W. J. (1959) Clinical usefulness of the oral ascorbic acid tolerance test in scurvy. Am. J. Clin. Nutr. 7, 630–633 [DOI] [PubMed] [Google Scholar]
- 7. Goldman H. M., Gould B. S., Munro H. N. (1981) The antiscorbutic action of l-ascorbic acid and d-isoascorbic acid (erythorbic acid) in the guinea pig. Am. J. Clin. Nutr. 34, 24–33 [DOI] [PubMed] [Google Scholar]
- 8. Ogiri Y., Sun F., Hayami S., Fujimura A., Yamamoto K., Yaita M., Kojo S. (2002) Very low vitamin C activity of orally administered l-dehydroascorbic acid. J. Agric. Food Chem. 50, 227–229 [DOI] [PubMed] [Google Scholar]
- 9. Otsuka M., Kurata T., Arakawa N. (1986) Antiscorbutic effect of dehydro-l-ascorbic acid in vitamin C-deficient guinea pigs. J. Nutr. Sci. Vitaminol. 32, 183–190 [DOI] [PubMed] [Google Scholar]
- 10. Rumsey S. C., Kwon O., Xu G. W., Burant C. F., Simpson I., Levine M. (1997) Glucose transporter isoforms GLUT1 and GLUT3 transport dehydroascorbic acid. J. Biol. Chem. 272, 18982–18989 [DOI] [PubMed] [Google Scholar]
- 11. Rumsey S. C., Daruwala R., Al-Hasani H., Zarnowski M. J., Simpson I. A., Levine M. (2000) Dehydroascorbic acid transport by GLUT4 in Xenopus oocytes and isolated rat adipocytes. J. Biol. Chem. 275, 28246–28253 [DOI] [PubMed] [Google Scholar]
- 12. Romero A., Gomez O., Terrado J., Mesonero J. E. (2009) Expression of GLUT8 in mouse intestine: identification of alternative spliced variants. J. Cell. Biochem. 106, 1068–1078 [DOI] [PubMed] [Google Scholar]
- 13. Manolescu A. R., Witkowska K., Kinnaird A., Cessford T., Cheeseman C. (2007) Facilitated hexose transporters: new perspectives on form and function. Physiology 22, 234–240 [DOI] [PubMed] [Google Scholar]
- 14. Washko P. W., Hartzell W. O., Levine M. (1989) Ascorbic acid analysis using high-performance liquid chromatography with coulometric electrochemical detection. Anal. Biochem. 181, 276–282 [DOI] [PubMed] [Google Scholar]
- 15. Burant C. F., Bell G. I. (1992) Mammalian facilitative glucose transporters: evidence for similar substrate recognition sites in functionally monomeric proteins. Biochemistry 31, 10414–10420 [DOI] [PubMed] [Google Scholar]
- 16. Ibberson M., Uldry M., Thorens B. (2000) GLUTX1, a novel mammalian glucose transporter expressed in the central nervous system and insulin-sensitive tissues. J. Biol. Chem. 275, 4607–4612 [DOI] [PubMed] [Google Scholar]
- 17. Lisinski I., Schürmann A., Joost H. G., Cushman S. W., Al-Hasani H. (2001) Targeting of GLUT6 (formerly GLUT9) and GLUT8 in rat adipose cells. Biochem. J. 358, 517–522 [DOI] [PMC free article] [PubMed] [Google Scholar]
- 18. Soreq H., Seidman S. (1992) Xenopus oocyte microinjection: from gene to protein. Methods Enzymol. 207, 225–265 [DOI] [PubMed] [Google Scholar]
- 19. Vera J. C., Rivas C. I., Fischbarg J., Golde D. W. (1993) Mammalian facilitative hexose transporters mediate the transport of dehydroascorbic acid. Nature 364, 79–82 [DOI] [PubMed] [Google Scholar]
- 20. Corpe C. P., Lee J. H., Kwon O., Eck P., Narayanan J., Kirk K. L., Levine M. (2005) 6-Bromo-6-deoxy-l-ascorbic acid: an ascorbate analog specific for Na+-dependent vitamin C transporter but not glucose transporter pathways. J. Biol. Chem. 280, 5211–5220 [DOI] [PubMed] [Google Scholar]
- 21. Kwon O., Eck P., Chen S., Corpe C. P., Lee J. H., Kruhlak M., Levine M. (2007) Inhibition of the intestinal glucose transporter GLUT2 by flavonoids. FASEB J. 21, 366–377 [DOI] [PubMed] [Google Scholar]
- 22. Smith R. M., Tiesinga J. J., Shah N., Smith J. A., Jarett L. (1993) Genistein inhibits insulin-stimulated glucose transport and decreases immunocytochemical labeling of GLUT4 carboxyl terminus without affecting translocation of GLUT4 in isolated rat adipocytes: additional evidence of GLUT4 activation by insulin. Arch. Biochem. Biophys. 300, 238–246 [DOI] [PubMed] [Google Scholar]
- 23. Park J. B. (1999) Flavonoids are potential inhibitors of glucose uptake in U937 cells. Biochem. Biophys. Res. Commun. 260, 568–574 [DOI] [PubMed] [Google Scholar]
- 24. Li Q., Manolescu A., Ritzel M., Yao S., Slugoski M., Young J. D., Chen X. Z., Cheeseman C. I. (2004) Cloning and functional characterization of the human GLUT7 isoform SLC2A7 from the small intestine. Am. J. Physiol. Gastrointest. Liver Physiol. 287, G236–G242 [DOI] [PubMed] [Google Scholar]
- 25. Bibert S., Hess S. K., Firsov D., Thorens B., Geering K., Horisberger J. D., Bonny O. (2009) Mouse GLUT9: evidences for a urate uniporter. Am. J. Physiol. Renal Physiol. 297, F612–F619 [DOI] [PubMed] [Google Scholar]
- 26. Colville C. A., Seatter M. J., Jess T. J., Gould G. W., Thomas H. M. (1993) Kinetic analysis of the liver-type (GLUT2) and brain-type (GLUT3) glucose transporters in Xenopus oocytes: substrate specificities and effects of transport inhibitors. Biochem. J. 290, 701–706 [DOI] [PMC free article] [PubMed] [Google Scholar]
- 27. Mace O. J., Affleck J., Patel N., Kellett G. L. (2007) Sweet taste receptors in rat small intestine stimulate glucose absorption through apical GLUT2. J. Physiol. 582, 379–392 [DOI] [PMC free article] [PubMed] [Google Scholar]
- 28. May J. M. (2002) Recycling of vitamin C by mammalian thioredoxin reductase. Methods Enzymol. 347, 327–332 [DOI] [PubMed] [Google Scholar]
- 29. Anderson G. J., Frazer D. M. (2005) Recent advances in intestinal iron transport. Curr. Gastroenterol. Rep. 7, 365–372 [DOI] [PubMed] [Google Scholar]
- 30. Song J., Kwon O., Chen S., Daruwala R., Eck P., Park J. B., Levine M. (2002) Flavonoid inhibition of sodium-dependent vitamin C transporter 1 (SVCT1) and glucose transporter isoform 2 (GLUT2), intestinal transporters for vitamin C and glucose. J. Biol. Chem. 277, 15252–15260 [DOI] [PubMed] [Google Scholar]
- 31. Latunde-Dada G. O., Van der Westhuizen J., Vulpe C. D., Anderson G. J., Simpson R. J., McKie A. T. (2002) Molecular and functional roles of Dcytb in iron metabolism. Blood Cells Mol. Dis. 29, 356–360 [DOI] [PubMed] [Google Scholar]
- 32. McKie A. T. (2008) The role of Dcytb in iron metabolism: an update. Biochem. Soc. Trans. 36, 1239–1241 [DOI] [PubMed] [Google Scholar]
- 33. Su D., May J. M., Koury M. J., Asard H. (2006) Human erythrocyte membranes contain a cytochrome b561 that may be involved in extracellular ascorbate recycling. J. Biol. Chem. 281, 39852–39859 [DOI] [PubMed] [Google Scholar]


