

Background: Glioblastoma is the most prevalent brain tumor with the poorest prognosis.
Results: Methylene blue enhances oxygen consumption, reduces lactate production, and inhibits glioblastoma cell proliferation.
Conclusion: Reversal of the Warburg effect could inhibit glioblastoma cell proliferation.
Significance: Modulation of cancer cell bioenergetics and reversal of Warburg effect might provide a novel therapy for glioblastoma.
Keywords: AMP-activated Kinase (AMPK), Bioenergetics, Cell Metabolism, Energy Metabolism, Glioblastoma, Tumor Metabolism, Methylene Blue, Warburg Effect
Abstract
Glioblastoma multiforme (GBM), like most cancers, possesses a unique bioenergetic state of aerobic glycolysis known as the Warburg effect. Here, we documented that methylene blue (MB) reverses the Warburg effect evidenced by the increasing of oxygen consumption and reduction of lactate production in GBM cell lines. MB decreases GBM cell proliferation and halts the cell cycle in S phase. Through activation of AMP-activated protein kinase, MB inactivates downstream acetyl-CoA carboxylase and decreases cyclin expression. Structure-activity relationship analysis demonstrated that toluidine blue O, an MB derivative with similar bioenergetic actions, exerts similar action in GBM cell proliferation. In contrast, two other MB derivatives, 2-chlorophenothiazine and promethazine, exert no effect on cellular bioenergetics and do not inhibit GBM cell proliferation. MB inhibits cell proliferation in both temozolomide-sensitive and -insensitive GBM cell lines. In a human GBM xenograft model, a single daily dosage of MB does not activate AMP-activated protein kinase signaling, and no tumor regression was observed. In summary, the current study provides the first in vitro proof of concept that reversal of Warburg effect might be a novel therapy for GBM.
Introduction
Glioblastoma multiforme (GBM)3 is the most common brain tumor with a median survival rate between 1 and 2 years (1). Despite the development of modern diagnostic modalities, surgical procedures, and adjuvant therapies, the prognosis of GBM has remained largely unchanged over the last several decades (2). Current treatments emphasize surgery followed by radiation and chemotherapy with temozolomide (TMZ) (3, 4). This combination therapy extends the median survival up to 8 months depending on the location and genetic background of the tumor (5, 6).
GBM, like most cancers, presents a unique metabolic state known as the Warburg effect, where cancer cells utilize aerobic glycolysis as the primary supplier of ATP (7). The concepts for cancer cell metabolism identified by Warburg have undergone substantial revisions over the last 90 years; however, the advantage the metabolic transformation confers to cancer cells remains unclear (8, 9). Recently, the discovery of the connection between oncogenes and metabolic processes has led to a resurgence of interest in Warburg's work. There is increasing evidence indicating that the adaption of aerobic glycolysis by cancer cells might facilitate biomass accumulation; hence, cancer proliferation (9). Cancer metabolism has been under extensive exploration in the hope of discovering new effective therapies for cancer.
Methylene blue (MB), synthesized in 1876, has been in clinical application for more than a century in diagnostic procedures and as a treatment of multiple disorders such as methemoglobinemia, malaria, ifosfamide neurotoxicity, and cyanide poisoning (10, 11). There is mounting evidence that MB enhances brain metabolism and exerts neuroprotective effects in multiple neurodegenerative disease models including Parkinson, Alzheimer, and Huntington disease (12–16). MB has long been known as an electron carrier, which is best represented by MB ability to increase the rate of cytochrome c reduction in isolated mitochondria (17). We have recently documented that MB functions as an alternative mitochondrial electron transfer carrier between mitochondria complexes I and III, increases cellular oxygen consumption, and decreases lactate production in murine hippocampal cells (12). In the current study we tested the hypothesis that reversal of the Warburg effect by MB inhibits GBM cell proliferation. We determined the effect of MB on GBM cell proliferation using multiple GBM cell lines and dissected its underlying signaling mechanisms.
EXPERIMENTAL PROCEDURES
Cell Culture and Other Reagents
U87 MG (U87), A172, and T98G cell lines were obtained from American Type Culture Collection (ATCC). Cells were grown on 10-cm culture plates (Greiner) in DMEM high glucose with pyruvate (Hyclone) and 10% FBS. Cells were cultured from passages 5 to 25 with media changed every 2–3 days. Human primary astrocyte cultures were gifts from Dr. Anuja Ghorpade (University of North Texas Health Science Center) and cultured as described previously (18). MB was purchased from American Regent. Toluidine Blue O, promethazine, 2-chlorophenothiazine, rotenone, carbonyl cyanide-4-(trifluoromethoxy) phenylhydrazone (FCCP), oligomycin, EDTA, MgSO4, NaCl, 2.5 mm CaCl2, NaN3, and crystal violet were purchased from Sigma. Propidium iodide was purchased from Calbiochem.
Cellular Bioenergetics Analysis
U87 or other GBM cells were plated at a density of 30,000/well in an XF24 plate. Cells were allowed to grow overnight, and the media were exchanged 1 h before the assay for XF24 media. Rotenone, FCCP, and oligomycin were diluted into XF24 media and loaded into the accompanying cartridge to achieve final concentrations of 100 nm, 300 nm, and 1 μg/ml, respectively. Injections of the drugs into the medium occurred at the time points specified. Oxygen consumption and extracellular acidification rates were monitored using a Seahorse Bioscience XF24 Extracellular Flux Analyzer.
Growth Curve Assay
U87, A172, and T98G cells were seeded into 12-well culture plates (Greiner) at a concentration of 25,000 cells/well in 0.5 ml of DMEM with pyruvate (10% FBS). Drugs were added to each well to obtain the desired concentration in a final volume of 1 ml per well. Day of seeding was considered day 0. Plates were incubated in a humidified incubator at 37 °C and 5% CO2. Cells were harvested on each indicated day using 0.25% trypsin-EDTA (Invitrogen) and counted using an inverted phase contrast Zeiss Invertoskop microscope.
Liquid Colony Formation Assay
Cells were seeded into 6-well culture plates (Greiner) at a concentration of 50 cells/well in 1 ml of DMEM with pyruvate (10% FBS). Drugs were added to each well to obtain the desired concentration in a final volume of 2 ml per well. Plates were incubated for 4 weeks undisturbed. Colonies were stained with crystal violet as follows. Culture plates were numbered for identification and placed on ice; colonies were gently washed 2× with ice-cold PBS; colonies were then fixed with ice-cold methanol for 10 min; methanol was aspirated from the wells, and the plates were moved to the bench-top where the colonies were stained with 0.5% crystal violet in 25% methanol for 10 min; the crystal violet solution was removed, and the plates were washed by immersing in a bucket of cold tap water until the water ran clear; plates were then inverted on an absorbent pad and allowed to dry overnight. Stained colonies were counted, and the number and size were recorded.
Soft Agar Assay
The soft agar colony anchorage independent assay was performed as described previously (19). U87 cells at a density of 5000 cells/well were seeded into 6-well plates in a 0.6% agar DMEM solution containing vehicle or MB at the specified concentrations for a total media volume of 1.5 ml. The cells were incubated at 37 °C and 5% CO2 for 3 weeks. The number of cells/well was determined by an independent researcher using an inverted phase contrast Zeiss Invertoskop. Colony diameter was determined by imaging colonies with a Zeiss Observer Z1and calculating the diameter of the colonies with Zeiss AxioVision software.
ATP Measurements
ATP kit was purchased from Invitrogen. U87 cells were seeded into 6-well plates at a density of 200,000 cells/well. Cells were allowed to attach overnight. Media were removed and replaced with fresh media containing specified concentrations of MB. The cells were incubated at 37 °C and 5% CO2 for 24 h. Then the cells were trypsinized for 5 min and placed in a 1.5-ml Eppendorf tube, centrifuged at 1200 × g for 5 min at 4 °C, and washed with PBS. The cells were centrifuged and washed with PBS twice more and finally lysed with 200 μl of ATP assay buffer (500 mm Tricine buffer, pH 7.8, 100 mm MgSO4, 2 mm EDTA, and 2 mm sodium azide) containing 1% Triton X-100. 10-μl cell lysate was added in triplicate to a white 96-well plate along with an ATP standard curve. Before reading the plate, 100 μl of ATP reaction buffer (30 μg/ml d-luciferin, 20 μm DTT, and 25 μg/ml Luciferase) was added to each well. Luminescence was measured using a Tecan Infinite F200 plate reader. Protein concentration was measured simultaneously using the Pierce 660 nm Protein Assay (660 nm absorbance), and ATP production was normalized to protein content of the samples.
Glucose and Lactate Measurements
Glucose was quantified using a manufactured kit from Sigma. In brief, 200,000 U87 cells were seeded into 6-well plates and allowed to attach overnight. The following morning the media were replaced with 2 ml of fresh DMEM high glucose (4.5 g/liter glucose) containing the indicated concentrations of MB. After the allotted time, medium was removed and added to a 96-well plate proportionately (1:3) with glucose assay buffer containing glucose oxidase, horseradish peroxidase, and O-dianisidine. The reaction was allowed to proceed for 30 min at which point the enzymes were denatured with 12 n sulfuric acid. Absorbance was measured with a Tecan Infinite F200 plate reader at 540 nm. Lactate concentration in the media was measured by GEM 3000 analyzer (Instrumentation Laboratory Co., Bedford, MA).
NADP+/NADPH Quantification
NADP+ and NADPH were determined with an enzymatic cycling reaction assay (BioVision, Mountain View, CA). The assay was performed according to the manufacturer's instructions. Briefly, U87 cells were washed with PBS and extracted with NADP+/NADPH extraction buffer by homogenization. First, total NADP was measured with extract. Second, NADP from extract was decomposed by heating at 60 °C for 30 min in a heating block. Then, following the manufacturer's protocol, NADP+ and NADPH were detected at 450 nm and quantified with a standard curve. Values presented are the ratio of NADPH to total NADP (NADPH + NADP+).
Cell Cycle Analysis
Cells were plated at a density of 200,000 cells/well and attached overnight. The following day, the cells were deprived of FBS overnight to standardize the cell cycle followed by fresh DMEM containing 10% FBS and the indicated concentration of MB. At the specified times, cells were harvested using 0.5% trypsin (Invitrogen) and washed with wash buffer (0.1% FBS in PBS) twice to remove trypsin. Cells were fixed in ice-cold 70% ethanol for 45 min at 4 °C. Ethanol was removed by washing twice with PBS, and the cells were incubated with propidium iodide (PI) (40 μg/ml) and RNase (10 μg/ml) for 30 min at 37 °C. Samples were analyzed using Beckman Coulter FC500 Flow Cytometry Analyzer.
Western Blot
U87 cells were plated at a density of 200,000 cells/well in a 6-well plate. Cells attached overnight, and individual drugs were added to the cells in fresh media the following day at the indicated concentrations. Cells were grown for the indicated times and lysed in radioimmune precipitation assay buffer with protease and phosphatase inhibitors. Cell lysate was loaded onto a 6% (acetyl-CoA carboxylase (ACC) and mammalian target of rapamycin (mTOR)) or 10% polyacrylamide gel and transferred onto nitrocellulose. After blocking with 5% milk for 1 h, nitrocellulose membrane was incubated with primary antibody overnight at 4 °C at the indicated concentrations (AMPKα, Cell Signaling, 1:500; P-AMPKα, Cell Signaling, 1: 500; AMPKβ, Cell Signaling, 1:500; P-AMPKβ, Cell Signaling, 1:500; ACC, 1:500, Cell Signaling; p-ACC, Cell Signaling, 1:500; mTOR, Cell Signaling, 1:500; P-mTOR, Cell Signaling, 1:500; Cyclin A2, Cell Signaling, 1:500; Cyclin B1, Cell Signaling, 1:750; Cyclin D1, Cell Signaling, 1:750; Cyclin E1, Cell Signaling, Santa Cruz Biotechnology, 1:1000; β-Actin, Santa Cruz Biotechnology, 1:1000). Secondary antibody linked to horseradish peroxidase (Jackson ImmunoResearch) was incubated for 2 h at room temperature (1:2000). Chemiluminescence was detected with a UVP Biospectrum 500.
Annexin V/PI Cell Viability
Annexin V kit was purchased from BD Biosciences. U87 cells were seeded at a density of 200,000 cells/well in 6-well plates. The cells were treated with MB at the indicated concentrations for 3 days at which time the cells were harvested with 2 mm EDTA in PBS. Cells were resuspended in binding buffer (10 mm HEPES, 140 mm NaCl, 2.5 mm CaCl2) containing biotin-labeled annexin V (1:20 dilution). Cells were washed and resuspended in binding buffer containing streptavidin-labeled FITC and PI at a final concentration of 5 μg/ml. After 20-min incubation in the dark, cells were analyzed with a Beckman Coulter FC500.
Tumor Xenografts Model
All animal procedures conformed to Institutional Animal Care and Use Committee and National Institute of Health guidelines. Female athymic mice (nu/nu genotype, Balb/c background, 6–8 weeks old) were used for all antitumor studies. The following patient-derived adult human glioblastoma xenografts, maintained at the Preston Robert Tisch Brain Tumor Center at Duke, were used, and for the xenografts studies, D-08-0430 MG and D-09-0326 MG were used. For studies, subcutaneous xenografts passaged in athymic mice were excised from host mice under sterile conditions in a laminar flow containment hood. The xenograft was homogenized with the use of a tissue press/modified tissue cytosieve (BioWhittaker Inc., Walkersville, MD). The tumor homogenate was then loaded into a repeating Hamilton syringe (Hamilton, Co., Reno, NV) dispenser and injected subcutaneously into the right flank of the athymic mouse at an inoculation volume of 50 μl with a 19-gauge needle (20). Subcutaneous tumors were measured twice weekly with handheld vernier calipers (Scientific Products, McGraw, IL). Tumor volumes, V, were calculated with the following formula: (width2 × length)/2 = V (mm3).
For MB treatment, groups of mice randomly selected by tumor volume were treated when the median tumor volumes were on average 150 mm3 and compared with control animals receiving vehicle (saline). MB (10 and 50 mg/kg/day) or vehicle were administered via gavage once a day until the tumor volume reach a volume 5 times greater than that measured at the start of the treatment (∼4 weeks) and was at least 1000 mm3. The response of sc xenografts to treatment was assessed by delay in tumor growth and by tumor regression. Growth delay, expressed as T-C, is defined as the difference in days between the median time required for tumors in treated (T) and control (C) animals to reach a volume five times greater than that measured at the start of the treatment. Tumor regression is defined as a decrease in tumor volume over two successive measurements. Statistical analysis was performed using a SAS statistical analysis program, the Wilcoxon rank order test for growth delay, and Fisher's exact test for tumor regression as previously described (20, 21).
Statistic Analysis
All data are presented as the mean ± S.E. The significance of differences among groups with one independent variable was determined by one-way ANOVA with a Tukey's multiple comparisons test for planned comparisons between groups when significance was detected. The significance of differences among groups where two independent variables were present was determined by two-way ANOVA with a Bonferroni post-test for planned comparisons between groups when significance was detected. For all tests, p < 0.05 was considered significant.
RESULTS
MB Decreases Aerobic Glycolysis in U87 Cells
The cellular oxygen consumption rate (OCR) and extracellular acidification rate (ECAR) of U87 cells, a glioblastoma cell line originated from a human female patient, were compared with primary female human astrocytes to determine the differences in cellular metabolism between cancerous and healthy cells. We observed that U87 cells have a 2-fold higher OCR when compared with primary astrocytes under normal culture conditions. However, when maximum cellular OCR capacity was induced by FCCP (i.e. mitochondria membrane uncoupler), both U87 cells and human primary astrocytes attained a similar OCR (Fig. 1A). ECAR, an indirect measurement of lactate production, was 3-fold higher in U87 cells compared with human astrocytes (Fig. 1B).
FIGURE 1.

MB increases OCR and decreases ECAR in U87 cells. A, OCR of human female primary astrocytes and U87 glioma cells is shown. Although U87 cells have a higher base-line OCR, both were able to obtain a similar maximum OCR upon FCCP treatment. B, ECAR of female primary astrocytes and U87 glioma cells is shown. U87 cells maintained a greater ECAR compared with human female astrocytes. C, effects of MB at concentrations of 100 nm, 1 μm, and 10 μm on U87 cell OCR are shown. D, effects of MB at concentrations of 100 nm, 1 μm, and 10 μm on U87 cell ECAR are shown. E, MB significantly increased U87 cell OCR at concentrations of 1 and 10 μm. F, MB significantly decreased U87 cell ECARs at concentrations of 1 and 10 μm. * indicates p < 0.05 by 1-way ANOVA and Tukey's post-hoc test.
We tested the effect of MB on metabolism at a dose range of 100 nm to 10 μm in U87 cells. Significantly increased OCR was observed with 1 μm MB, and a 2-fold increase occurred with 10 μm MB treatment (Fig. 1, C and E). In concurrence with the changes observed to cellular OCR, 1 and 10 μm MB significantly decreased ECAR, with 10 μm MB reducing ECAR up to 90% compared with control (Fig. 1, D and F).
To determine the long term effect of MB on cellular bioenergetics of glioma cells, we treated U87 cells with 10 μm MB for 1 or 2 days and then measured the bioenergetic parameters of OCR, ECAR, and ATP production. Chronic treatment of 10 μm MB increased OCR after 1 day. OCR returned to control levels after 2 days (Fig. 2, A and C). U87 cells treated with MB were less responsive to mitochondria modulating drugs (oligomycin, FCCP, and rotenone) than vehicle-treated U87 cells. Similar to acute MB treatment, ECAR levels were depressed compared with control for both day 1 and day 2 (Fig. 2, B and D). ATP levels were increased on days 1 and 2 compared with control cells (Fig. 2E). Consistent with the ECAR result, a decrease of lactate production upon MB treatment was observed at day 3 (Fig. 2F).
FIGURE 2.

Chronic MB treatment alters cellular bioenergetics. A, shown are OCRs of U87 cells treated for 1 and 2 days with 10 μm MB. MB was withdrawn 1 h before analysis. B, shown are ECARs of U87 cells treated for 1 and 2 days with 10 μm MB. MB was withdrawn 1 h before analysis. C, 10 μm MB decreased OCR in U87 cells after 1 and 2 days of treatment. D, 10 μm MB decreased ECARs in U87 cells after 1 and 2 days of treatment. * indicates p < 0.05 by one-way ANOVA and the Tukey's post-hoc test. E, MB increased cell ATP after 2 days of treatment. F, MB reduced lactate production. * indicates p < 0.05 by unpaired t test.
MB Inhibits Tumor Growth in Vitro
To understand how MB alterations to cellular bioenergetics affect glioma proliferation, we measured cell growth and anchorage-dependent and -independent colony formation. MB effects on tumor growth were initially characterized in vitro using the glioblastoma cell lines U87 and A172, originated from a human female patient and a male patient, respectively. Concentrations of 1 and 10 μm MB significantly reduced U87 cell growth compared with vehicle control (Fig. 3A). Furthermore, the inhibitory action of MB on U87 growth was observed when media were replaced every other day (Fig. 3C). On the other hand, no inhibitory action of MB on primary human astrocyte growth curve was observed (Fig. 3B). We determined the effect MB on glucose consumption. Media glucose was measured in U87 cells treated with vehicle or MB at concentrations of 100 nm, 1 μm, and 10 μm. MB did not increase glucose consumption rate as glucose concentrations in the media remained similar at day 1 and day 2 in vehicle- and MB-treated U87 cells. At day 3, glucose concentrations in MB-treated U87 cells were significantly higher than that of vehicle treated cells (Fig. 3D). Similarly, A172 cell growth was reduced by 1 and 10 μm MB (data not shown). To confirm the effects observed on cell growth, we employed an anchorage-dependent liquid colony culture (i.e. liquid colony formation) for 4 weeks, at the end of which the number and size of colonies was quantified. Consistently, MB at concentrations of 1 and 10 μm reduced both the average size and the number of colonies (Fig. 3, E–G). These results were further verified in an anchorage-independent (i.e. soft agar) colony growth assay, where 10 μm MB reduced the size and number of colonies (Fig. 3, H and I).
FIGURE 3.

MB impairs GBM proliferation. A, shown is the growth curve of U87 cells treated with 100 nm, 1 μm, or 10 μm MB for 5 days. MB significantly decreased the number of cells compared with control at days 3, 4, and 5 at a concentration of 1 μm and days 2, 3, 4, and 5 at a concentration of 10 μm. * indicates p < 0.05 by 2-way ANOVA and Bonferroni post-hoc test. B, shown is a growth curve of primary human astrocytes treated with 100 nm, 1 μm, or 10 μm MB for 5 days. No significant effect of MB on primary astrocyte growth curve was observed. C, shown is the growth curve of U87 cells treated with 1 and 10 μm MB for 5 days with media changes on days 2 and 4. D, shown is media glucose quantification of U87 cells treated with 100 nm, 1 μm, or 10 μm MB at the indicated durations. DMEM contained 4.5 g/liter glucose. E and F, shown is a liquid colony formation assay of U87 cells treated with 100 nm, 1 μm, and 10 μm MB. 1 μm decreased the size (E) and number (F) of colonies. G, shown are representative images of the liquid colonies. H and I, anchorage independent soft agar colony formation assay of U87 cells treated with 100 nm, 1 μm, and 10 μm MB is shown. MB significantly decreased the size (H) and number (I) of colonies. * indicates p < 0.05 by 1-way ANOVA and Tukey's post-hoc test.
MB Induces S-phase Cell Cycle Arrest
We investigated the MB effect on cell cycle as a possible cause of the decreased growth rate we observed in glioma cells. U87 cells were subjected to overnight serum deprivation to synchronize cell cycle and then treated with MB or vehicle for 3 days. No significant effect of MB on cell cycle was observed on day 1 (Fig. 4A). However, on day 2, a trend of increased cell number in S phase occurred at a dose of 10 μm MB (Fig. 4B). By day 3, 10 μm MB significantly increased the number of cells in S phase and decreased the number of cells in G1 phase with no discernable change in M phase (Fig. 4, C and D). In addition, an increase in cell death occurred in the 10 μm MB-treated group. To determine the effect of MB on glioma cell apoptosis, U87 cells were treated with MB for 3 days, then stained with annexin V and PI and analyzed by flow cytometry. We observed that MB, at 10 μm, increased necrosis and late stage apoptosis in U87 cells evidenced by the augmented number of PI-positive and PI annexin V double-positive cells, respectively (Fig. 4E).
FIGURE 4.
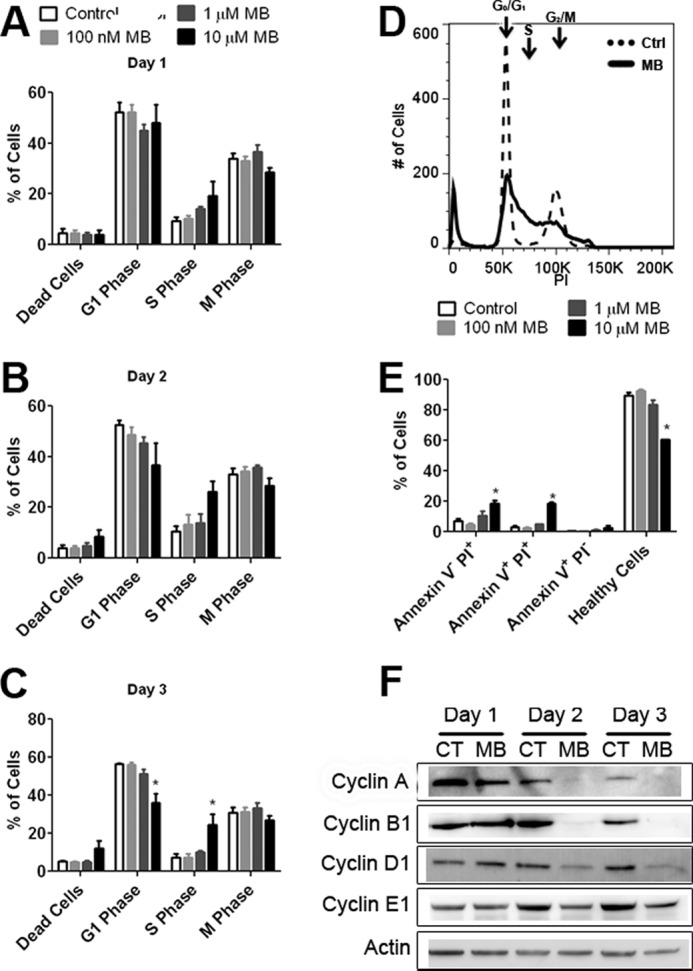
MB causes S phase arrest. Cell cycle analysis of U87 cells treated with MB for 1 day (A), 2 days (B), and 3 days (C). MB significantly decreased the number of cells in G1 phase and increased the number of cells in S phase on day 3. D, shown is a representative cell cycle image of media (dashed) and 10 μm MB-treated U87 cells (solid) after 3 days of MB exposure. E, shown are MB-treated U87 cells stained with annexin V and PI after 3 days of exposure. MB, at 10 μm, increased the number of cells staining for PI-positive and PI- and annexin V-positive while simultaneously decreasing the number of healthy cells. F, shown are representative Western blots of cyclins A2, B1, D1, and E1 of U87 cells treated for 1, 2, or 3 days with 10 μm MB. MB decreased cyclin A2, B1, and D1 expression. CT, control. * indicated p < 0.05 by 1-way ANOVA and Tukey's post-hoc test.
We determined the effect of MB on cyclin expression in U87 cells. Western blot analysis demonstrated that 10 μm MB decreased expression of cyclin A2 and B1 compared with control after 2 and 3 days of treatment (Fig. 4F). In addition, 10 μm MB reduced cyclin D1 expression while having little discernable effect on cyclin E1.
MB Activates AMPK and Its Downstream Targets
We investigated the phosphorylation of AMPKα at its activation site, Thr-172. Increased phosphorylation of AMPKα was observed after 2 and 3 days of 10 μm MB treatment (Fig. 5, A–C). Next we confirmed the effects of increased AMPK activation on the downstream targets ACC and mTOR. Increased phosphorylation of Ser-79 of ACC was observed in U87 cells treated with 10 μm MB for 2 and 3 days (Fig. 5, A, B, and D). On the other hand, no changes to mTOR Thr-2448 phosphorylation (inhibition) were observed (Fig. 5, A, B, and E). A recent study demonstrated that AMPK activation is associated with NADPH homeostasis (22). MB decreased NADPH as a percentage of total NADP+ in U87 cells at 1 and 10 μm (Fig. 5F).
FIGURE 5.
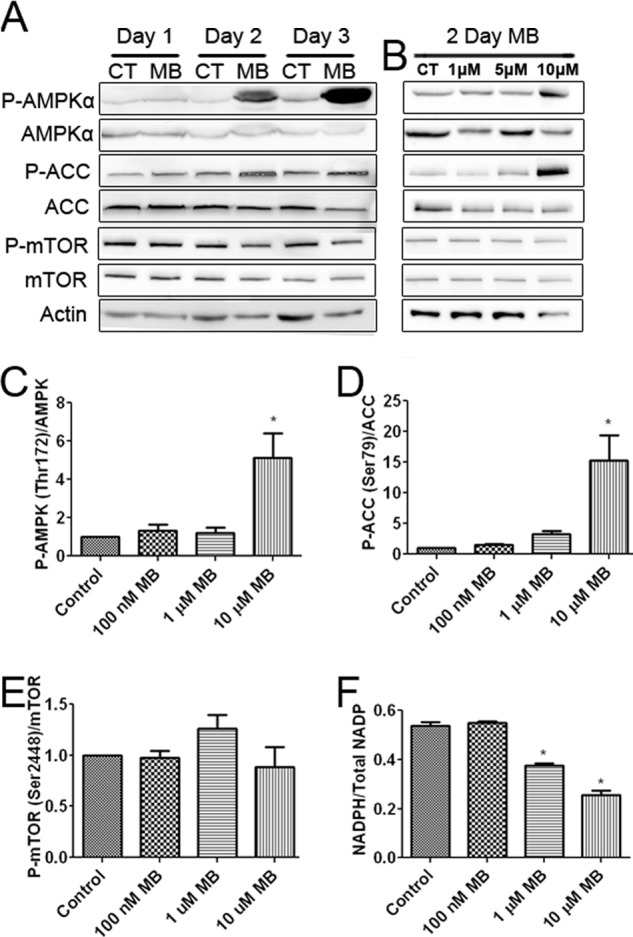
MB activates AMPKα and inhibits ACC. A, Western blots are shown of ACC, AMPKα, and mTOR after 1, 2, and 3 days of 10 μm MB treatment compared with control. MB increased the phosphorylation of AMPKα and ACC while mildly decreasing that of mTOR. CT, control. B, Western blots of AMPKα, ACC, and mTOR after 2 days of MB treatment at the indicated concentrations are shown. MB, at 10 μm, increased AMPKα and ACC phosphorylation and mildly decreased mTOR phosphorylation. C, densitometry of P-AMPK/AMPK ratio after 2 days of MB treatment is shown. 10 μm MB significantly increased the ratio of P-AMPKα/AMPK. D, densitometry of p-ACC/ACC ratio after 2 days of MB treatment is shown. 10 μm MB significantly increased the ratio of p-ACC/ACC. E, densitometry of P-mTOR/mTOR ratio after 2 days of MB treatment is shown. MB had no effect on the ratio of P-mTOR/mTOR. F, shown is the cellular NADPH to total NADP ratio. Concentrations of 1 and 10 μm MB significantly decreased NADPH/Total NADP compared with control. * indicated p < 0.05 by 1-way ANOVA and Tukey's post-hoc test.
Effect of MB Derivatives on Glioma Cell Proliferation
We selected three MB derivatives to determine whether the inhibitory action of MB on glioma cell proliferation is associated with the observed reversal of the Warburg effect. Toluidine blue O (TB) has an exposed heterocyclic nitrogen and side chains on carbons 3, 7, and 9. 2-Chlorophenothiazine (2-C) contains only the heterocyclic nucleus. Promethazine (Pro) is an antihistamine composed of a side chain blocking its heterocyclic nitrogen.
We determined the effects of MB derivatives on OCR and ECAR in U87 cells. TB dramatically increased OCR and decreased ECAR, whereas no effect was found by 2-C and Pro treatment (Fig. 6, A and B). We examined the effect of MB derivatives on the AMPK pathway. Similar to MB, TB increased phosphorylation of AMPKα at Thr-172 and ACC at Ser-79, whereas no effect was observed upon treatment of 2-C or Pro (Fig. 6C). Downstream of AMPKα, both MB and TB increased ACC phosphorylation at serine 79, inhibiting ACC. Surprisingly, Pro also increased ACC inhibition, but not AMPKα activation, which leads us to hypothesize that Pro acts on ACC through an alternative pathway. Consistently, no significant change of mTOR phosphorylation at Ser-2448 was found by the treatment of TB (Fig. 6C). Both TB and MB reduced cyclin A2, B1, and D1 expression while having no discernable effect on cyclin E1 (Fig. 6D). We further evaluated the effects of MB derivatives on U87 cell proliferation. Whereas Pro and 2-C had no effect on U87 cell proliferation at concentrations of 100 nm, 1 μm, and 10 μm in a growth curve assay (Fig. 7 A and B), TB significantly inhibited U87 cell growth at concentrations of 1 and 10 μm (Fig. 7C). We determined the effects of MB derivatives on cell growth in the liquid colony formation assay. Consistent with the growth curve analysis, neither 2-C nor Pro affected the number or the size of the colonies in the liquid colony formation assay (Fig. 7, D, E, G, and H). In contrast, TB dramatically reduced both the number and size of U87 cell colonies at concentrations of 1 and 10 μm (Fig. 7, F and I).
FIGURE 6.
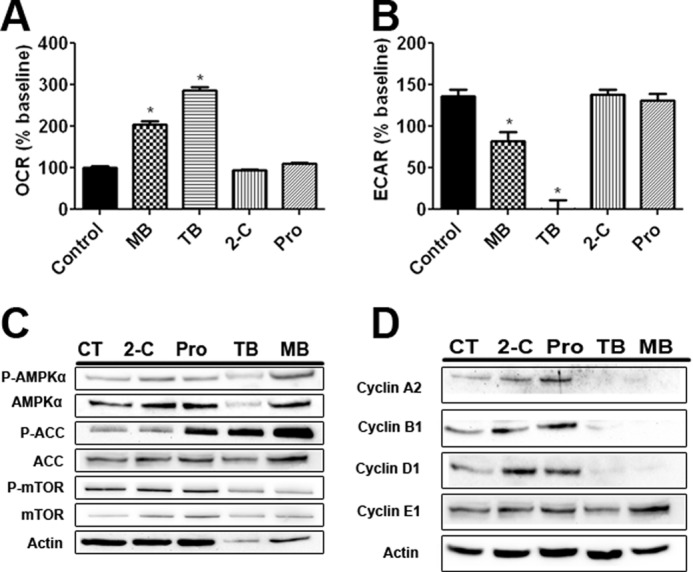
The effects of MB derivatives on AMPKα and its downstream pathways. A, shown is U87 OCR after treatment with Pro, 2-C, TB, and MB. TB and MB, both, significantly increased OCR. B, U87 ECAR is shown after treatment with Pro, 2-C, TB, and MB. TB and MB, both, significantly decreased ECAR. C, shown are the effects of Pro, 2-C, TB, and MB on phosphorylation of AMPKα, ACC, and mTOR in U87 cells. TB and MB increased AMPKα and ACC phosphorylation and had varying results on mTOR phosphorylation. D, effects of Pro, 2-C, TB, and MB on cyclin expression in U87 cells are shown. TB and MB decreased cyclin A2, B1, and D1 expression but had no effect on cyclin E1. * indicated p < 0.05 by 1-way ANOVA and Tukey's post-hoc test.
FIGURE 7.

The effects of MB derivatives on glioma proliferation and colony formation. A, shown is the U87 growth curve with cells treated with 100 nm, 1 μm, and 10 μm Pro. B, shown is the U87 growth curve with cells treated with 100 nm, 1 μm, and 10 μm 2-C. C, shown is U87 cell growth with cells treated with 100 nm, 1 μm, and 10 μm TB. TB inhibited cell growth at concentrations of 1 and 10 μm. * indicates p < 0.05 by 2-way ANOVA and Bonferroni post-hoc test. At concentrations of 100 nm, 1 μm, and 10 μm, Pro had no effect on either number (D) or size of the colonies in liquid colony formation assay (G). Similarly, no effect was observed upon 2-C treatment on either number (E) or size of the colonies (H). TB at 1 and 10 μm significantly decreased both number (F) and size of the colonies (I). * indicated p < 0.05 by 1-way ANOVA and Tukey's post-hoc test.
MB Inhibits Both TMZ-sensitive and -insensitive Glioma Cell Proliferation
We determined the effect of MB and TMZ in U87 and T98G cells, a TMZ-sensitive and -insensitive cell line, respectively. Growth curve analysis of U87 cells subjected to MB alone, 200 μm TMZ, or a combination of the two exhibited a predominant effect of MB as no significant difference between MB alone and MB combined with 200 μm TMZ was found (Fig. 8, A and B). A liquid colony formation assay using U87 cells revealed that 200 μm TMZ overwhelmed the effect of 100 nm MB on colony number and size when combination therapy was applied. In addition, a potential additive action of 1 μm MB and 200 μm TMZ was observed (Fig. 8, C and D). Cell cycle analysis at 3 days after 200 μm TMZ treatment demonstrated a significant increase in the number of cells in M phase. Distinctly, we observed a significant increase of cells in S phase upon combination treatment of 10 μm MB and 200 μm TMZ, with no major effect on the number of cells in M phase (Fig. 8, E and F).
FIGURE 8.

MB and TMZ do not have additive effects. shown is U87 cell growth of co-treatment with 1 μm (A) and 10 μm (B) MB in the presence and absence of 200 μm TMZ. * indicates p < 0.05 by 2-way ANOVA and Bonferroni post-hoc test. A liquid colony formation assay of U87 cells treated with the indicated concentrations of MB and TMZ is shown. Co-treatment with MB and TMZ had no additive effect to colony number (C) or size (D). E, day 3 cell cycle analysis of TMZ and MB is shown. TMZ increased the number of cells in M phase while decreasing the number of cells in G1 phase. When co-treated, the cell cycle was halted in S-phase similar to MB alone. F, shown is representative day 3 cell cycle analysis for control (black), 10 μm MB (red), 200 μm TMZ (green), and 10 μm MB + 200 μm TMZ (blue). * indicated p < 0.05 by 1-way ANOVA and Tukey's post-hoc test.
We determined the effect of MB on the proliferation of T98G cells, a TMZ-insensitive cell line derived from human GBM. MB significantly inhibited the growth of T98G cells at 1 μm on days 4 and 5 in the growth curve assay (Fig. 9A). MB, at a concentration of 10 μm, inhibited T98G cell growth on days 3, 4, and 5 compared with control. Similar to U87 cells, cell cycle analysis revealed an increase of T98G cells in S phase and a corresponding decrease in G1 phase on day 2 (Fig. 9B). T98G cells, when treated with MB at concentrations of 100 nm, 1 μm, and 10 μm, exhibited a dose-dependent increase of OCR and decrease of ECAR compared with control (Fig. 9, C and D). Finally, Western blot analysis confirmed the activation of AMPK pathway by MB treatment in T98G cells evidenced by the increases of phosphorylation of AMPKα and inhibition of ACC at concentrations of 1 and 10 μm (Fig. 9E). No significant change was observed in phosphorylation of mTOR Thr-2448 in T98G cells subjected to MB (Fig. 9E).
FIGURE 9.

MB impairs TMZ-insensitive glioma cell proliferation. A, the growth curve of T98G cells treated with 100 nm, 1 μm, and 10 μm MB is shown. * indicates p < 0.05 by 2-way ANOVA and Bonferroni post-hoc test. B, representative cell cycle analysis of T98G cells treated with media (black), 100 nm MB (blue), 1 μm MB (orange), or 10 μm MB (green) for 2 days is shown. Both 1 and 10 μm MB decreased G1 phase while increasing S phase. C, OCR of T98G cells treated with 100 nm, 1 μm, or 10 μm MB is shown. 10 μm MB significantly increased OCR compared with control. * indicated p < 0.05 by 1-way ANOVA and Tukey's post-hoc test. D, ECAR of T98G cells treated with 100 nm, 1 μm, or 10 μm MB is shown. 10 μm MB significantly decreased ECAR compared with control. * indicated p < 0.05 by 1-way ANOVA and Tukey's post-hoc test. E, Western blot analysis of AMPKα, ACC, and mTOR is shown. Increased phosphorylation of AMPKα and ACC was observed with no discernable change in mTOR phosphorylation. CT, control.
A Single Daily Dose of MB Does Not Inhibit Tumor Progression in Human GBM Xenograft Model
We determined the effect of MB in GBM using human GBM xenograft model. No toxic death was induced by either of the MB dosages. However, no tumor regression was found in both GBM xenografts upon both low and high dose treatment of MB (Table 1). In the Western blot analysis using the tumor specimens derived from the xenograft model, no AMPK activation was observed upon the single dose daily treatment (Fig. 10).
TABLE 1.
Effect of MB on GBM in human xenograft model
| Group | T-C | p Value | Regressions | Toxic deaths |
|---|---|---|---|---|
| Days | ||||
| 10 mg/kg group | ||||
| D-08-0430 MG | 0.04 | <0.389 | 0 of 10 | 0 of 10 |
| D-09-0326 MG | −1.14 | <0.241 | 0 of 10 | 0 of 10 |
| 50 mg/kg group | ||||
| D-08-0430 MG | 0.15 | <0.232 | 0 of 10 | 0 of 10 |
| D-09-0326 MG | 0.619 | <0.241 | 0 of 10 | 0 of 10 |
FIGURE 10.

Western blots of p-AMPKα, AMPKα, p-ACC, and ACC depict that single dose treatment of MB in GBM xenograft model does not activate AMPK pathway. CT, control.
DISCUSSION
Given the bioenergetic and biosynthetic demands of the rapid proliferation, it may not be surprising that tumor cells often display fundamental changes in pathways of energy metabolism (9). More than 90 years ago, Warburg hypothesized that cancers may be caused by increased glycolysis and impaired respiration based on observations that tumor tissue actively metabolizes glucose and produces excessive lactic acid while exhibiting a comparably low respiratory rate (7). Extensive research has been conducted to explore cancer metabolic pathways, and cancer metabolism has been considered as a possible target for cancer therapy (23). Recent findings suggest that reinstating normal oxidative phosphorylation in cancer cells may not only inhibit cell growth and proliferation but also impair the metastatic capacity of malignant cells (24).
We compared the bioenergetics between U87 GBM cells and human primary astrocyte cultures, both derived from females. As predicted, U87 cells had a substantially higher ECAR than primary astrocytes, indicating that U87 cells produce large amounts of lactate regardless of the availability of oxygen. Interestingly, U87 cells also have a higher OCR, which given its higher proliferation rate compared with primary astrocytes, is not surprising. In addition, the U87 cells and primary astrocytes have a similar maximum mitochondrial oxidative phosphorylation capacity evidenced by their comparable OCR after FCCP treatment. Nonetheless, acute MB treatment dramatically increases OCR and decreases ECAR in U87 cells. Furthermore, chronic MB treatment decreases ECAR but maintains OCR in U87 cells. We predicted that the reduction of ECAR by MB was mainly due to the inhibition of lactate production. Consistently, our lactate analysis indicated that MB treatment decreases lactate production in U87 cells. Interestingly, the reversal of the Warburg effect was associated with a reduction of U87 cell proliferation, evidenced by the cell growth curve, liquid colony formation, and soft agar colony formation assays.
GBM cells, like other cancers, face two major metabolic challenges, bioenergetic and biosynthetic demands of rapid cell proliferation. It has been proposed that the fundamental metabolic switch may confer to cancer cells a selective advantage during growth and proliferation (9, 25, 26). Glucose not only provides the major fuel for ATP synthesis through glycolysis and mitochondrial oxidative phosphorylation, but it also provides the backbone for intermediates needed in biosynthetic pathways, including ribose sugars for nucleotides, glycerol and citrate for lipids, nonessential amino acids, and NADPH through the oxidative pentose phosphate pathway (25). Besides serving as the major bioenergetic hub, mitochondria also provide metabolites for macromolecule synthesis to meet the biosynthetic demand of a proliferating cancer cell (26). Our previous study demonstrated that MB could accept electrons from NADH at mitochondrial complex I and transfer them to cytochrome c providing an alternative mitochondrial electron transfer pathway that decreases ECAR (12). We predict that MB reverses the Warburg effect and switches mitochondria from a biosynthetic hub back to a predominantly bioenergetic hub in GBM cells, thus decreasing metabolic intermediates and inhibiting cancer proliferation. This notion is supported by our data that MB increases ATP production, decreases NADPH, and arrests cancer cells in S phase. Interestingly, the inhibitory action of MB on lactate production is less dramatic as compared with its action on ECAR. Thus, other mechanisms might also contribute to the inhibitory action of MB on GBM cells. Indeed, there is evidence that extracellular acidity per se boosts the cancer progression (27).
Cell cycle is regulated by cyclins, which bind to cyclin-dependent kinases to activate transcription of the necessary proteins for the ensuing phase of the cell cycle. Of particular interest is cyclin A2, which is the key cyclin for progressing though S phase and transitioning from G2 to M phase (28). In addition to cyclin A2, cyclin B1 controls the cell cycle transition from G2 to M phase (29). We observed that MB dramatically inhibits expression of cyclin A2, B1,and D1 while having less effect on cyclin E1, which continues progression of S phase (30).
AMPK has been recognized as the major regulator of cellular bioenergetics (31). AMPK is composed of two active subunits, AMPKα and AMKA β/γ, with AMPKα being a key regulator of protein synthesis, fatty acid oxidation, cell cycle progression, and glucose uptake (32, 33). AMPKα is activated by Ca2+/calmodulin kinase kinase, a high AMP to ATP ratio, and/or its upstream kinase, liver kinase B1 (LKB1) (34, 35). Because of its control over essential and distinct metabolic pathways, activation of AMPK is thought to be an ideal drug target for cancer therapy (36). Downstream of activated AMPK, a multitude of pathways alter cell bioenergetics including mTOR, ACC, and cyclins A2 and B1 (37, 38). Activation of the AMPK pathway by metformin and 5-aminoimidazole-4-carboxamide 1-β-d-ribofuranoside has been shown to be an effective treatment in in vitro cell models for multiple forms of cancer, including those of breast, prostate, and lung (39–41). Cyclins A2 and B1 are regulated by human antigen R, upstream of which is the energy control protein AMPK (42). The inhibitory action of MB on cyclins A2 and B1 indicated that MB might activate AMPK signaling. Indeed, we observed that MB, likely through its bioenergetic effects, is capable of activating AMPK. The action of MB on the AMPK pathway was further confirmed by the activation of AMPK downstream signaling. ACC is a key enzyme in fatty acid synthesis catalyzing the carboxylation of acetyl-CoA to form malonyl-CoA (43). Inactivation of ACC by AMPK is achieved through phosphorylation of Ser-79 and/or Ser-1200 of ACC (44). Consistently, our results indicate a robust inhibition (i.e. increased phosphorylation) of ACC by MB corresponding to increased AMPK phosphorylation.
mTOR regulates ribosomal protein S6 kinase β-1 (p70) and eukaryotic translation initiation factor 4E-binding protein 1(4eBP1), which control protein synthesis (45, 46). Inhibition of mTOR by AMPK is achieved by phosphorylation of mTOR Thr-2448 by raptor, an intermediate kinase directly activated by AMPK (47, 48). AMPK inhibition of protein synthesis via mTOR in cancer has been demonstrated in lung and breast cancer cells with a reported 50–60% decrease in mTOR Thr-2448 phosphorylation in breast cancer cells (49). Our results demonstrated no significant change of dephosphorylation of mTOR upon MB treatment, indicating that MB might selectively activate AMPK downstream signaling.
We speculated that the action of MB on AMPK signaling and cyclins is secondary to its direct action on metabolism. Our bioenergetics analysis demonstrated that MB enhances oxygen consumption rate and extracellular acidification rate in glioma cells immediately after treatment. On the other hand, the effect of MB on cell cycle, AMPK signaling, and cyclin was not evident until days 2 and 3 after treatment. AMPK has been shown to be activated in response to multiple stresses with or without an increase of intracellular AMP/ATP ratio (50). Further studies are needed to determine the mechanism underlying the action of MB on AMPK signaling. Nonetheless, the secondary action of MB on AMPK signaling and downstream cyclins might play a critical role in its inhibitory effect on GBM proliferation.
Our structure-activity relationship analysis using MB and its derivatives provided further evidence that the inhibitory effect of MB on GBM cell proliferation is likely due to its action of metabolic transformation. Similar to MB, TB dramatically increased OCR and decreased ECAR, activated AMPK signaling, reduced expression of cyclins A2, B1, and D1, and inhibited U87 cell proliferation. On the other hand, two MB derivatives which have no effect on cellular OCR or ECAR had no effect on either U87 cell proliferation or the AMPK signaling pathway.
TMZ is currently one of the primary chemotherapies for GBM. TMZ is a pro-drug that decomposes into 3-methyl-(triazen-1-yl)imidazole-4-carboxamide, which disrupts GBM cell division by heavily alkylating and methylating DNA (6). Resistance to TMZ develops when cells increase expression of the enzymes O-6-methylguanine-DNA methyltransferase or O-6-alkylguanine-DNA alkyltransferase (51). We tested the effect of MB on both TMZ-sensitive and TMZ-resistant GBM cell lines, U87 and T98G, respectively. As predicted, TMZ arrests U87 cell cycle at M phase. MB induced cell cycle arrest in S phase and inhibited cell proliferation of both U87 and T98G cells. Similarly, MB increased OCR, decreased ECAR, and activated the AMPK signaling pathway in T98G cells. These data suggested that MB might be effective in both TMZ-sensitive and -resistant GBMs. Our study indicated that MB and TMZ arrest GBM cells at different stages of the cell cycle; thus, an additive effect on GBM proliferation might be achievable with a combination therapy of MB and TMZ. In both growth curve and cell cycle assays, we observed a predominant MB effect on GBM cell proliferation and cell cycle arrest even with a concentration of 20–200-fold less than TMZ, which possibly submerged the minor effect of TMZ. A slight additive action was indeed observed in the combination therapy of MB and TMZ in the liquid colony formation assay; therefore, we predict that combination therapy of MB and TMZ might be able to decrease the necessary dose of each drug, reducing the side effects while still achieving the maximal inhibitory effect on GBM progression.
We tested the action of MB in a human xenograft model. Surprisingly, we did not observe any inhibitory action of MB. We speculated that the lack of action of MB in the xenograft model was due to the inability of MB to reach and maintain a high concentration upon treatment. Indeed, the inhibitory action of MB in vitro was in the low μm range, and its action on bioenergetics disappeared rapidly after MB removal from the media. Consistently, a single daily treatment of MB was unable to activate AMPK pathway as suggested in the Western blot analysis. Future studies are warranted to determine if other MB treatment paradigms could reach the desired concentration and, hence, inhibit GBM proliferation without severe side effects in vivo.
In summary, our current study demonstrated that MB exerts profound action on GBM bioenergetics. MB inhibits GBM cells proliferation and arrests the cell cycle in S phase. The effect of MB on GBM proliferation intertwined with the activation of AMPK and its downstream signaling of ACC and cyclin expression. Furthermore, our structure-activity relationship analysis indicated a direct link between the inhibitory action of MB on GBMs and its bioenergetic effects. By reversing the Warburg effect, MB switches the mitochondria from a biosynthetic hub to bioenergetic hub and inhibits GBM cell proliferation. Although the inhibitory action of MB on cancer proliferation needs further verification in vivo using different treatment paradigms, our in vitro data provide the proof of concept that reversal of Warburg effect might be a novel therapy for GBM.
This work was supported, in whole or in part, by National Institutes of Health Grants R01NS054687 and R01NS054651 (to S. Y.). The University of North Texas Health Science Center has filed a Patent Cooperation Treaty patent application titled “Compounds that enable alternative mitochondrial electron transfer.”
- GBM
- glioblastoma multiforme
- AMPK
- AMP-activated protein kinase
- TMZ
- temozolomide
- MB
- methylene blue
- FCCP
- carbonyl cyanide-4-(trifluoromethoxy) phenylhydrazone
- PI
- propidium iodide
- ACC
- acetyl-CoA carboxylase
- mTOR
- mammalian target of rapamycin
- OCR
- oxygen consumption rate
- ECAR
- extracellular acidification rate
- TB
- toluidine blue O
- 2-C
- 2-chlorophenothiazine
- Pro
- promethazine.
REFERENCES
- 1. Stupp R., Dietrich P. Y., Ostermann Kraljevic S., Pica A., Maillard I., Maeder P., Meuli R., Janzer R., Pizzolato G., Miralbell R., Porchet F., Regli L., de Tribolet N., Mirimanoff R. O., Leyvraz S. (2002) Promising survival for patients with newly diagnosed glioblastoma multiforme treated with concomitant radiation plus temozolomide followed by adjuvant temozolomide. J. Clin. Oncol. 20, 1375–1382 [DOI] [PubMed] [Google Scholar]
- 2. Oertel J., von Buttlar E., Schroeder H. W., Gaab M. R. (2005) Prognosis of gliomas in the 1970s and today. Neurosurg. Focus 18, e12. [DOI] [PubMed] [Google Scholar]
- 3. Lacroix M., Abi-Said D., Fourney D. R., Gokaslan Z. L., Shi W., DeMonte F., Lang F. F., McCutcheon I. E., Hassenbusch S. J., Holland E., Hess K., Michael C., Miller D., Sawaya R. (2001) A multivariate analysis of 416 patients with glioblastoma multiforme. Prognosis, extent of resection, and survival. J. Neurosurg. 95, 190–198 [DOI] [PubMed] [Google Scholar]
- 4. Chamberlain M. C., Glantz M. J., Chalmers L., Van Horn A., Sloan A. E. (2007) Early necrosis following concurrent Temodar and radiotherapy in patients with glioblastoma. J. Neurooncol 82, 81–83 [DOI] [PubMed] [Google Scholar]
- 5. Birol Sarica F., Tufan K., Cekinmez M., Sen O., Cem Onal H., Mertsoylu H., Topkan E., Pehlivan B., Erdogan B., Nur Altinors M. (2010) Effectiveness of temozolomide treatment used at the same time with radiotherapy and adjuvant temozolomide; concomitant therapy of glioblastoma multiforme. Multivariate analysis and other prognostic factors. J. Neurosurg. Sci. 54, 7–19 [PubMed] [Google Scholar]
- 6. Nieder C., Adam M., Grosu A. L. (2006) Combined modality treatment of glioblastoma multiforme. The role of temozolomide. Rev. Recent Clin. Trials 1, 43–51 [DOI] [PubMed] [Google Scholar]
- 7. Warburg O. (1956) On the origin of cancer cells. Science 123, 309–314 [DOI] [PubMed] [Google Scholar]
- 8. Koppenol W. H., Bounds P. L., Dang C. V. (2011) Otto Warburg's contributions to current concepts of cancer metabolism. Nat. Rev. Cancer 11, 325–337 [DOI] [PubMed] [Google Scholar]
- 9. Vander Heiden M. G., Cantley L. C., Thompson C. B. (2009) Understanding the Warburg effect. The metabolic requirements of cell proliferation. Science 324, 1029–1033 [DOI] [PMC free article] [PubMed] [Google Scholar]
- 10. Ohlow M. J., Moosmann B. (2011) Phenothiazine: the seven lives of pharmacology's first lead structure. Drug Discov, Today 16, 119–131 [DOI] [PubMed] [Google Scholar]
- 11. Rojas J. C., Bruchey A. K., Gonzalez-Lima F. (2012) Neurometabolic mechanisms for memory enhancement and neuroprotection of methylene blue. Prog. Neurobiol. 96, 32–45 [DOI] [PMC free article] [PubMed] [Google Scholar]
- 12. Wen Y., Li W., Poteet E. C., Xie L., Tan C., Yan L. J., Ju X., Liu R., Qian H., Marvin M. A., Goldberg M. S., She H., Mao Z., Simpkins J. W., Yang S. H. (2011) Alternative mitochondrial electron transfer as a novel strategy for neuroprotection. J. Biol. Chem. 286, 16504–16515 [DOI] [PMC free article] [PubMed] [Google Scholar]
- 13. Atamna H., Nguyen A., Schultz C., Boyle K., Newberry J., Kato H., Ames B. N. (2008) Methylene blue delays cellular senescence and enhances key mitochondrial biochemical pathways. FASEB J. 22, 703–712 [DOI] [PubMed] [Google Scholar]
- 14. Callaway N. L., Riha P. D., Wrubel K. M., McCollum D., Gonzalez-Lima F. (2002) Methylene blue restores spatial memory retention impaired by an inhibitor of cytochrome oxidase in rats. Neurosci. Lett. 332, 83–86 [DOI] [PubMed] [Google Scholar]
- 15. Sontag E. M., Lotz G. P., Agrawal N., Tran A., Aron R., Yang G., Necula M., Lau A., Finkbeiner S., Glabe C., Marsh J. L., Muchowski P. J., Thompson L. M. (2012) Methylene blue modulates huntingtin aggregation intermediates and is protective in Huntington's disease models. J. Neurosci. 32, 11109–11119 [DOI] [PMC free article] [PubMed] [Google Scholar]
- 16. Medina D. X., Caccamo A., Oddo S. (2011) Methylene blue reduces aβ levels and rescues early cognitive deficit by increasing proteasome activity. Brain Pathol. 21, 140–149 [DOI] [PMC free article] [PubMed] [Google Scholar]
- 17. Weinstein J., Scott A., Hunter F. E., Jr. (1964) The Action of gramicidin D on isolated liver mitochondria. J. Biol. Chem. 239, 3031–3037 [PubMed] [Google Scholar]
- 18. Fields J., Gardner-Mercer J., Borgmann K., Clark I., Ghorpade A. (2011) CCAAT/enhancer binding protein β expression is increased in the brain during HIV-1-infection and contributes to regulation of astrocyte tissue inhibitor of metalloproteinase-1. J. Neurochem. 118, 93–104 [DOI] [PMC free article] [PubMed] [Google Scholar]
- 19. Cao J., Schulte J., Knight A., Leslie N. R., Zagozdzon A., Bronson R., Manevich Y., Beeson C., Neumann C. A. (2009) Prdx1 inhibits tumorigenesis via regulating PTEN/AKT activity. EMBO J. 28, 1505–1517 [DOI] [PMC free article] [PubMed] [Google Scholar]
- 20. Friedman H. S., Colvin O. M., Skapek S. X., Ludeman S. M., Elion G. B., Schold S. C., Jr., Jacobsen P. F., Muhlbaier L. H., Bigner D. D. (1988) Experimental chemotherapy of human medulloblastoma cell lines and transplantable xenografts with bifunctional alkylating agents. Cancer Res. 48, 4189–4195 [PubMed] [Google Scholar]
- 21. Gehan E. A. (1965) A generalized Wilcoxon test for comparing arbitrarily singly-censored samples. Biometrika 52, 203–223 [PubMed] [Google Scholar]
- 22. Jeon S. M., Chandel N. S., Hay N. (2012) AMPK regulates NADPH homeostasis to promote tumour cell survival during energy stress. Nature 485, 661–665 [DOI] [PMC free article] [PubMed] [Google Scholar]
- 23. Diaz-Ruiz R., Rigoulet M., Devin A. (2011) The Warburg and Crabtree effects. On the origin of cancer cell energy metabolism and of yeast glucose repression. Biochim. Biophys. Acta 1807, 568–576 [DOI] [PubMed] [Google Scholar]
- 24. Schulz T. J., Thierbach R., Voigt A., Drewes G., Mietzner B., Steinberg P., Pfeiffer A. F., Ristow M. (2006) Induction of oxidative metabolism by mitochondrial frataxin inhibits cancer growth. Otto Warburg revisited. J. Biol. Chem. 281, 977–981 [DOI] [PubMed] [Google Scholar]
- 25. DeBerardinis R. J., Lum J. J., Hatzivassiliou G., Thompson C. B. (2008) The biology of cancer. Metabolic reprogramming fuels cell growth and proliferation. Cell metab. 7, 11–20 [DOI] [PubMed] [Google Scholar]
- 26. Jones R. G., Thompson C. B. (2009) Tumor suppressors and cell metabolism. A recipe for cancer growth. Genes Dev. 23, 537–548 [DOI] [PMC free article] [PubMed] [Google Scholar]
- 27. McCarty M. F., Whitaker J. (2010) Manipulating tumor acidification as a cancer treatment strategy. Altern. Med. Rev. 15, 264–272 [PubMed] [Google Scholar]
- 28. Pagano M., Pepperkok R., Verde F., Ansorge W., Draetta G. (1992) Cyclin A is required at two points in the human cell cycle. EMBO J. 11, 961–971 [DOI] [PMC free article] [PubMed] [Google Scholar]
- 29. Lindqvist A., Rodríguez-Bravo V., Medema R. H. (2009) The decision to enter mitosis. Feedback and redundancy in the mitotic entry network. J. Cell Biol. 185, 193–202 [DOI] [PMC free article] [PubMed] [Google Scholar]
- 30. Lauper N., Beck A. R., Cariou S., Richman L., Hofmann K., Reith W., Slingerland J. M., Amati B. (1998) Cyclin E2. A novel CDK2 partner in the late G1 and S phases of the mammalian cell cycle. Oncogene 17, 2637–2643 [DOI] [PubMed] [Google Scholar]
- 31. Carling D. (2004) The AMP-activated protein kinase cascade. A unifying system for energy control. Trends Biochem. Sci. 29, 18–24 [DOI] [PubMed] [Google Scholar]
- 32. Bolster D. R., Crozier S. J., Kimball S. R., Jefferson L. S. (2002) AMP-activated protein kinase suppresses protein synthesis in rat skeletal muscle through down-regulated mammalian target of rapamycin (mTOR) signaling. J. Biol. Chem. 277, 23977–23980 [DOI] [PubMed] [Google Scholar]
- 33. Imamura K., Ogura T., Kishimoto A., Kaminishi M., Esumi H. (2001) Cell cycle regulation via p53 phosphorylation by a 5'-AMP activated protein kinase activator, 5-aminoimidazole-4-carboxamide-1-β-d-ribofuranoside, in a human hepatocellular carcinoma cell line. Biochem. Biophys. Res. Commun. 287, 562–567 [DOI] [PubMed] [Google Scholar]
- 34. Hawley S. A., Boudeau J., Reid J. L., Mustard K. J., Udd L., Mäkelä T. P., Alessi D. R., Hardie D. G. (2003) Complexes between the LKB1 tumor suppressor, STRAD α/β, and MO25 α/β are upstream kinases in the AMP-activated protein kinase cascade. J. Biol. 2, 28. [DOI] [PMC free article] [PubMed] [Google Scholar]
- 35. Jensen T. E., Rose A. J., Jørgensen S. B., Brandt N., Schjerling P., Wojtaszewski J. F., Richter E. A. (2007) Possible CaMKK-dependent regulation of AMPK phosphorylation and glucose uptake at the onset of mild tetanic skeletal muscle contraction. Am. J. Physiol. Endocrinol. Metab. 292, E1308–E1317 [DOI] [PubMed] [Google Scholar]
- 36. Luo Z., Zang M., Guo W. (2010) AMPK as a metabolic tumor suppressor. Control of metabolism and cell growth. Future Oncol 6, 457–470 [DOI] [PMC free article] [PubMed] [Google Scholar]
- 37. Rattan R., Giri S., Hartmann L. C., Shridhar V. (2011) Metformin attenuates ovarian cancer cell growth in an AMP kinase-dispensable manner. J. Cell. Mol. Med. 15, 166–178 [DOI] [PMC free article] [PubMed] [Google Scholar]
- 38. Xiang X., Saha A. K., Wen R., Ruderman N. B., Luo Z. (2004) AMP-activated protein kinase activators can inhibit the growth of prostate cancer cells by multiple mechanisms. Biochem. Biophys. Res. Commun. 321, 161–167 [DOI] [PubMed] [Google Scholar]
- 39. Youn S. H., Lee J. S., Lee M. S., Cha E. Y., Thuong P. T., Kim J. R., Chang E. S. (2012) Anticancer properties of pomolic acid-induced AMP-activated protein kinase activation in MCF7 human breast cancer cells. Biol. Pharm. Bull 35, 105–110 [DOI] [PubMed] [Google Scholar]
- 40. Zhou J., Huang W., Tao R., Ibaragi S., Lan F., Ido Y., Wu X., Alekseyev Y. O., Lenburg M. E., Hu G. F., Luo Z. (2009) Inactivation of AMPK alters gene expression and promotes growth of prostate cancer cells. Oncogene 28, 1993–2002 [DOI] [PMC free article] [PubMed] [Google Scholar]
- 41. Wu N., Gu C., Gu H., Hu H., Han Y., Li Q. (2011) Metformin induces apoptosis of lung cancer cells through activating JNK/p38 MAPK pathway and GADD153. Neoplasma 58, 482–490 [DOI] [PubMed] [Google Scholar]
- 42. Wang W., Fan J., Yang X., Fürer-Galban S., Lopez de Silanes I., von Kobbe C., Guo J., Georas S. N., Foufelle F., Hardie D. G., Carling D., Gorospe M. (2002) AMP-activated kinase regulates cytoplasmic HuR. Mol. Cell. Biol. 22, 3425–3436 [DOI] [PMC free article] [PubMed] [Google Scholar]
- 43. Wakil S. J., Stoops J. K., Joshi V. C. (1983) Fatty acid synthesis and its regulation. Annu. Rev. Biochem. 52, 537–579 [DOI] [PubMed] [Google Scholar]
- 44. Park S. H., Gammon S. R., Knippers J. D., Paulsen S. R., Rubink D. S., Winder W. W. (2002) Phosphorylation-activity relationships of AMPK and acetyl-CoA carboxylase in muscle. J. Appl. Physiol. 92, 2475–2482 [DOI] [PubMed] [Google Scholar]
- 45. Chung J., Kuo C. J., Crabtree G. R., Blenis J. (1992) Rapamycin-FKBP specifically blocks growth-dependent activation of and signaling by the 70-kDa S6 protein kinases. Cell 69, 1227–1236 [DOI] [PubMed] [Google Scholar]
- 46. Price D. J., Grove J. R., Calvo V., Avruch J., Bierer B. E. (1992) Rapamycin-induced inhibition of the 70-kilodalton S6 protein kinase. Science 257, 973–977 [DOI] [PubMed] [Google Scholar]
- 47. Hara K., Maruki Y., Long X., Yoshino K., Oshiro N., Hidayat S., Tokunaga C., Avruch J., Yonezawa K. (2002) Raptor, a binding partner of target of rapamycin (TOR), mediates TOR action. Cell 110, 177–189 [DOI] [PubMed] [Google Scholar]
- 48. Sarbassov D. D., Guertin D. A., Ali S. M., Sabatini D. M. (2005) Phosphorylation and regulation of Akt/PKB by the rictor-mTOR complex. Science 307, 1098–1101 [DOI] [PubMed] [Google Scholar]
- 49. Zakikhani M., Blouin M. J., Piura E., Pollak M. N. (2010) Metformin and rapamycin have distinct effects on the AKT pathway and proliferation in breast cancer cells. Breast Cancer Res. Treat 123, 271–279 [DOI] [PubMed] [Google Scholar]
- 50. Emerling B. M., Weinberg F., Snyder C., Burgess Z., Mutlu G. M., Viollet B., Budinger G. R., Chandel N. S. (2009) Hypoxic activation of AMPK is dependent on mitochondrial ROS but independent of an increase in AMP/ATP ratio. Free Radic. Biol. Med. 46, 1386–1391 [DOI] [PMC free article] [PubMed] [Google Scholar]
- 51. Pepponi R., Marra G., Fuggetta M. P., Falcinelli S., Pagani E., Bonmassar E., Jiricny J., D'Atri S. (2003) The effect of O6-alkylguanine-DNA alkyltransferase and mismatch repair activities on the sensitivity of human melanoma cells to temozolomide, 1,3-bis(2-chloroethyl)1-nitrosourea, and cisplatin. J. Pharmacol. Exp. Ther. 304, 661–668 [DOI] [PubMed] [Google Scholar]