

Abstract
The role of osteoblasts (OB) in maintaining hematopoietic stem cells (HSC) in their niche is well elucidated, but the exact definition, both phenotypically and hierarchically of OB responsible for these functions is not clearly known. We previously demonstrated that OB maturational status influences HSC function whereby immature OB with high Runx2 expression promote hematopoietic expansion. Here, we show that Activated Leukocyte Cell Adhesion Molecule (ALCAM) or CD166 expression on OB is directly correlated with Runx2 expression and high hematopoiesis enhancing activity (HEA). Fractionation of OB with lineage markers: Sca1, osteopontin (OPN), CD166, CD44, and CD90 revealed that Lin-Sca1-OPN+CD166+ cells (CD166+) and their subpopulations fractionated with CD44 and CD90 expressed high levels of Runx2 and low levels of osteocalcin (OC) demonstrating the relatively immature status of these cells. Conversely, the majority of the Lin-Sca1-OPN+CD166− cells (CD166−) expressed high OC levels suggesting that CD166− OB are more mature. In vitro hematopoietic potential of LSK cells co-cultured for 7 days with fresh OB or OB pre-cultured for 1, 2, or 3 weeks declined precipitously with increasing culture duration concomitant with loss of CD166 expression. Importantly, LSK cells co-cultured with CD166+CD44+CD90+ OB maintained their in vivo repopulating potential through primary and secondary transplantation, suggesting that robust HEA activity is best mediated by immature CD166+ OB with high Runx2 and low OC expression. These studies begin to define the hierarchical organization of osteoblastic cells and provide a more refined definition of OB that can mediate HEA.
Introduction
In postnatal life, HSC reside in bone marrow (BM) in a quiescent state conducive to the replenishment of these cells by self renewal divisions throughout life. Within the BM, HSC reside in association with various cellular components such as OB, stromal cells, endothelial cells, adipocytes, and other mesenchymal progenitor cells. These associations possibly regulate self-renewal and differentiation of HSC by various signaling networks [1–3]. Unique sets of cellular components in the BM comprise distinct niches - the endosteal niche and the vascular niche [4–6]. It is generally accepted that quiescent HSC reside in the endosteal niche in close proximity to OB, while more active HSC that are primed to respond quickly to hematopoietic activation or stress reside in the vascular niche [7–9]. However, Mayack et al. demonstrated that during mobilization, OB can also deliver proliferative signals to HSC in the endosteal niche [10].
While it is clear that OB lineage cells provide both membrane-bound and secreted molecules that are critical to the survival, proliferation, and differentiation of HSC [11–13], it is still unknown which specific OB phenotype is better able to promote HSC maintenance and function. Previously, we demonstrated that freshly isolated 2-day calvarial derived OB promoted a significantly higher level of HSC expansion in terms of total cell number produced in culture, CFU production, maintenance of Lin- Sca1+ cells in culture, and marrow repopulating potential than did OB cultured for 1, 2, or 3 weeks [14,15]. These results suggested that most likely more immature OB better promote hematopoietic expansion and function than cultured, presumably more mature OB [14,15]. But, unlike HSC, the cell surface phenotype of OB that defines their developmental stage and identifies cells that are responsible for the maintenance of HSC function is still not known.
Limited consensus is that OB lineage cells are CD45-CD31-Ter119-Sca1− [10,16,17], OPN+ [10] and CD166+ [13,16]. In this report, using prospective multicolor flow cytometric cell sorting and functional assays, we demonstrate a phenotypic developmental hierarchy of OB and their impact on HSC properties. We also report that maintenance of HSC function is associated with the level of CD166 expression on OB. Interestingly, only OB with the phenotype CD45-CD31-Ter119-Sca1-OPN+CD166+CD44+CD90+ support HSC capable of mediating an increasing repopulating potential in lethally irradiated mice and through secondary transplantation. Therefore, these studies begin to highlight the importance of CD166 expression on OB in the maintenance of HSC function.
Methods
Animals
Adult B6.SJL-Pt_cqPep3b/BoyJ (BoyJ) mice (6- to 8-week-old), C57BL/6 mice (2-day pups and 6- to 8-week-old), and C57BL/6 X BoyJ F1 mice (6- to 8-week-old) were used. Mice were bred and housed in the animal facility at Indiana University. For transplantation studies, recipient mice received 1100 cGy ionizing radiation from a cesium source (700 and 400 cGy, split dose, at least 3 hours apart). All procedures were approved by the Institutional Animal Care and Use Committee of the Indiana University School of Medicine and followed National Institutes of Health guidelines.
Preparation of osteoblast
Two-day calvarial osteoblast
Neonatal murine calvarial cells were prepared following a modification of published basic methods [18–20]. Briefly, calvariae from C57BL/6 mice <48 h old were dissected out, pre-treated with EDTA in PBS for 30 min, then subjected to sequential collagenase digestions (200 U/ml). Fractions 3–5 (digestions 20–35, 35–50, and 50–65 min) were collected and used as OB. These cells are >95% OB or OB precursors as previously demonstrated by a variety of criteria [19,21,22]. Freshly prepared OB (0 week culture duration) or OB that were cultured for 1 to 6 weeks were used for all studies. OB cultured for 1, 2, 3, 4, or 6 weeks were maintained in αMEM supplemented with 10% fetal bovine serum and were further supplemented with ascorbic acid (50 mg/ml added on day 0 and at all feedings) and beta glycerophosphate (5mM added starting on day 7 and all subsequent feedings). Cells were fed 2 times per week.
Six- to 8-week long bone osteoblast
To generate OB from long bones, the epiphyses were removed and saved. After flushing the BM, bone pieces (diaphyses and epiphyses) were combined, cut into less than 1-mm segments, and washed twice with PBS. Bone segments were subjected to 2 consecutive collagenase digestions (30 minutes and 1 hour). Cells were collected after each digestion, pooled, and used as described.
Cell staining and flow cytometry
Cells were washed once with stain wash (PBS, 1% bovine calf serum, and 1% penicillin-streptomycin) followed by antibody staining for 15 minutes on ice. Cells were washed with cold stain wash after each step. All positive staining for each marker was established based on comparisons to isotype-matched fluorochrome-conjugated controls. Cells displaying fluorescence beyond the brightest 2% of events detected with the isotype control were considered positive (Figures 1 and 2). For multicolor analysis, appropriate fluorescence minus one (FMO) were prepared for each marker and were used to identify positive events (Figures 3 and 5).
Figure 1.

Expression of cell surface markers of importance for mesenchymal and hematopoietc cell identification was examined in freshly isolated 2-day calvarial OB. Significant expression of CD51, OPN, CD166, CD44, and CD90, but not CD184, CD14, CD117, or CD11b was observed in OB. Representative flow cytometric data from more than five independent identical analyses. Positive events (light grey histogram) were determined by direct comparison to isotype-matched fluorochrome-conjugated controls (dark grey histogram) for each marker.
Figure 2.

Freshly isolated Lin-Sca1- 2-day calvarial OB were examined on day 0 and after 1, 2, 3, 4, and 6 weeks of culture for the expression of CD51, OPN, CD166, CD44, and CD90. All cultured cells were included in the weekly analysis without any further gating. Expression of CD51 and OPN was high throughout the 6 week culture duration. For CD166 and CD44, expression was increased from baseline and then dropped substantially with increasing culture duration. Whereas for CD90 expression levels were lowest initially and markedly increased with just 1 week of culture and maintained a high expression for the rest of the culture duration. Representative flow cytometric data from more than five independent identical analyses. Positive events (light grey histogram) were determined by direct comparison to isotype-matched fluorochrome-conjugated controls (dark grey histogram) for each marker.
Figure 3.
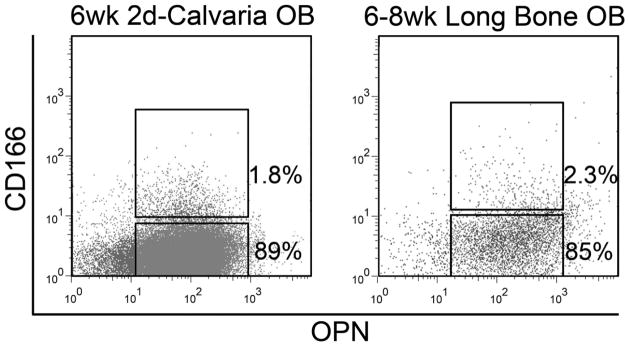
Flow cytometric data showing the similar expression of CD166 and OPN in 2-day calvarial OB cultured for 6 weeks and freshly isolated OB from 6–8 week-old long bones. Cells in these dotplots were already gated as Lin-Sca1− cells using lineage markers described in Materials and Methods. Representative flow cytometric data from more than five independent identical analyses. Fluorescence minus one (FMO) controls were used for each marker to identify positive events.
Figure 5.

(A) Phenotypic characterization of OB defined by a lineage cocktail (CD45, CD31, and Ter119), Sca1, OPN, CD166, CD44, and CD90. Representative flow cytometric data from more than five independent identical analyses. Fluorescence minus one (FMO) controls were used for each marker to identify positive (and negative) events in each channel and to ensure proper construction of the sort windows used for the isolation of the OB fractions shown in these dotplots. (B) qRT-PCR analysis of the 8 groups of OB in (A) showing that groups 1 and 3 have the highest Runx2 activity. “U” are unsorted 2-day calvarial OB. (C) ALP activity of the 8 groups of OB in (A) show that groups 2 and 3 (CD166+CD44+ cells) have the lowest ALP activity. *p<0.05 vs. group 3. (D) Ca deposition as a measure of mineralization of the 8 groups of OB in (A) show that groups 2, 3, and 7 are the least mineralized. *p<0.05 vs. group 3. (E) Co-cultures of isolated fractions of OB and LSK cells were supplemented with recombinant murine stem cell factor and interleukin-3 (10 ng/mL), insulin-like growth factor 1 and thrombopoietin (20 ng/mL), interleukin-6 and Fms-like tyrosine kinase 3 (25 ng/mL), and OPN (50 ng/mL). CFU content was assessed after 7 days of co-culture. CFU fold increase relative to the CFU content of freshly isolated 1000 LSK cells was calculated for the LSK progeny from co-culture with each of the 8 groups of OB identified in (A), unsorted OB “U”, or without OB on tissue culture plastic “P”. The highest CFU fold increase was observed in cells co-cultured with group 3 OB (CD166+CD44+CD90+ cells). *p<0.05 compared to the “U” group of cells. (F) Total number of Lin− Sca1+ cells produced after 7 days of co-culture of 1000 LSK cells with each of the 8 groups of OB identified in (A), unsorted OB “U”, or without OB “P”. *p<0.05 compared to the “U” group of cells. (G) Progeny of 1,000 LSK cells from C57BL/6 (CD45.2) mice co-cultured for 5 days with unsorted OB “U” or without OB “P” or with groups of OB identified in (A) were transplanted in a competitive repopulation assay with 100,000 BoyJ (CD45.2) cells via tail vein injection in lethally irradiated CD45.2 X CD45.1 F1 recipients. Repopulating potential (compared to freshly-sorted LSK cells “F”) at 6 months post-transplantation is shown. (H) At 6 months post- transplantation, BM cells representing ½ a femur from primary recipients were transplanted into secondary recipients without competitor cells. Chimerism was determined 4 months post-transplantation in secondary recipients (n=4–5 mice per group in both primary and secondary transplantation studies). For studies in B-D n=3–4 per group, for studies in E&F n=2 per group, *p<0.05 vs. group 3.
LSK cell sorting and phenotyping
Low-density BM cells from BoyJ (CD45.1) mice were stained with phycoerythrin (PE) - conjugated CD3, CD4, CD45R, Ter119, and Gr1; allophycocyanin-conjugated c-Kit (CD117); fluorescein isothiocyanate-conjugated Sca1 (BD Biosciences). Lineage- Sca-1+ CD117+ (LSK) cells were sorted on a BD FACSAria (BD Biosciences). Cells harvested from co-cultures were stained with the aforementioned antibody combinations along with Pacific blue - conjugated CD45.1 and PE-Cy7 - conjugated CD45.2. CD45.1+ cells were gated and analyzed for the presence of Lin- Sca1+ cells on a BD LSRII (BD Biosciences). Persistence of primitive cells in culture was assessed via the presence of Lin- Sca1+ cells only as cultured cells quickly lose the expression of c-kit [23–25].
Osteoblast phenotyping and sorting
OB either from calvariae or long bones were stained with allophycocyanin-conjugated CD45, CD31, and Ter119; PE-Cy7–conjugated Sca1; PE–conjugated CD166 (eBiosciences); and purified OPN (Rockland) followed by AlexaFluor 488–conjugated species and subclass specific secondary antibody (Invitrogen); PercpCy5.5 – conjugated CD44; and Biotin – conjugated CD90 followed by streptavidin APCcy7.
Co-culture of Osteoblast and LSK cells
Co-cultures of OB and LSK cells were initiated according to a slight modification of our previously published protocol [15]. Briefly, freshly prepared OB or cultured OB (as described above) from C57Bl/6 mice (CD45.2) were plated at 40,000 cells per well in a 12 well plate; freshly sorted 1000 LSK cells from BoyJ mice (CD45.1) were seeded after 24 hours. All cultures were supplemented with a cocktail of cytokines containing recombinant murine SCF & IL3 (10ng/mL), IGF1 & TPO (20ng/mL), IL6 & Flt3 (25ng/mL) and OPN (50ng/mL). Cultures were maintained for one week in medium consisting of 1:1 mix of IMDM and αMEM supplemented with 10% FBS, 1% Pen/Strep, and 1% L-Glutamine. Hematopoietic cells were harvested on day 7 by washing and counted. Since OB adhere to plastic, minimal contamination of hematopoietic cells with OB was observed. Still, control wells with OB only were treated similarly to correct for cell numbers and possible CFU contributed by OB. Fold increase in the number of cells derived from LSK cells was calculated relative to d0 count of 1,000.
Bone marrow repopulating assays
Freshly isolated C57Bl/6 (CD45.2) LSK cells (1,000 cells) or LSK cells cultured for 5 days with different fractions of isolated OB were co-transplanted with 100,000 BoyJ (CD45.1) competitor cells via tail vein injection in lethally irradiated CD45.2 X CD45.1 F1 recipients. At monthly intervals, chimerism was assessed as [CD45.2/(CD45.2 + CD45.1)]/100, thus eliminating the contribution of residual host-derived HSC. At 6 months after primary transplantation, the BM content of ½ a femur from each primary recipient was transplanted into a lethally irradiated CD45.2 X CD45.1 F1 secondary recipient without competitor cells, and engraftment was assessed at monthly intervals.
Progenitor cell assay
Cells were plated in duplicate in 3-cm Petri dishes containing 1 mL of methylcellulose with cytokines (MethoCult GF M3434; StemCell Technologies). Cultures were maintained at 37°C in a humidified incubator at 5% CO2, and colonies were counted on an inverted microscope after 7 days. CFU fold increase among cultured cells was calculated relative to the number of colonies obtained from the plating of 250 freshly isolated LSK cells on d0 under identical conditions.
Alkaline phosphatase activity
Alkaline phosphatase (ALP) activity was determined by the colorimetric conversion of p-nitrophenol phosphate to p-nitrophenol (Sigma) and normalized to total protein (BCA, Pierce) [26]. Briefly, cells were washed 2x with PBS, subsequently lysed with 0.1% (vol/vol) Triton X-100 supplemented with a cocktail of broad-range protease inhibitors (Pierce), subjected to two freeze-thaw cycles, and cleared via centrifugation. Lysates were incubated with 3 mg/ml p-nitrophenol phosphate in an alkaline buffer, pH 8.0, (Sigma) for 30 min at 37°C. The reaction was stopped by the addition of 20 mM NaOH and read at 405 nM (GENios Plus, Tecan). The enzymatic activity of ALP was determined by comparison with known p-nitrophenol standards (Sigma).
Quantitative analysis of calcium deposition
Calcium (Ca) deposition was assessed by eluting Alizarin Red S from cell monolayers as previously described [27]. Briefly, monolayers were washed 2X with PBS, subsequently fixed in ice cold 70% (v/v) ethanol for 1 hr, then washed 2X with water. Monolayers were stained with 40mM Alizarin Red S (pH 4.2) for 10 min (room temperature, shaking), unbound dye was removed by washing with water (5X) and with PBS (1X for 15 minutes, room temperature, shaking). Bound Alizarin Red was eluted by incubating monolayers with 1% (v/v) cetylpyridinium chloride in 10mM sodium phosphate (pH 7.0) for 15 min (room temperature, shaking). Absorbance from aliquots was measured at 562 nm (GENios Plus, Tecan), and Alizarin Red concentrations were calculated from measured standards (Ca/mol of dye in solution).
Quantitative real-time PCR
cDNA was made on μMACS columns (Miltenyi Biotec) using the μMACS one-step cDNA kit (Miltenyi Biotec, catalog no. 130-091-902) following the manufacturer’s instructions. Quantitative PCR was performed in an MX3000 detection system using SYBR Green PCR reagents following the manufacturer’s instructions (Stratagene). PCR amplification was performed in a 25 μL final volume containing 12.5 μL of 2x SYBR Mastermix, 2.5 μL of ROX (300nM, reference dye), 2.5 μL of each primer (at desired concentration), and 5 μL of template (cDNA diluted) using 95°C for 10 minutes, followed by 40 cycles at 95°C for 30 seconds and 55°C for 1 minute and 72°C for 30 seconds. For each gene analyzed, a calibration curve was performed and all the oligonucleotides were tested to ensure specificity and to determine the optimum concentration. For each sample, arbitrary units obtained using the standard curve and the expression of glyceraldehyde-3-phosphate dehydrogenase was used to normalize the amount of the investigated transcript. The sequence of the primers used was previously published [14,15].
Statistical analyses
Unless otherwise indicated, data are presented as the mean ± the standard deviation and triplicate samples were measured in experiments repeated at least 3 times. Student’s t-tests were performed when only two groups were compared. One-way factorial analyses of variances were used to make multiple group comparisons. Pair-wise Bonferroni comparisons were made to explore individual group differences while controlling for the elevated family-wise error associated with performing multiple comparisons. Linear regressions using analysis of variance model were performed to compare continuous data groups. All analyses were performed with the Statistical Package for Social Sciences (IBM SPSS 19; SPSS, Inc., Company, Armonk, NY) software and were two tailed with a level of significance set at 0.05.
Results
Expression of cell surface markers on fresh osteoblasts and phenotypic changes
The phenotypic definition of different stages of OB development based on their immunogenic surface markers is not yet fully known. Since other laboratories [10,16,17] and ours [14,15] already reported that OB from calvariae of 2-day-old pups are Lin− (CD45−, CD31−, Ter119−) and Sca1−, we examined the expression of several other known mesenchymal, hematopoietic, and other markers on these cells. The phenotypic characterization of freshly prepared OB is shown in Figure 1. Specifically, flow cytometric analysis revealed the positive expression of CD51, OPN, CD166, CD44, and CD90. However, 2-day calvariae OB did not express CD184, CD117, CD14, or CD11b.
Next, the relative expression of these markers on OB maintained in culture over a 6 week period was tracked. Freshly prepared calvaria-derived OB were sorted for Lin-Sca1− cells which were characterized for baseline (day 0) phenotypic expression of the panel of markers depicted in Figure 1. Sorted Lin-Sca1− OB were cultured for 6 weeks as described in the methods section and were harvested weekly for phenotypic analysis which included all cultured cells without any further gating (Figure 2). While there were variable expression patterns for all markers examined throughout the 6 weeks period, only CD166 declined sharply over time such that between weeks 3 and 6, <6% of all cells remained positive (Figure 2). One unexplained observation was that the percentage of CD166+ cells substantially increased between weeks 0 and 1 then declined progressively for the duration of the culture. A similar observation was noted for CD44 where the increase in the percentage of positive cells took place between weeks 0 and 2 with a reduction over time to <30% of cells expressing CD44 by week 6. Expression of CD51, and to a lesser extent that of OPN, was high and relatively unaltered throughout the time course (85% or higher at all time points). With respect to CD90, there was a marked increase in expression between weeks 0 and 1 which was maintained at high levels (>96%) thereafter. Similar data were observed when the cultures were initiated with total 2-day calvarial OB (Suppl Figure 1) suggesting that there was no preferential proliferation of a subgroup of cells that may have impacted the observed fluctuations in expression of these markers.
Interestingly, we found that the Lin-Sca1− fraction of 2-day calvarial OB cultured for 6 weeks and freshly isolated OB from the long bones of 6–8 week old mice contained a similar percentage of cells expressing CD166 (1.8% vs. 2.0%, respectively, Figure 3). In addition, the majority of cells in both groups were OPN+ (>90% in cultured 2 day calvarial OB and 77% in OB from 6–8 week long bones). Loss of CD166 expression with time among both cell groups suggests that CD166 expression is reduced with OB maturation.
Correlation between CD166 expression on osteoblasts and hematopoietic function
Previously, we have shown [15] that the hematopoietic function [LSK proliferation, colony forming unit content (CFU) expansion, and marrow repopulating potential] of LSK progeny recovered from co-culture with OB after 7 days was highest when these cells were maintained with freshly isolated OB (1 week total OB culture duration – nomenclature used in Figure 4). These parameters however, declined progressively when OB were pre-cultured for 1, 2, or 3 weeks prior to their use in mixed OB-LSK co-cultures (2, 3, or 4 weeks, respectively, for total OB culture duration – nomenclature used in Figure 4). Here we correlated the loss of CD166 over a 4-week time period with the same hematopoietic parameters examined in our previous studies. As can be seen in Figure 4, total cell number (Panel A), percentage of Lin-Sca1+ cells (Panel B), clonogenic cells produced in culture (Panel C), and the plating efficiency of these cells (Panel D) declined progressively, concomitant with a parallel decrease in the percentage of CD166+ cells in culture. Specifically, total number of LSK progeny was significantly lower (77%) in cultures with OB pre-cultured for 3 weeks (0.8 ± 0.3 x10⁶ cells) compared to co-cultures with freshly isolated OB (3.5 ± 0.3 x10⁶ cells). Similarly, when LSK progeny were assayed for CFU content, total CFU numbers were reduced (95%) in co-cultures with OB pre-cultured for 3 weeks (1,800 ± 800) compared to co-cultures with freshly prepared OB (34,300 ± 4,000). Likewise, the percentage of Lin− Sca1+ cells on day 7 was 1.0 ± 0.2% in co-cultures with OB pre-cultured for 3 weeks compared to 29.5 ± 3.6% in co-cultures with freshly isolated OB. Finally, the plating efficiency was also significantly decreased (75.9%) in co-cultures containing OB pre-cultured for 3 weeks as compared to co-cultures containing freshly prepared OB. Interestingly, hematopoietic properties were the highest in co-cultures containing freshly isolated OB cells expressing high levels of CD166 and declined with increasing culture duration. Specifically, upon isolation, 38.6±1.7% (n=3) of OB cells expressed CD166. After 1 week of culture, 60.3±2.3% of OB cells expressed CD166 and this was reduced to 3.9±1.0% within 5 additional weeks of culture. The same trend was observed for hematopoietic properties. Taken together, these data suggest that OB expressing CD166, which identifies less mature osteoblastic cells, mediate higher levels of HEA. In support of this, regression analyses demonstrated a close association between the percentage of CD166+ cells and all hematopoietic properties examined as all R values were >0.9 (Figure 4).
Figure 4.

CD166 expression (▲) in OB correlates with HEA (■) as assessed by cell number (A), % of Lin-Sca1+ cells (B), CFU number (C), and plating efficiency (D). OB culture duration is denoted as the total time OB are in culture (e.g. freshly prepared OB and seeded with LSK cells at d0 and cells are harvested at week 1 or OB are pre-cultured for 1, 2, or 3 weeks and then seeded with LSK cells for an additional 1 week of OB culture time, such that OB are cultured for a total of 2, 3, or 4 weeks). Value of CD166 represented by a triangle at week 0 corresponds to the percentage of CD166+ cells among freshly isolated OB. Data reported are the mean±SE of 3 independent experiments.
Hierarchical classification of osteoblasts based on surface markers
In light of the significance of CD166 expression on OB maturation and hematopoiesis, we used flow cytometric cell sorting to further stratify and phenotypically define calvarial-derived osteoblastic lineage cells. As we found that virtually all of the Lin-Sca1− cells also expressed CD51 (Figure 2), this marker was deemed dispensable and was not used for further separation or subfractionation of OB-lineage cells. Thus, we focused on CD166, OPN, CD44, and CD90. With these markers, we clearly identified two distinct groups of cells: Lin-Sca1-OPN+CD166+ (CD166+ cells) and Lin-Sca1-OPN+CD166− (CD166− cells). CD44 and CD90 further divided each of these groups into three discrete fractions as delineated in Figure 5A.
Isolated fractions were analyzed for their maturational status by quantitative real-time PCR (Figure 5B), ALP activity (Figure 5C), and bound Ca as a function of mineralization (Figure 5D). With respect to real-time PCR data, Runx2, which is critical for differentiation of early stage OB lineage cells [28–31] was expressed by both OPN+CD166+ and OPN+CD166− fractions of Lin-Sca1− cells (groups 1 and 5 in Figure 5B, respectively). Interestingly, within CD166+ cells, only CD44+CD90+ cells (group 3) expressed high levels of Runx2 which was detected in cells from groups 2 and 4, albeit at levels comparable to unsorted OB. As osteocalcin (OC) expression is a late marker of OB differentiation, the fact that the majority of the CD166− cells expressed higher levels of OC suggest that these are more mature OBs as compared to the CD166+ cells. This finding is consistent with data from Nakamura et al showing that CD166+ cells are progenitor cells [16]. Finally, like OC, ALP expression was higher in most of the CD166− cell populations compared to that observed in CD166+ cells. The relative expression of OC usually increases with OB maturation and with OB culture duration [32]. Together, these real-time PCR data suggest that CD166+ OB are more immature than their CD166− counterparts and suggest that the CD44+CD90+ subpopulation of CD166+ cells contains the most immature osteoblastic lineage cells.
In addition to mRNA expression of several important OB genes, functional data was collected regarding ALP activity and mineralization. As seen in Figure 5C, ALP activity mirrored gene expression data with two exceptions, groups 4 and 8 both had higher ALP activity compared to ALP mRNA expression. Interestingly both groups 4 and 8 are the CD44-CD90− fractions from the OPN+CD166+ and OPN+CD166− populations, respectively. Of significance is that OPN+CD166+CD44+ cultures (groups 2 and 3) had significantly less ALP activity than any of the other populations measured. Additionally, bound Ca was assessed as a functional measure of mineralization. As illustrated in Figure 5D, Ca deposition in groups 2 and 3 was significantly lower than that measured in unsorted OB and all other groups with the exception of group 7. Iinterestingly, group 7, like group 3 contains CD44+CD90+ cells.
Impact of segregated osteoblast fractions on hematopoietic function
Next, we assessed the ability of these various OB fractions (Figure 5A) to mediate HEA. Isolated OB subpopulations were plated 48 hours before seeding with 1000 freshly sorted B6.SJL-PtγcqPep3b/BoyJ (BoyJ)–derived LSK cells per well. After one week of co-culture, cells were harvested and various hematopoietic parameters were measured. No significant differences in the number of total LSK progeny were observed (data not shown). As shown in Figure 5E, the only significantly higher CFU fold increase relative to unfractionated Lin-Sca1− OB was sustained by groups 2 and 3 OB, both of which contain CD166+ OB. Similarly, Figure 5F shows that the only significantly higher percentage of cells expressing the phenotype Lin-Sca1+ was detected in co-cultures with group 3 OB which are CD166+. Since these data suggest that CD166-mediated interactions between OB and HSC are important for the maintenance of the HEA of OB, we examined in a separate co-culture system the impact of loss of CD166 on these interactions (Suppl Figure 2). These results demonstrated that interaction of CD166+ OB with the CD166+ fraction of LSK cells promoted a significantly higher levels of HEA compared to interaction with CD166− LSK cells.
Harvested cells were also analyzed for the expression of Sca1 and lineage markers (Figure 5F). Because the expression of CD117 is quickly downregulated via the internalization of the receptor in cultures supplemented with exogenous stem cell factor [23–25] we only analyzed progeny cells for the expression of Lin markers and Sca1. As shown in Figure 5F, a significantly higher number of Lin-Sca1+ cells (553±79x103 Lin-Sca1− cells) was produced in cultures maintained with group 3 OB relative to that produced in total unfractionated OB (337±45x103 Lin-Sca1− cells) as well as compared to that produced in cultures maintained with group 7 OB (324±67 x103 Lin-Sca1− cells).
These results suggest that LSK progeny produced in co-culture with CD166+CD44+CD90+ OB may retain a high level of BM repopulating potential. To examine this, the expansion equivalent of 1000 CD45.2 LSK cells co-cultured for 5 days with different OB subpopulations were used in a competitive repopulation assay in F1 recipient mice. Chimerism was measured every month for 6 months (6 month data only are displayed in Figure 5G; detailed monthly levels of chimerism are shown in Suppl Figure 3). Due to limited cell numbers in some OB lineage groups, only groups 1, 2, 3, 5, and 7 from Figure 5A along with unseparated Lin-Sca1− OB were examined. Figure 5G illustrates that although the LSK progeny from co-cultures with all OB fractions repopulated the BM, LSK cells co-cultured with CD166+CD44+CD90+ cells (group 3) sustained the highest level of chimerism 6 months post-transplantation (Figure 5G) and was the only group to sustain progressively increasing monthly levels of chimerism (Suppl Figure 2). These data suggest that group 3 OB may expand long-term repopulating LSK cells in culture at the expense of short-term repopulating cells or at least retard the loss and/or differentiation of long-term repopulating LSK cells. This possibility was further confirmed in secondary recipients that received 50% of cells contained in 1 femur of primary recipients 6 months after transplantation (Figure 5H). Secondary recipients of cells maintained with group 3 OB sustained chimerism levels substantially higher than those detected in primary recipients reaching almost 100% at 4 months post-transplantation (Figure 5H). Only recipients of control, freshly isolated LSK cells sustained equivalent levels of chimerism. None of the other LSK progeny harvested from co-cultures initiated with other OB subpopulations supported similar levels of chimerism.
Discussion
HSC remain in the BM in an undifferentiated state by maintaining the balance between differentiation and self-renewal divisions throughout life. The BM microenvironment or niche plays a crucial role in maintaining this balance and protects HSC from depletion [33]. The role of OB in maintaining HSC quiescence in endosteal regions and delivering proliferative signals to HSC during mobilization [10] is a burgeoning field of investigation. As an example, it has been shown that physical and molecular interactions between HSC and OB support in vitro hematopoiesis and survival [34,35], and co-transplantation of OB with HSC enhance sustained engraftment [13,36].
While it is clear that cells of the OB lineage provide signals for the survival, proliferation, and differentiation of HSC, the exact maturational and phenotypic status of OB that can confer HSC enhancing functions is still not yet known. We previously demonstrated that early stage OB (or less mature OB) freshly isolated from 2-day calvariae maintain HSC function, including BM repopulating potential, significantly better than later stage or more mature OB pre-cultured for 3 weeks under osteogenic inducing conditions [14,15]. Here, we used prospective multicolor flow cytometric cell sorting and functional assays, to construct a developmental hierarchy of OB and examined functional properties of HSC cultured with different fractions of phenotypically defined OB.
When considered together, previous studies contributed a composite definition of OB lineage cells as CD45-CD31-Ter119-Sca1− [10,16,17], OPN+ [10] and CD166+ [13,16], and possibly CD51+. However, until now, how these and other markers combine to define OB at different stages of maturation and to isolate osteoblastic cells with high HEA had not been completed. While Sca1 expression has been associated with many early stage progenitors in different tissues, Sca1+ cells from long bones of 6–8wk mice were recently examined by Nakamura et al [16] who demonstrated that Sca1+ALCAM− cells had high expression levels of mesenchymal stem cell-associated genes and were most likely a heterogeneous population of progenitor cells from the OB and adipocyte lineages. Based on these observations and on our previously data [13–15], we focused here on Sca1-CD166+ cells. Coupled with molecular analysis of early and late stage OB-specific maturational markers, we were able to identify Lin-Sca1-OPN+CD166+CD44+CD90+ OB as an early stage or immature osteoblastic precursor and to associate these cells with robust HEA as defined in our co-culture system. CD44 is the receptor for hyaluronic acid and is a cell-surface glycoprotein involved in cell–cell interactions and cell adhesion and migration. CD44+ OB can be induced to express high levels of RANKL [37]. As High levels of RANKL expression are generally associated with earlier stage OB [38], our data are consistent with the idea that CD44+ mark early stage OB as outlined here and highlighted by functional mineralization data (Figure 5D).
With respect to CD90 or Thy-1, it is expressed on a wide array of cell types including thymocytes, myoblasts, epidermal cells, and a variety of stem cells [39]. Chen et al [40] previously examined the expression of CD90 on several types of OB lineage cells. With freshly isolated and unsorted calvarial OB, Chen et al [40] observed low levels of CD90 expression which increased after 5 days in culture as we observed in our analyses (Figure 2). However, while CD90 expression was maintained at >96% between weeks 2 and 6 in our studies, Chen et al [40] reported a progressive decline from 75% expression to less than 20% expression by week 4. Most likely these differences are due to cells examined at day 0 in each study and maintained in culture thereafter. While we began our studies with flow cytometrically defined OB devoid of contaminating CD45+ cells, Chen et al established their cultures with a more heterogeneous group of cells most likely containing mature and immature CD45+ hematopoietic lineage cells.
Using relative mRNA expression levels for type I collagen, ALP, osteopontin, OC, and Runx2 as well as functional mineralization assays [15], we recently demonstrated [15] that OB cultures mature with increasing culture duration as previously reported [41]. Here we used a similar approach over 6 weeks to examine phenotypic changes of cultured OB and expand the definition of immature versus mature OB. Among changes observed in the expression of markers used to identify freshly isolated OB ([13,15] and Figure 2), those of CD44 and CD166 were the most interesting. These analyses revealed a bimodal distribution for the expression of both markers whereby expression increased after a short culture period (1–2 weeks), then dropped to low or undetectable levels (for CD166) by week 6. Taken together, our previously published data [15] and those reported here demonstrate that loss of CD166 expression correlates with OB maturation. In addition, because of how CD166 expression was associated with Runx2 expression (Figure 5), and because we previously demonstrated that high HEA was associated with high Runx2 expression [14], we examined the association between HEA and expression of CD166. As shown in Figure 4, decline in CD166 expression with increasing culture duration was strongly associated with a decrease in all hematopoietic parameters examined. These results demonstrate the significance of CD166 expression in the maintenance of HSC function and illustrate that progressive loss of CD166 in vitro signifies OB maturation while the gradual decline of CD166 expression in vivo (Figure 3) parallels the decreased number of early stage OB with age [42].
Although in vitro studies strongly suggested that CD166+ cells supported hematopoietic stem and progenitor cell function, it was critical to demonstrate the ability of these cells to enhance in vivo functional properties of repopulating stem cells using transplantation studies. Fractionation of OB with the markers examined in this study yielded a clear separation of groups identified by Runx 2 expression as early OB and cells with high levels of OC expression that were identified as more mature OB. Transplantation of LSK progeny expanded for 5 days over different groups of OB produced cells with varying levels of marrow repopulating potential. Only LSK progeny collected from co-cultures with Lin-Sca1-OPN+CD166+CD44+CD90+ OB (group 3 in Figure 5) showed increasing levels of chimerism every month for 6 months in primary recipients (Suppl Figure 3). More importantly, the increased levels of chimerism in this group were sustained in secondary transplants to levels only observed in control animals (those receiving freshly isolated LSK cells). Chimerism in primary recipients remained the same or decreased over the 6 month study duration for all of the other fractionated cell populations and none of the other fractionated cell populations demonstrated chimerism levels as high as those observed with OPN+CD166+CD44+CD90+ cells (Suppl Figure 3). Surprisingly, group 5 OB (OPN+CD166− cells) also sustained HSC function, albeit at a lower level (Figure 5). Analysis of cultured OB revealed that during the first 5 days of OB culture, CD166− cells acquire CD166 expression then lose that during the next 7 days (specific data not shown; please look at 1 week data for CD166 in Figure 2). So it is possible that LSK cells cultured over group 5 osteoblastic cells were in fact exposed to CD166+ OB early on in culture, a process that may explain why CD166− OB in group 5 mediated some hematopoiesis enhancing activity. This observation may suggest that CD166 is upregulated, as previously postulated with cell-cell contact since OB cultures seeded as described in our studies become confluent approximately 5–7 days post-seeding [43]. Related to this, CD166 is normally localized in intercellular junctions presumably as part of an adhesive complex that maintains tissue architecture [44] and may therefore increase in abundance as junctions between cultured cells increase with time. While these observations may explain the upregulation of CD166 expression in CD166− OB, it is difficult to reconcile the idea that CD166− which are presumably more mature can become CD166+ which are presumably less mature cells. However, this idea has been demonstrated with the definitive human CD34+ HSC as CD34− cells have been shown to become CD34+ in response to in vitro stimulation [45]. Finally, these findings may suggest that additional markers are required to better segregate HEA and definitively identify immature OB in a hierarchical manner.
Our functional and phenotypic data reported here and published elsewhere [13–15] suggest that HEA is associated with OB that express high levels Runx2 but lower ALP and Ca activity levels. To a large degree, this categorization places together phenotypically defined groups of OB that express high levels of CD166 and CD44 (groups 1, 2, and 3 in Figure 5) as potential high promoters of HEA and groups that are CD166− (groups 5, 6, and 7 in Figure 5) as poor promoters of HEA. This compartmentalization does not account for the observed activity of group 5 which cannot be explained by our present data.
In summary, we show here the importance of CD166 expression on OB lineage cells in promoting hematopoiesis. Our in vitro data suggest that CD166 expression correlates with the hematopoietic parameters tested. Additionally, we have begun to identify cell surface markers on OB cells which can segregate OB maturation and HEA mediated by osteoblastic cells. Specifically, we identified Lin-Sca1-OPN+CD166+CD44+CD90+ OB as osteoblastic lineage cells promoting hematopoietic progenitor and stem cell proliferation and function in vitro and in vivo.
Supplementary Material
Freshly isolated total 2-day calvarial OB were examined on day 0 and after 1, 2, 3, 4, and 6 weeks of culture for the expression of CD51, OPN, CD166, CD44, and CD90. All cultured cells were included in the weekly analysis without any further gating. Representative flow cytometric data from three independent identical analyses. Positive events (light grey histogram) were determined by direct comparison to isotype-matched fluorochrome-conjugated controls (dark grey histogram) for each marker.
OB were cultured for 3 days then seeded with total LSK cells or LSK cells subfractionated on the basis of CD166 expression. Wells received recombinant murine stem cell factor and interleukin-3 (10 ng/mL), insulin-like growth factor 1 and thrombopoietin (20 ng/mL), interleukin-6 and Fms-like tyrosine kinase 3 (25 ng/mL), and OPN (50 ng/mL). Cells were harvested by gentle agitation on day 7 to collect non-adherent cells which were counted and plated in methylcellulose-based clonogenic assays. Colony formation was assessed 7 days later. Data are presented as CFU fold increase which was calculated relative to the number of CFU obtained from 250 freshly isolated LSK cells assayed on day 0. n = 4 or 5 independent experiments. *p<0.05
(A) Chimerism was determined monthly in mice transplanted with progeny of LSK cells co-cultured for 5 days with unsorted OB “U”, without OB “P”, with groups of OB identified in Figure 5A, or with freshly-sorted LSK cells “F” in a competitive repopulation assay as described in Figure 5. Here we present expanded data from Figure 5G. For ease of presentation, we present data from 1, 5 and 6 months post-transplantation in primary recipients (from Left to Right in each group of mice, respectively). (B) At 6 months post- transplantation, BM cells from primary recipients were transplanted into secondary recipients without competitor cells (expanded data from Figure 5H). Each mouse received 50% of cells contained in one femur of primary recipients. Chimerism was determined monthly for 4 months post-transplantation in secondary recipients (n=4–5 per group). *p<0.05 vs. group 3. For ease of presentation, 1, 2, and 4 month post-transplantation data are presented (from Left to Right in each group of mice, respectively).
Higlights.
ALCAM/CD166 expression in CD45-CD31-Ter119-Sca1− osteoblasts increases during the first week of culture and then dramatically declines with culture duration.
ALCAM/CD166 expression in osteoblasts directly correlates with hematopoietic activity and function of LSK cells co-cultured with osteoblasts.
LSK cells co-cultured with Lin-OPN+CD166+CD44+CD90+ osteoblasts sustain the highest in vivo repopulating potential in primary and secondary recipients.
Acknowledgments
The authors thank the operators of the Indiana University Melvin and Bren Simon Cancer Center Flow Cytometry Resource Facility for their outstanding technical help and support. This work was supported in part by grant NHLBI R01 HL55716 (E.F.S.) and the Indiana Center for Excellence in Molecular Hematology (NIDDK P30 DK090948). The Flow Cytometry Research Facility is partially funded by NCI P30 CA082709.
Footnotes
Publisher's Disclaimer: This is a PDF file of an unedited manuscript that has been accepted for publication. As a service to our customers we are providing this early version of the manuscript. The manuscript will undergo copyediting, typesetting, and review of the resulting proof before it is published in its final citable form. Please note that during the production process errors may be discovered which could affect the content, and all legal disclaimers that apply to the journal pertain.
References
- 1.Fuchs S, Satler LF, Kornowski R, et al. Catheter-based autologous bone marrow myocardial injection in no-option patients with advanced coronary artery disease: A feasibility study. J Am Coll Cardiol. 2003;41:1721–4. doi: 10.1016/s0735-1097(03)00328-0. [DOI] [PubMed] [Google Scholar]
- 2.Li L, Xie T. Stem cell niche: Structure and function. Annu Rev Cell Dev Biol. 2005;21:605–31. doi: 10.1146/annurev.cellbio.21.012704.131525. [DOI] [PubMed] [Google Scholar]
- 3.Moore KA, Lemischka IR. Stem cells and their niches. Science. 2006;311:1880–5. doi: 10.1126/science.1110542. [DOI] [PubMed] [Google Scholar]
- 4.Ellis SL, Grassinger J, Jones A, et al. The relationship between bone, hemopoietic stem cells, and vasculature. Blood. 2011;118:1516–24. doi: 10.1182/blood-2010-08-303800. [DOI] [PubMed] [Google Scholar]
- 5.Kopp HG, Avecilla ST, Hooper AT, Rafii S. The bone marrow vascular niche: Home of HSC differentiation and mobilization. Physiology (Bethesda) 2005;20:349–56. doi: 10.1152/physiol.00025.2005. [DOI] [PubMed] [Google Scholar]
- 6.Purton LE, Scadden DT. The hematopoietic stem cell niche (November 15, 2008) In: Silberstein L, editor. StemBook. The Stem Cell Research Community, StemBook; 2008. http://www.stembook.org. [DOI] [Google Scholar]
- 7.Haylock DN, Williams B, Johnston HM, et al. Hemopoietic stem cells with higher hemopoietic potential reside at the bone marrow endosteum. Stem Cells. 2007;25:1062–9. doi: 10.1634/stemcells.2006-0528. [DOI] [PubMed] [Google Scholar]
- 8.Wilson A, Oser GM, Jaworski M, et al. Dormant and self-renewing hematopoietic stem cells and their niches. Ann N Y Acad Sci. 2007;1106:64–75. doi: 10.1196/annals.1392.021. [DOI] [PubMed] [Google Scholar]
- 9.Heissig B, Hattori K, Dias S, et al. Recruitment of stem and progenitor cells from the bone marrow niche requires MMP-9 mediated release of kit-ligand. Cell. 2002;109:625–37. doi: 10.1016/s0092-8674(02)00754-7. [DOI] [PMC free article] [PubMed] [Google Scholar]
- 10.Mayack SR, Wagers AJ. Osteolineage niche cells initiate hematopoietic stem cell mobilization. Blood. 2008;112:519–31. doi: 10.1182/blood-2008-01-133710. [DOI] [PMC free article] [PubMed] [Google Scholar] [Retracted]
- 11.Arai F, Hirao A, Ohmura M, et al. Tie2/angiopoietin-1 signaling regulates hematopoietic stem cell quiescence in the bone marrow niche. Cell. 2004;118:149–61. doi: 10.1016/j.cell.2004.07.004. [DOI] [PubMed] [Google Scholar]
- 12.Calvi LM, Adams GB, Weibrecht KW, et al. Osteoblastic cells regulate the haematopoietic stem cell niche. Nature. 2003;425:841–6. doi: 10.1038/nature02040. [DOI] [PubMed] [Google Scholar]
- 13.Chitteti BR, Cheng YH, Poteat B, et al. Impact of interactions of cellular components of the bone marrow microenvironment on hematopoietic stem and progenitor cell function. Blood. 2010;115:3239–48. doi: 10.1182/blood-2009-09-246173. [DOI] [PMC free article] [PubMed] [Google Scholar]
- 14.Chitteti BR, Cheng YH, Streicher DA, et al. Osteoblast lineage cells expressing high levels of Runx2 enhance hematopoietic progenitor cell proliferation and function. J Cell Biochem. 2010;111:284–9. doi: 10.1002/jcb.22694. [DOI] [PMC free article] [PubMed] [Google Scholar]
- 15.Cheng YH, Chitteti BR, Streicher DA, et al. Impact of maturational status on the ability of osteoblasts to enhance the hematopoietic function of stem and progenitor cells. J Bone Miner Res. 2011;26:1111–2. doi: 10.1002/jbmr.302. [DOI] [PMC free article] [PubMed] [Google Scholar]
- 16.Nakamura Y, Arai F, Iwasaki H, et al. Isolation and characterization of endosteal niche cell populations that regulate hematopoietic stem cells. Blood. 2010;116:1422–3. doi: 10.1182/blood-2009-08-239194. [DOI] [PubMed] [Google Scholar]
- 17.Semerad CL, Christopher MJ, Liu F, et al. G-CSF potently inhibits osteoblast activity and CXCL12 mRNA expression in the bone marrow. Blood. 2005;106:3020–7. doi: 10.1182/blood-2004-01-0272. [DOI] [PMC free article] [PubMed] [Google Scholar]
- 18.Wong GL, Cohn DV. Target cells in bone for parathormone and calcitonin are different: Enrichment for each cell type by sequential digestion of mouse calvaria and selective adhesion to polymeric surfaces. Proc Natl Acad Sci U S A. 1975;72:3167–71. doi: 10.1073/pnas.72.8.3167. [DOI] [PMC free article] [PubMed] [Google Scholar]
- 19.Horowitz MC, Fields A, DeMeo D, Qian HY, Bothwell AL, Trepman E. Expression and regulation of ly-6 differentiation antigens by murine osteoblasts. Endocrinology. 1994;135:1032–43. doi: 10.1210/endo.135.3.7520861. [DOI] [PubMed] [Google Scholar]
- 20.Ciovacco WA, Goldberg CG, Taylor AF, et al. The role of gap junctions in megakaryocyte- mediated osteoblast proliferation and differentiation. Bone. 2009;44:80–6. doi: 10.1016/j.bone.2008.08.117. [DOI] [PMC free article] [PubMed] [Google Scholar]
- 21.Jilka RL, Cohn DV. Role of phosphodiesterase in the parathormone-stimulated adenosine 3′,5′-monophosphate response in bone cell populations enriched in osteoclasts and osteoblasts. Endocrinology. 1981;109:743–7. doi: 10.1210/endo-109-3-743. [DOI] [PubMed] [Google Scholar]
- 22.Simmons DJ, Kent GN, Jilka RL, Scott DM, Fallon M, Cohn DV. Formation of bone by isolated, cultured osteoblasts in millipore diffusion chambers. Calcif Tissue Int. 1982;34:291–4. doi: 10.1007/BF02411253. [DOI] [PubMed] [Google Scholar]
- 23.Danet GH, Lee HW, Luongo JL, Simon MC, Bonnet DA. Dissociation between stem cell phenotype and NOD/SCID repopulating activity in human peripheral blood CD34(+) cells after ex vivo expansion. Exp Hematol. 2001;29:1465–73. doi: 10.1016/s0301-472x(01)00750-0. [DOI] [PubMed] [Google Scholar]
- 24.Eto T, Winkler I, Purton LE, Levesque JP. Contrasting effects of P-selectin and E-selectin on the differentiation of murine hematopoietic progenitor cells. Exp Hematol. 2005;33:232–4. doi: 10.1016/j.exphem.2004.10.018. [DOI] [PubMed] [Google Scholar]
- 25.Yee NS, Hsiau CW, Serve H, Vosseller K, Besmer P. Mechanism of down-regulation of c-kit receptor. roles of receptor tyrosine kinase, phosphatidylinositol 3′-kinase, and protein kinase C. J Biol Chem. 1994;269:31991–8. [PubMed] [Google Scholar]
- 26.Hughes FJ, Aubin JE. Culture of Cells of the Osteoblast Lineage. In: Arnett TR, Henderson B, editors. Methods in bone biology. 1. London, UK: Chapman & Hall; 1998. pp. 1–49. [Google Scholar]
- 27.Stanford CM, Jacobson PA, Eanes ED, Lembke LA, Midura RJ. Rapidly forming apatitic mineral in an osteoblastic cell line (UMR 106-01 BSP) J Biol Chem. 1995;270:9420–8. doi: 10.1074/jbc.270.16.9420. [DOI] [PubMed] [Google Scholar]
- 28.Stein GS, Lian JB. Molecular mechanisms mediating proliferation/differentiation interrelationships during progressive development of the osteoblast phenotype. Endocr Rev. 1993;14:424–42. doi: 10.1210/edrv-14-4-424. [DOI] [PubMed] [Google Scholar]
- 29.Otto F, Thornell AP, Crompton T, et al. Cbfa1, a candidate gene for cleidocranial dysplasia syndrome, is essential for osteoblast differentiation and bone development. Cell. 1997;89:765–71. doi: 10.1016/s0092-8674(00)80259-7. [DOI] [PubMed] [Google Scholar]
- 30.Mundlos S. Cleidocranial dysplasia: Clinical and molecular genetics. J Med Genet. 1999;36:177–82. [PMC free article] [PubMed] [Google Scholar]
- 31.Lian JB, Javed A, Zaidi SK, et al. Regulatory controls for osteoblast growth and differentiation: Role of runx/cbfa/AML factors. Crit Rev Eukaryot Gene Expr. 2004;14:1–41. [PubMed] [Google Scholar]
- 32.Krause C, de Gorter DJJ, Karperien M, ten Dijke P. Chapter 2. Signal Transduction Cascades Controlling Osteoblast Differentiation. In: Rosen CJ, editor. Primer on the metabolic bone diseases and disorders of mineral metabolism. 7. Washington, DC: American Society for Bone and Mineral Research; 2008. pp. 10–16. [Google Scholar]
- 33.Scadden DT. The stem-cell niche as an entity of action. Nature. 2006;441:1075–9. doi: 10.1038/nature04957. [DOI] [PubMed] [Google Scholar]
- 34.Taichman RS, Emerson SG. Human osteoblasts support hematopoiesis through the production of granulocyte colony-stimulating factor. J Exp Med. 1994;179:1677–82. doi: 10.1084/jem.179.5.1677. [DOI] [PMC free article] [PubMed] [Google Scholar]
- 35.Jung Y, Wang J, Havens A, et al. Cell-to-cell contact is critical for the survival of hematopoietic progenitor cells on osteoblasts. Cytokine. 2005;32:155–62. doi: 10.1016/j.cyto.2005.09.001. [DOI] [PubMed] [Google Scholar]
- 36.El-Badri NS, Wang BY, Cherry, Good RA. Osteoblasts promote engraftment of allogeneic hematopoietic stem cells. Exp Hematol. 1998;26:110–6. [PubMed] [Google Scholar]
- 37.Hirata M, Kobayashi M, Takita M, Matsumoto C, Miyaura C, Inada M. Hyaluronan inhibits bone resorption by suppressing prostaglandin E synthesis in osteoblasts treated with interleukin-1. Biochem Biophys Res Commun. 2009;381:139–43. doi: 10.1016/j.bbrc.2009.01.146. [DOI] [PubMed] [Google Scholar]
- 38.Atkins GJ, Kostakis P, Pan B, et al. RANKL expression is related to the differentiation state of human osteoblasts. J Bone Miner Res. 2003;18:1088–9. doi: 10.1359/jbmr.2003.18.6.1088. [DOI] [PubMed] [Google Scholar]
- 39.Saalbach A, Wetzig T, Haustein UF, Anderegg U. Detection of human soluble thy-1 in serum by ELISA. fibroblasts and activated endothelial cells are a possible source of soluble thy-1 in serum. Cell Tissue Res. 1999;298:307–15. doi: 10.1007/s004419900079. [DOI] [PubMed] [Google Scholar]
- 40.Chen XD, Qian HY, Neff L, Satomura K, Horowitz MC. Thy-1 antigen expression by cells in the osteoblast lineage. J Bone Miner Res. 1999;14:362–75. doi: 10.1359/jbmr.1999.14.3.362. [DOI] [PubMed] [Google Scholar]
- 41.Gerstenfeld LC, Chipman SD, Glowacki J, Lian JB. Expression of differentiated function by mineralizing cultures of chicken osteoblasts. Dev Biol. 1987;122:49–60. doi: 10.1016/0012-1606(87)90331-9. [DOI] [PubMed] [Google Scholar]
- 42.Jilka RL. Osteoblast progenitor fate and age-related bone loss. J Musculoskelet Neuronal Interact. 2002;2:581–3. [PubMed] [Google Scholar]
- 43.Swart GW. Activated leukocyte cell adhesion molecule (CD166/ALCAM): Developmental and mechanistic aspects of cell clustering and cell migration. Eur J Cell Biol. 2002;81:313–21. doi: 10.1078/0171-9335-00256. [DOI] [PubMed] [Google Scholar]
- 44.Ofori-Acquah SF, King JA. Activated leukocyte cell adhesion molecule: A new paradox in cancer. Transl Res. 2008;151:122–8. doi: 10.1016/j.trsl.2007.09.006. [DOI] [PubMed] [Google Scholar]
- 45.Bhatia M, Bonnet D, Murdoch B, Gan OI, Dick JE. A newly discovered class of human hematopoietic cells with SCID-repopulating activity. Nat Med. 1998;4:1038–45. doi: 10.1038/2023. [DOI] [PubMed] [Google Scholar]
Associated Data
This section collects any data citations, data availability statements, or supplementary materials included in this article.
Supplementary Materials
Freshly isolated total 2-day calvarial OB were examined on day 0 and after 1, 2, 3, 4, and 6 weeks of culture for the expression of CD51, OPN, CD166, CD44, and CD90. All cultured cells were included in the weekly analysis without any further gating. Representative flow cytometric data from three independent identical analyses. Positive events (light grey histogram) were determined by direct comparison to isotype-matched fluorochrome-conjugated controls (dark grey histogram) for each marker.
OB were cultured for 3 days then seeded with total LSK cells or LSK cells subfractionated on the basis of CD166 expression. Wells received recombinant murine stem cell factor and interleukin-3 (10 ng/mL), insulin-like growth factor 1 and thrombopoietin (20 ng/mL), interleukin-6 and Fms-like tyrosine kinase 3 (25 ng/mL), and OPN (50 ng/mL). Cells were harvested by gentle agitation on day 7 to collect non-adherent cells which were counted and plated in methylcellulose-based clonogenic assays. Colony formation was assessed 7 days later. Data are presented as CFU fold increase which was calculated relative to the number of CFU obtained from 250 freshly isolated LSK cells assayed on day 0. n = 4 or 5 independent experiments. *p<0.05
(A) Chimerism was determined monthly in mice transplanted with progeny of LSK cells co-cultured for 5 days with unsorted OB “U”, without OB “P”, with groups of OB identified in Figure 5A, or with freshly-sorted LSK cells “F” in a competitive repopulation assay as described in Figure 5. Here we present expanded data from Figure 5G. For ease of presentation, we present data from 1, 5 and 6 months post-transplantation in primary recipients (from Left to Right in each group of mice, respectively). (B) At 6 months post- transplantation, BM cells from primary recipients were transplanted into secondary recipients without competitor cells (expanded data from Figure 5H). Each mouse received 50% of cells contained in one femur of primary recipients. Chimerism was determined monthly for 4 months post-transplantation in secondary recipients (n=4–5 per group). *p<0.05 vs. group 3. For ease of presentation, 1, 2, and 4 month post-transplantation data are presented (from Left to Right in each group of mice, respectively).