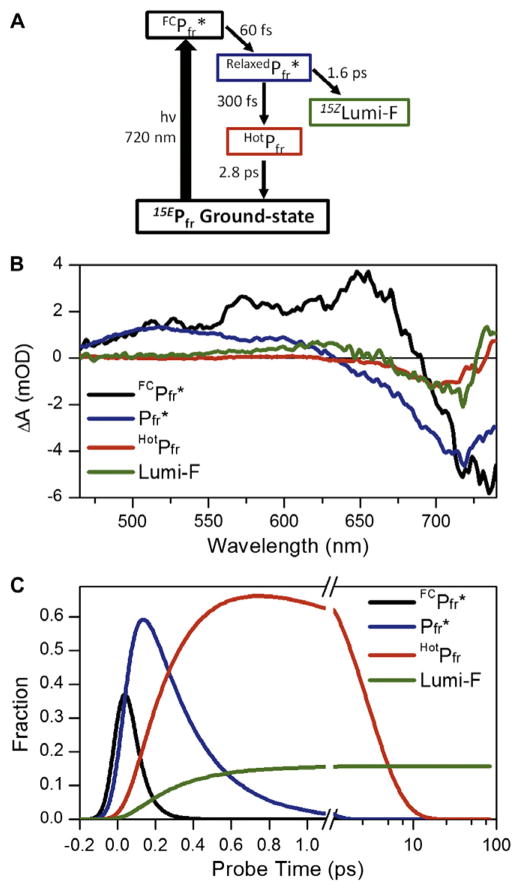
Abstract
Femtosecond photodynamics of the reverse (15EPfr→15ZPr) reaction of the red/far-red phytochrome Cph1 from Synechocystis were resolved with visible broadband transient absorption spectroscopy. Multi-phasic dynamics were resolved and separated via global target analysis into a fast-decaying (260 fs) excited-state population that bifurcates to generate the isomerized Lumi-F primary photoproduct and a non-isomerizing vibrationally excited ground state that relaxes back into the 15EPfr ground state on a 2.8-ps time scale. Relaxation on a 1-ms timescale results in the loss of red absorbing region, but not blue region, of Lumi-F, which indicates that formation of 15ZPr occurs on slower timescales.
1. Introduction
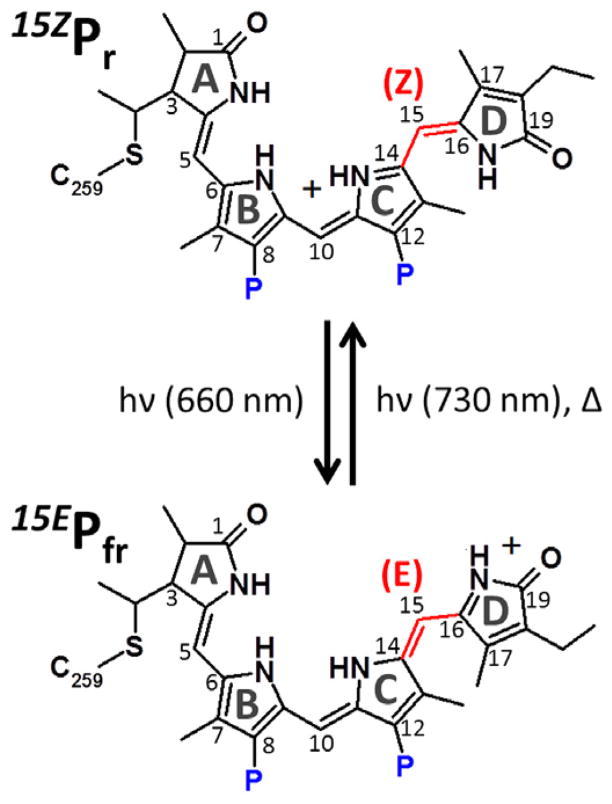
Phytochromes are photoswitching photoreceptors that regulate light responses of organisms ranging from plants, bacteria, cyanobacteria, and fungi [1–3]. In plants, phytochromes activate gene expression to adjust development and optimize growth in response to changing light environments, especially under limiting light conditions [4]. These photoswitching proteins measure the ambient light environment via photoisomerization of a covalently bound linear tetrapyrrole (bilin) chromophore between a dark-stable red-absorbing state (15ZPr) and a metastable far-red-absorbing photoproduct (15EPfr). In most phytochromes, isomerization of the bilin 15,16-double bond (Scheme 1) from the photoproduct 15E configuration to the dark-state 15Z configuration can also occur thermally in a process known as dark reversion that proceeds via a distinct set of intermediates relative to the forward 15ZPr to 15EPfr photoconversion [5].
Scheme 1.
Phycocyanobilin structure in 15ZPr and 15EPfr states of Cph1. The primary photoreaction occurs via the isomerization of the bridge between Z/E and E/Z conformations (C14, 15, and 16) between C and D rings for forward and reverse directions, respectively. The propionate groups are labeled in blue ‘P’. The formal charge is placed on the D-ring in 15EPfr to reflect the changed hydrogen bonding environment of the D-ring in this state.
The cyanobacterial phytochrome Cph1 from Synechocystis sp. PCC6803 utilizes a phycocyanobilin adduct (PCB, Scheme 1) as the chromophore [5,6]. The 15Z configuration of the Pr chromophore of Cph1 has been established by X-ray crystallography [7], while the 15E configuration of Pfr has been determined via magic- angle spinning (MAS) NMR [8]. The excited-state dynamics of Pr and Pfr differ [9], with the reverse reaction of 15EPfr exhibiting significantly faster dynamics than the forward reaction of 15ZPr. The more rapid ultrafast dynamics of 15EPfr also have been seen in other phytochrome systems [10–13]. Despite the differing time-scales for the both directions, the isomerization quantum yields (Φ) are comparable – both estimated to be ~15% [14].
While the forward photodynamics of Cph1 [9] have been extensively studied [9,15–18], the reverse photodynamics are less well understood. The present studies address this dearth of knowledge by measuring visible broadband transient absorption (TA) signals from 460–740 nm with 100-fs time resolution. When coupled with global target analysis [19,20], we have resolved S1 excited state evolution following Franck–Condon (FC) excitation from the subsequent excited-state reaction pathways that bifurcate to generate the Lumi-F primary photoproduct and a non-isomerizing hot ground-state population, which cools to restore the 15EPfr ground-state. Bifurcation and rapid decay of the excited state are responsible for the low isomerization quantum yield as well as the lack of static 15EPfr fluorescence, illustrating how fundamental knowledge of the primary dynamics of such systems will be invaluable for development of new fluorescence probes [21,22] and optogenetic tools [23–25].
2. Experiment
N-terminally truncated, photochemically active Cph1 was prepared as described previously [15]. The primary light source was an amplified Ti:sapphire laser system (Spectra Physics Spitfire Pro) that delivered 1-kHz pulses at λcenter = 790 nm with an energy of 2.4 mJ and a 40-fs full width at half maximum (FWHM) duration. The laser beam was split into two separate pathways for the independent generation of the pump and probe pulses. The pump pulses were produced by a home-built non-collinear optical parametric amplifier (NOPA) that generated 300-nJ pulses with λcenter = 730 nm and a 25-nm FWHM bandwidth (Figure 1). The broadband white-light probe pulses were generated by focusing a portion of the fundamental 790-nm pulses into a slowly translating 2-mm CaF2 crystal. After being temporally and spatially overlapped with the pump pulses in the Cph1 sample, the probe light was detected by an imaging spectrograph (Oriel MS 127) equipped with a 256-pixel photodiode array (Hamamatsu S3901 and C7884). The resulting TA signals had a ~100-fs temporal resolution (instrumental response function, IRF), estimated by the rise of the excited-state absorption (ESA) band. The probe pulses were mechanically delayed with respect to the pump pulse by a computer-controlled linear motor stage (Newport IMS 6001). The polarization of pump and probe pulses were set at 54.7° (magic angle) with respect to each other to eliminate any anisotropic effects. The Cph1 sample was flowed continuously through a custom-made quartz 1-mm flow cell that was back illuminated with 650-nm filtered output of a high-pressure mercury arc lamp (Ushio, USH-210 EL, output 350–900 nm) in a universal arc lamp housing (Newport, Oriel M-66055) during the measurement. The optical density of the Cph1 sample was 0.11 at 725 nm after continuous irradiation and approximately ~4% of the sample in the probe volume was excited by the pump pulse based on the initial amplitude of the bleach band. After the experiment, about 20% of the sample had degraded. The 1-ms spectrum was measured by collecting the pre-time zero signal (i.e., before the excitation pump’s arrival time) at low flow rate.
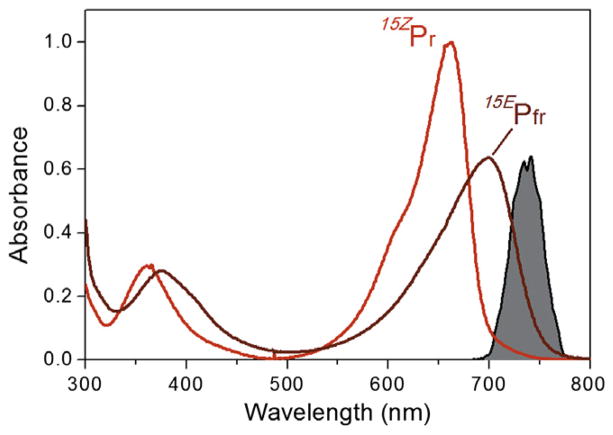
Figure 1.
Experimental spectra of Cph1 in the 15ZPr state (red curve) and the 15EPfr state (dark red curve). The 15EPfr spectrum was estimated from a photostationary equilibrium of both populations since full conversion of the sample into 15EPfr was not attainable due to strong spectral overlap between the two states. The ultrafast excitation pulse spectrum (filled grey curve) is centered at 730 nm to selectively excite the 15EPfr population. (For interpretation of the references to color in this figure legend, the reader is referred to the web version of this article.)
3. Results
Figure 1 compares the static UV/VIS absorption spectra of 15ZPr and 15EPfr overlaid with the 730-nm excitation pump spectrum. As with most biliproteins, there are two transitions associated with the chromophore at lower energy than the 280 nm band associated with aromatic amino acids. Both of these transitions are red-shifted for 15EPfr relative to 15ZPr (red: S0→S1, 699 vs. 663 nm and blue: S0→S2, 375 vs. 360 nm). The 730-nm excitation pump was tuned to excite the 15EPfr state with only weak overlap between the excitation spectrum and the 15ZPr absorption spectrum. As expected, the 15EPfr TA signals presented below show no signs of contamination with interfering, and spectrally and temporally distinct, 15ZPr TA signals.
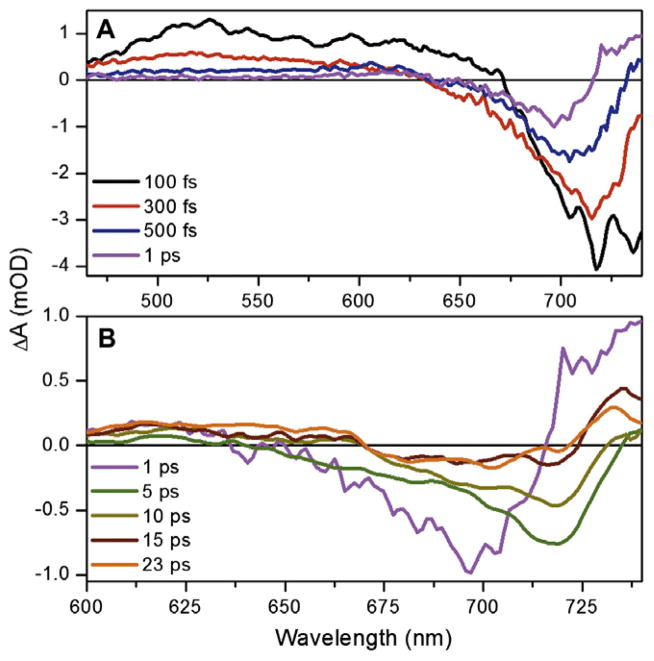
The TA spectra at selected probe times are contrasted in Figure 2. The early time TA spectra (Figure 2A) exhibit characteristic excited-state signals including positive excited-state absorption (ESA) and negative stimulated emission (SE) bands that overlap a negative ground-state bleach (loss of 15EPfr absorption). At later times (>1 ps), the TA spectra exhibit positive photoproduct absorption and negative ground-state depletion (Figure 2B). The subpicosecond transient spectra exhibit complex spectral dynamics, with an instantaneous rise of a spectrum exhibiting a broad positive ESA band from 460 to 640 nm with a negative band peaking around 725 nm due to ground-state bleach and SE (Figure 2A, black curve). This spectrum is attributed to the unrelaxed FC excited-state population prior to relaxation on the S1 potential surface, which rapidly evolves (<100 fs) into a ‘relaxed’ excited-state spectrum (Figure 2A, red curve). Due to the limited temporal resolution of current Letter (~100 fs), the rapidly-decaying FC spectrum was not fully analyzed here including its evolution, which can vary from 40 to 80 fs within the global analysis. The relaxed excited-state spectrum evolves within 500 fs (Figure 2A, blue curve), into a new spectrum with positive signals in the near infrared (>720 nm) and in the orange-red (~610 nm) regions.
Figure 2.
Transient spectra of Cph1 reverse reaction in (A) sub-picosecond, and (B) post-picosecond regimes. The 5, 10, 15, and 23-ps spectra in panel B are smoothed for visual inspection due to low signal amplitude. The 460–600 nm spectral range is not shown in panel B to emphasize the low-energy dynamics.
Kinetic traces at representative probe wavelengths are shown in Figure 3. Sub-picosecond rise kinetics of the red-shifted (>710 nm) and blue-shifted (~610 nm) absorptions are well resolved by the 740 and 625-nm traces (Figure 3D and B, respectively). The 625- nm kinetic traces (Figure 3B) show the rapid depletion of the ESA signal followed by a persistent positive absorption up to and presumably beyond 100-ps. In contrast, the 740-nm trace shows a rapid formation of a positive absorption followed by a subsequent slower decay. The decay of the ESA band from 460–550 nm is almost complete by 1 ps (Figure 2A, purple curve and Figure 3A), confirming that the excited state is rapidly quenched.
Figure 3.
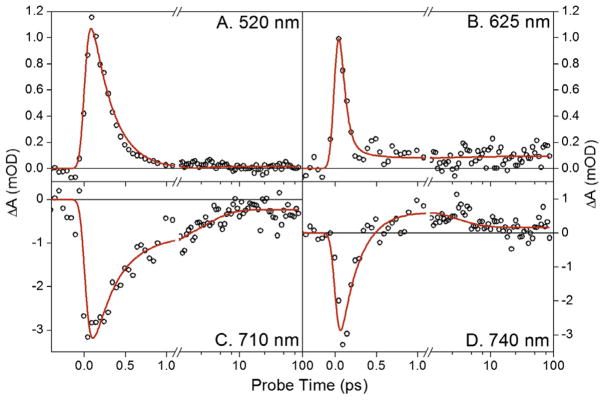
Kinetic traces at select probe wavelengths. The traces are fit (red line) with the kinetic model described in Figure 6. (For interpretation of the references to color in this figure legend, the reader is referred to the web version of this article.)
The post-picosecond dynamics (Figure 2B) are also multi-phasic. Due to the low signal level (<0.5 mOD) of the raw data, all spectra presented in Figure 2B after 1 ps (purple curve) were smoothed over a 10-pixel window to aid in visual inspection; the global analysis discussed below however was performed with the raw data. Although the 625-nm band is depleted from 1 to 5-ps (Figure 2B, magenta and green curves, respectively), the 625-nm kinetics (Figure 3B) clearly shows a persistent absorption after 300 fs. Thus the depletion of 625-nm absorption that is ascribed to the quenching of ESA (occurring at the same time as the loss of SE at 710 nm) overlaps an absorption from a terminal population with a distinctly different spectral shape (discussed in detail below). The 710 and 740-nm kinetic traces (Figure 3C and D, respectively) clearly resolve post-picosecond dynamics that are also observed in the transient spectra. Comparing the 1 and 5-ps transient spectra (Figure 2B, magenta and green curves respectively) shows the bleach/SE band’s red shifts from 700 to 720 nm along with a significant depletion of the near infrared-absorbing band (<710 nm). The primary 15ZLumi-F photoproduct is fully formed by the 23-ps spectrum (orange curve) with a broad bleach band flanked by positive bands peaking around 630 and 735 nm. The 1-ms transient difference spectrum (Figure 4, red curve) is contrasted with the 15ZPr–15EPfr difference spectra (blue curve) and the calculated Lumi-F – 15EPfr difference spectrum extracted from global analysis below (green curve). For comparison, the 1-ms spectrum is scaled to 60%, implying that a growth of the signal in the spectrally overlapping region at about 630 nm occurs after 100 ps, but before 1 ms.
Figure 4.
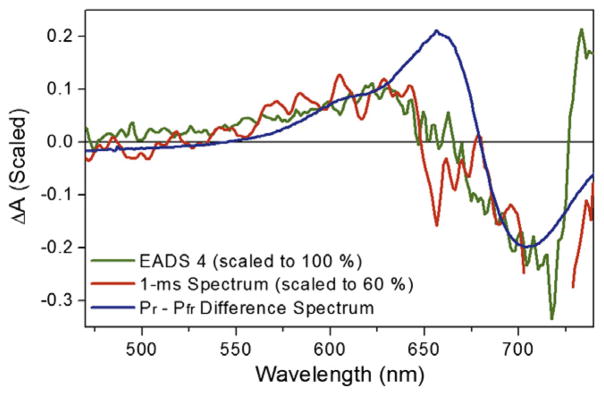
The 1-ms transient difference spectrum (red curve) is compared with EADS4 (green curve) and the Pr–Pfr difference spectrum (blue curve). The 1-ms spectrum is scaled to 60% to match the EADS4 amplitude. (For interpretation of the references to color in this figure legend, the reader is referred to the web version of this article.)
4. Global-target analysis of the primary photodynamics
The transient signals were analyzed within a multi-compartment global analysis formalism (19,20) that fits the data to an underlying ‘target’ model with time-dependent populations (concentration profiles) associated with time-independent spectra (Species Associated Difference Spectra or SADS). This is accomplished by fitting the data with numerical solutions of linear first-order differential equations describing a postulated model (Eq. (1)):
| (1) |
where ni represents the microscopic population of interest, AiI(t) is the pump pulse temporal width, and K is the rate constant matrix describing the exponential flow from one population into another. If the underlying target model accurately describes the dynamics, the extracted spectra from the analysis are SADS and represent the true difference spectra of the constituent populations. If the model is inaccurate, then the resulting spectra from the global fitting are Evolutionary Associated Difference Spectra (EADS) and are linear combinations of the underlying SADS [19,20,26,27]. The integrated solutions to the linear differential equations in Eq. (1) simulate transient populations evolving with single-exponential kinetics.
A sequential EADS model was first used to estimate the underlying ‘apparent’ (i.e., experimentally observed) timescales in the data, an approach we have successfully employed in analyzing ultrafast dynamics of phytochrome-related cyanobacteriochromes [26–28]. Although this approach adequately describes the data with EADS of increasing lifetimes, it does not separate the apparent timescales into the microscopic timescales describing evolution of one microscopic population into another [19,20], which are estimated with a more sophisticated target analysis [26,27].
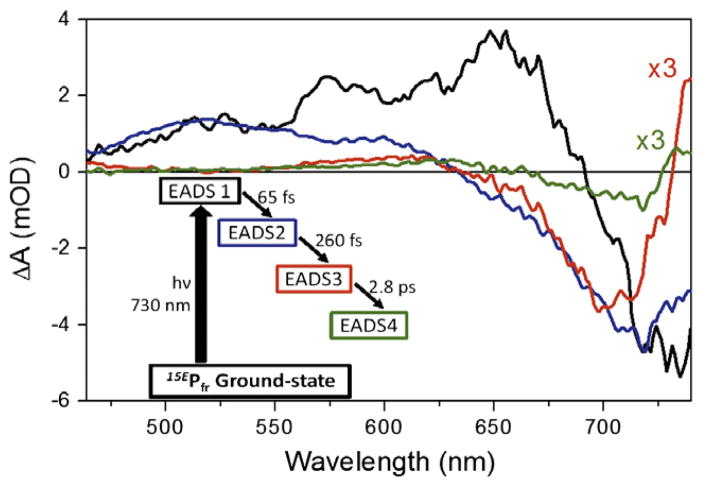
A four component sequential (EADS) model was sufficient to fit the data (Figure 5; simpler models not shown), with sequential lifetimes (EADS1 to EADS4) of 65 fs, 260 fs, 2.8 ps, and ∞ (i.e., significantly longer than 100 ps). For ease of inspection, EADS3 and EADS4 are scaled to 300% for comparison with EADS1 and EADS2. EADS1 (Figure 5, black curve) represents the instantaneously formed FC spectrum; this spectrum rapidly (65 fs) evolves into a relaxed excited-state population represented by EADS2 (Figure 5, blue curve). EADS3 and EADS4 (Figure 5, red and green curves, respectively) are similar to the raw spectra at 1 and 23 ps, respectively (Figure 2B, magenta and orange curves). These later EADS highlight the blue shifting of the positive absorption band at 615 nm with concomitant red-shifting of the negative band from 700 to 720 nm. The near infrared-absorbing band of EADS3 that peaks at 740 nm broadens and depletes to become the permanent positive band peaking at 730 nm in EADS4. The non-decaying EADS4 component corresponds to the Lumi-F primary photoproduct. Spectral evolution from EADS3 and EADS4 occurs on a 2.8-ps timescale. Similar time scales were also reported on Cph1 by Heyne et al. [9] and in other phytochrome systems [10–12].
Figure 5.
Global analysis with a four-component sequential model. The model indicating spectral component and corresponding time scale is draw in the inset. The evolution-associated-difference-spectra (EADS) are drawn with corresponding colors to the model. Both EADS3 and EADS4 are scaled threefold to aid in comparing spectra.
To decompose the reverse reaction signals into individual populations with concentration profiles and SADS, a branched homogeneous target model was constructed (Figure 6A). We assume four populations due to the four phases needed in the sequential model, with the first two phases occurring on the excited-state surface as judged by the presence of ESA (positive signal at 500– 550 nm) in EADS1 and EADS2 and the absence of ESA at later times. The low quantum yield indicates that there must be routes for excited molecules to return to the ground state as well as for the productive formation of Lumi-F, so the evolution associated with EADS3 and EADS4 likely represents this bifurcation. These assumptions lead to a target model with four distinct populations: , HotPfr, and Lumi-F. The apparent decay constants for these populations are 65 fs, 260 fs, 2.8 ps, and ∞, respectively and match those obtained with the sequential EADS analysis (Figure 5, inset). In contrast to previous target analyses of other phytochrome based systems [26–30], the 15EPfr ground-state population is assumed to be homogeneous based on the monophasic excited-state decay kinetics (ignoring evolution out of the FC region). This is in agreement with recent characterization of 15EPfr by resonance Raman intensity analysis and solid-state NMR [8,31].
Figure 6.
(A) Target model of the Cph1 reverse reaction indicating four different spectral components and the reaction pathway with associated time constants. (B) Species-Associated-Difference-Spectra (SADS) of the target model. (C) The concentration profile of each transient population in the model, color coded to Panel B. The E-to-Z isomerization quantum yield (Φ) is fixed at 16% in the model.
The SADS and respective concentration profiles are contrasted in Figure 6B and C, respectively. The relative concentration of HotPfr and Lumi-F is determined by the branching ratio (i.e., 84/16 for HotPfr/Lumi-F in Figure 7) and can be modified by controlling the microscopic time constants (but not the observed apparent timescales). In this analysis, these are fit to 300 fs and 1.6 ps for formation of HotPfr and Lumi-F, respectively (Figure 6). The changing the branching ratio primarily affects the amplitude of SADS as the transient spectrum at certain probe time is defined by linear combination of extinction coefficient of SADS scaled by its concentration:
| (2) |
where c is concentration and ε is extinction coefficient of nth SADS [20]. The isomerization quantum yield (Φ, i.e., final concentration of Lumi-F from Figure 6C) is set at 16% to be consistent with Lamparter and co-workers’ estimation of Φ [14]. This four-population model with corresponding SADS and concentration profiles fit the experimental data well without additional populations or constraints (Figure 3, red curves), although the presence of 15E species that are not resonant with the pump pulse used in this Letter cannot be excluded.
Figure 7.
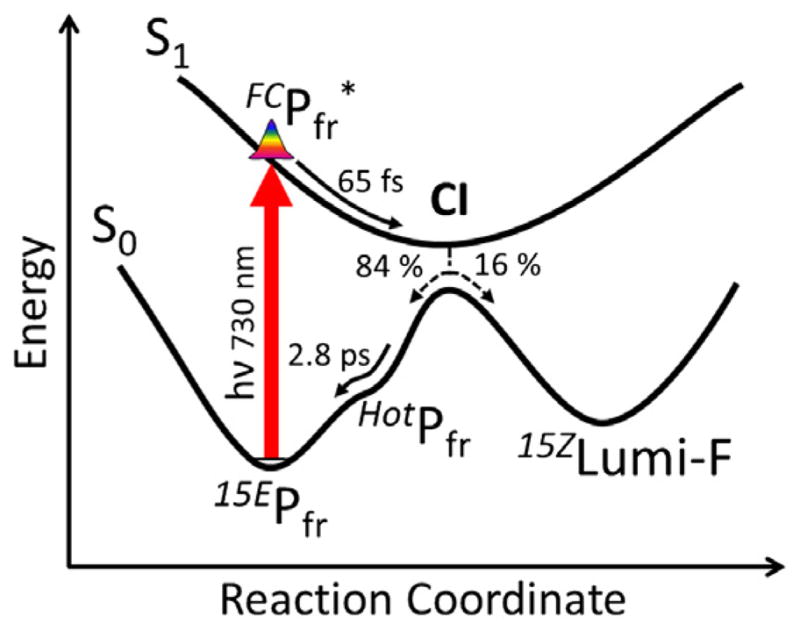
A model potential energy surface diagram representing the Cph1 reverse reaction dynamics in agreement with the target model analysis in Figure 6.
As in the sequential EADS analysis, the population (Figure 6B, black curve) rapidly decays with a 65-fs timescale (Figure 5, black curve) out of the FC excited-state region to form (Figure 6, blue curve). The relaxed excited-state population branches to form either a vibrationally excited ground state population (HotPfr) or the fully isomerized ground state Lumi-F photoproduct. HotPfr decays back to the 15EPfr starting material with a 2.8-ps time constant. The branching ratio was set to 84:16 for HotPfr:Lumi-F. Microscopic time constants for generating HotPfr and Lumi-F were 300 fs and 1.6 ps, respectively. These time constants give an effective 260-fs apparent time constant for the decay of , consistent with the EADS analysis. The HotPfr SADS exhibits a bleach with a near infrared-absorbing band that is red-shifted compared to 15EPfr. In contrast, the Lumi-F SADS has positive absorptions on both the blue and red sides of the bleach. This is in contrast to the Lumi-R photoproduct observed in the forward (Z to E) reaction of Cph1 and, with the exception of the primary photoproduct of PhyA [10], the primary photoproducts observed in all phytochrome systems studied to date [9–11,30]. The SADS (Figure 6B) of each spectral species have comparable amplitudes, which is an indication that the target model and associated kinetic timescales accurately capture the underlying E to Z primary photodynamics [26,27].
5. Discussion
Diller and co-workers first reported the reverse dynamics of Cph1 after 727-nm excitation at three red and NIR probe wave-lengths: 690, 710, and 760 nm, with a ~500-fs time resolution [9]. They observed biphasic dynamics of 540 fs, near instrument resolution, and 3.2 ps. These results were interpreted as the formation and decay of an intermediate state in the isomerization mechanism. The intermediate was proposed to form via rapid quenching on a barrierless excited-state potential energy surface. Holzwarth and co-workers suggested a similar interpretation for the broadband visible TA signals of oat PhyA phytochrome [10], with the initial FC relaxation (150 fs) followed by rapid (500 fs) ballistic formation of the initial photoproduct (termed Ifr750) and subsequent 3-ps formation of an Ifr625 intermediate on the ground-state surface. Both of these studies report multi-phasic kinetic behavior for the phytochrome reverse reaction, but SADS of the proposed intermediates were not estimated.
We present a different interpretation of the slower 2.8-ps dynamics. The multi-phasic kinetics observed here with broadband detection (Figure 5) indicate that multiple spectrally distinct species exist simultaneously within the raw difference spectra, even when the final spectrum is achieved within the experimental delay time (Figure 5, green curve). Moreover, the low quantum yield necessitates a route allowing the excited-state population to return to the starting 15EPfr ground state. These points can be accommodated as shown in Figure 7. The population bifurcates at a conical intersection (CI) to generate Lumi-F (16%) and HotPfr (84%) populations. Since the model is homogeneous, this is the primary source of the low Φ for this reaction. HotPfr decays on a 2.8-ps timescale back to the 15EPfr instead of forming Lumi-F, in contrast to the ‘second chance initiation dynamics’ mechanism resolved in the NpR6012g4 cyanobacteriochrome domain reaction [29].
The HotPfr SADS (Figure 6B, red curve) has an absorption that is red-shifted from 15EPfr, which is a signature of vibrationally hot ground-state species. The existence of vibrationally hot ground-state species is consistent with the fast (260-fs) excited-state quenching to the ground state (Figure 6A), faster than typical vibrational relaxation. The strong spectral signals in the near infrared region of EADS3 (Figure 5, red curve), beyond 725 nm, likely originate from a transition from the hot species back to 15EPfr. A similar vibrationally hot ground state was observed in mid-IR signals of the phytochrome Agp1 from Agrobacterium tumefaciens [12]. The HotPfr population is spectrally distinct from Lumi-F in the blue region compared to bleach (550–650 nm region, Figure 5), where HotPfr does not have any absorption and Lumi-F does. This spectral separation is justified kinetically since Lumi-F persist for the duration of the experiment and HotPfr decays quickly; the 625-nm kinetic trace (Figure 3B) shows the peak of blue-shifted absorption of Lumi-F. The permanent positive amplitude starts as early as 500 fs. If the HotPfr population has an amplitude in this blue-shifted region with 2.8 ps decay lifetime, the positive band would not have the permanent amplitude. On the other hand, at 740-nm probe (Figue 3D), where the HotPfr amplitude is strongest, a distinct amplitude decay on a 2.8 ps timescale is observed.
The Lumi-F SADS is spectrally similar to the final EADS4 of the sequential model, but with a notable difference in amplitude (i.e., at 625 nm, the amplitude is ~0.5 vs. ~0.1 mOD, respectively). This is due to the difference in concentration (Figure 6C for SADS), as the SADS are scaled in accordance with the actual estimated concentration of the species (i.e., 16% for Lumi-F) but the EADS is scaled by 100% (sequential evolution). The amplitude of the Lumi-F, , and SADS are comparable. The similar amplitudes of the estimated SADS from the model suggest that the Φ = 16% value is a reasonable estimate, assuming comparable extinction coefficients of the constituent populations.
As mentioned above in comparison with HotPfr state, the Lumi-F SADS (Figure 6B, green curve) exhibits absorption bands both to the shorter and longer wavelength sides of the bleach. Although a blue-shifted absorption band is also observed in the reverse reaction dynamics of the oat PhyA phytochrome [10], it is not observed in the femtosecond dynamics of other systems. This indicates that the absorption band of Lumi-F is broader than 15EPfr, which may originate from the elongation of the π conjugation system coupled with enhanced vibronic transitions of the chromophore to generate enhanced absorption in the red and blue regions of the Lumi-R population compared to Pr absorption. The red shifted absorption observed in broadband signals were also observed at room temperature by Diller and coworkers [9], although no blue wavelengths were probed in their study. In contrast, evidence that Lumi-F has a broken conjugation is supported by a recent solid-state magic angle spinning NMR study whereby the cryotrapped Lumi-F structure is not fully isomerized and is conformationally strained, which would give rise to blue-shifted photoproduct [32]. However, the temperature effects on Cph1 dynamics and structure can be substantial (manuscript in preparation) suggesting a direct comparison between the cryotrapped structure and room temperature structure may not be applicable.
The recent Raman intensity analysis on 15EPfr study [31] argues for a homogeneous population model with broadened Lumi-F spectrum (Figure 6 and 7). However, the possibility of multiple primary photoproducts cannot be definitively excluded from the pump–probe data (despite the success of the homogeneous model presented here) and blue absorbing and red absorbing photoproducts may be simultaneously photogenerated in the sample. With transient absorption spectroscopy alone, however, conclusive interpretation of whether the Lumi-F population is a homogeneous and spectrally broadened photoproduct or a heterogeneous mixture with partially and fully fully isomerized structures, is difficult to make. Further studies involving either transient fluorescent or vibrational spectroscopy are required to address this question.
To aid in resolving the slower (>100-ps) photodynamics, the Lumi-F EADS spectrum is compared to the 1-ms spectrum and the 15EPr – 15ZPfr difference in Figure 4. The Lumi-F spectrum and 1-ms spectra are qualitatively similar, with overlapping absorption from 450 to 675-nm and a bleach from 675 to 725 nm. However, the 1-ms spectrum is missing the positive 740-nm band observed in the Lumi-F spectrum, which indicates that the Lumi-F spectrum could red-shift on a >100 ps timescale. Alternately, we cannot rule out that EADS4 may consist of two (or more) populations, i.e., both shorter- and longer-wavelength absorbing species, and that the longer wavelength absorbing population decays by 1-ms. Conversion to 15ZPr is clearly not complete within 1 ms after excitation, based on the differences between the 15EPr – 15ZPfr difference and the 1-ms spectrum. For ease of inspection, the 1-ms spectrum is scaled to 60% to overlap with the shorter wavelength absorbing band of EADS4, implying that this band has grown at 1-ms compared to EADS4. The 1-ms spectrum thus could represent a state (or superposition of intermediates) between Lumi-F and 15ZPr, perhaps likely analogous to the Meta-F state [32]. Were the state(s) present at 1 ms to have undergone a blue shift, the loss of the long wavelength-absorbing Lumi-F band by 1 ms would be explained.
Ignoring FC evolution, the 15EPfr→15ZPr excited-state quenching dynamics of Cph1 are considerably faster than those of the primary 15ZPr→15EPfr forward excited-state dynamics (multi-exponential excited-state decay of ~3, 30, and ~150 ps) [9,15,16,18,33]. Faster reverse E→Z excited-state dynamics are also observed in other phytochrome and cyanobacteriochrome systems [10–13,26,27]. While solid-state NMR has resolved two heterogeneous populations of 15ZPr in Cph1, a homogeneous 15EPfr population was observed, in agreement with the target model proposed here [8]. NMR signals from 15EPfr were significantly sharper than those from 15ZPr, implying a more rigid chromophore and hence stronger protein- chromophore interactions for 15EPfr [34]. This is consistent with the picture that the PCB chromophore is structurally more constrained by the protein in 15EPfr state [35]. Photoexcitation of the π to π* transition of the PCB conjugation system then disrupts these interactions, allowing the bilin to relax and resulting in faster quenching dynamics. This rapid evolution generates the primary Lumi-F photoproduct via non-adiabatic internal conversion at a CI (Figure 7). Interestingly, despite comparable excited-state quenching timescales for 15EPfr and rhodopsin, Cph1 has only 20% of the Φ of rhodopsin [36], which results from the detailed excited- state evolution and internal conversion dynamics surrounding the CI [37,38]. Further theoretical studies such as hybrid Quantum Mechanical/Molecular Mechanical (QM/MM) methods will be needed to further characterize this evolution, as will further structural insights into the chromophore conformation of 15EPfr.
6. Concluding comments
The femtosecond photodynamics of the reverse (15EPfr→15ZPr) photoisomerization reaction of the cyanobacterial phytochrome Cph1 from Synechocystis were resolved with visible broadband transient absorption signals. The observed multi-phasic dynamics were assigned to evolution of four populations via global target analysis: (1) a FC excited-state population, , with a 65-fs apparent decay time; (2) a relaxed excited-state population, , with a 260-fs decay time; (3) a red-shifted vibrationally-hot ground-state species, HotPfr, that decays on a 2.8-ps timescale back into the 15EPfr state; and (4) an isomerized Lumi-F photoproduct formed with a 16% quantum yield that persists for the 100-ps duration of the experiment. The rapid excited-state quenching strongly suggests that the excited-state kinetics are barrierless, with both HotPfr and 15ZLumi-F generated rapidly via evolution through a conical intersection residing near the region on the excited-state surface. The Lumi-F difference spectrum exhibits both blue- and red-shifted absorbing bands with respect to the ground-state bleach, indicating significant spectral broadening of the photoproduct. The red-shifted Lumi-R band disappears within 1 ms, but final formation of 15ZPr occurs on a slower timescale.
Acknowledgments
Research reported in this publication was supported by the National Institute of General Medical Sciences of the National Institutes of Health under award number GM068552 to J.C.L. and the Chemical Sciences, Geosciences, and Biosciences Division, Office of Basic Energy Sciences, Office of Science, United States Department of Energy (DOE DE-FG02-09ER16117) to both J.C.L. and D.S.L. The content is solely the responsibility of the authors and does not necessarily represent the official views of the National Institutes of Health or the Department of Energy.
References
- 1.Ulijasz AT, Vierstra RD. Curr Opin Plant Biol. 2011;14:498. doi: 10.1016/j.pbi.2011.06.002. [DOI] [PubMed] [Google Scholar]
- 2.Auldridge ME, Forest KT. Crit Rev Biochem Mol Biol. 2011;46:67. doi: 10.3109/10409238.2010.546389. [DOI] [PubMed] [Google Scholar]
- 3.Moglich A, Yang XJ, Ayers RA, Moffat K. Annu Rev Plant Biol. 2010;61(61):21. doi: 10.1146/annurev-arplant-042809-112259. [DOI] [PubMed] [Google Scholar]
- 4.Franklin KA, Quail PH. J Exp Bot. 2010;61:11. doi: 10.1093/jxb/erp304. [DOI] [PMC free article] [PubMed] [Google Scholar]
- 5.Rockwell NC, Su YS, Lagarias JC. Annu Rev Plant Biol. 2006;57:837. doi: 10.1146/annurev.arplant.56.032604.144208. [DOI] [PMC free article] [PubMed] [Google Scholar]
- 6.Yeh KC, Wu SH, Murphy JT, Lagarias JC. Science. 1997;277:1505. doi: 10.1126/science.277.5331.1505. [DOI] [PubMed] [Google Scholar]
- 7.Essen LO, Mailliet J, Hughes J. Proc Natl Acad Sci USA. 2008;105:14709. doi: 10.1073/pnas.0806477105. [DOI] [PMC free article] [PubMed] [Google Scholar]
- 8.Song C, Psakis G, Lang C, Mailliet J, Gartner W, Hughes J, Matysik J. Proc Natl Acad Sci USA. 2011;108:3842. doi: 10.1073/pnas.1013377108. [DOI] [PMC free article] [PubMed] [Google Scholar]
- 9.Heyne K, Herbst J, Stehlik D, Esteban B, Lamparter T, Hughes J, Diller R. Biophys J. 2002;82:1004. doi: 10.1016/S0006-3495(02)75460-X. [DOI] [PMC free article] [PubMed] [Google Scholar]
- 10.Muller MG, Lindner I, Martin I, Gartner W, Holzwarth AR. Biophys J. 2008;94:4370. doi: 10.1529/biophysj.106.091652. [DOI] [PMC free article] [PubMed] [Google Scholar]
- 11.Bischoff M, Hermann G, Rentsch S, Strehlow D. Biochemistry. 2001;40:181. doi: 10.1021/bi0011734. [DOI] [PubMed] [Google Scholar]
- 12.Schumann C, Gross R, Wolf MMN, Diller R, Michael N, Lamparter T. Biophys J. 2008;94:3189. doi: 10.1529/biophysj.107.119297. [DOI] [PMC free article] [PubMed] [Google Scholar]
- 13.Schumann C, Gross R, Michael N, Lamparter T, Dilier R. ChemPhysChem. 2007;8:1657. doi: 10.1002/cphc.200700210. [DOI] [PubMed] [Google Scholar]
- 14.Lamparter T, Mittmann F, Gartner W, Borner T, Hartmann E, Hughes J. Proc Natl Acad Sci USA. 1997;94:11792. doi: 10.1073/pnas.94.22.11792. [DOI] [PMC free article] [PubMed] [Google Scholar]
- 15.Dasgupta J, Frontiera RR, Taylor KC, Lagarias JC, Mathies RA. Proc Natl Acad Sci USA. 2009;106:1784. doi: 10.1073/pnas.0812056106. [DOI] [PMC free article] [PubMed] [Google Scholar]
- 16.Fitzpatrick AE, Lincoln CN, van Wilderen L, van Thor JJ. J Phys Chem B. 2012;116:1077. doi: 10.1021/jp206298n. [DOI] [PubMed] [Google Scholar]
- 17.vanWilderen L, Clark IP, Towrie M, van Thor JJ. J Phys Chem B. 2009;113:16354. doi: 10.1021/jp9038539. [DOI] [PubMed] [Google Scholar]
- 18.van Thor JJ, Ronayne KL, Towrie M. J Am Chem Soc. 2007;129:126. doi: 10.1021/ja0660709. [DOI] [PubMed] [Google Scholar]
- 19.Holzwarth AR. In: Biophysical Techniques in Photosynthesis. Amesz J, Hoff AJ, editors. Springer; Netherlands: 1996. pp. 75–92. [Google Scholar]
- 20.van Stokkum IHM, Larsen DS, van Grondelle R. Biochim Biophys Acta Bioenerg. 2004;1657:82. doi: 10.1016/j.bbabio.2004.04.011. [DOI] [PubMed] [Google Scholar]
- 21.Fischer AJ, Lagarias JC. Proc Natl Acad Sci USA. 2004;101:17334. doi: 10.1073/pnas.0407645101. [DOI] [PMC free article] [PubMed] [Google Scholar]
- 22.Shu XK, Royant A, Lin MZ, Aguilera TA, Lev-Ram V, Steinbach PA, Tsien RY. Science. 2009;324:804. doi: 10.1126/science.1168683. [DOI] [PMC free article] [PubMed] [Google Scholar]
- 23.Moeglich A, Moffat K. Photochem Photobiol Sci. 2010;9:1286. doi: 10.1039/c0pp00167h. [DOI] [PubMed] [Google Scholar]
- 24.Drepper T, Krauss U, Berstenhorst SMZ, Pietruszka J, Jaeger K-E. Appl Microbiol Biotechnol. 2011;90:23. doi: 10.1007/s00253-011-3141-6. [DOI] [PubMed] [Google Scholar]
- 25.Levskaya A, Weiner OD, Lim WA, Voigt CA. Nature. 2009;461:997. doi: 10.1038/nature08446. [DOI] [PMC free article] [PubMed] [Google Scholar]
- 26.Kim PW, Freer LH, Rockwell NC, Martin SS, Lagarias JC, Larsen DS. Biochemistry. 2012;51:608. doi: 10.1021/bi201507k. [DOI] [PubMed] [Google Scholar]
- 27.Kim PW, Freer LH, Rockwell NC, Martin SS, Lagarias JC, Larsen DS. Biochemistry. 2012;51:619. doi: 10.1021/bi2017365. [DOI] [PubMed] [Google Scholar]
- 28.Freer LH, Kim PW, Corley SC, Rockwell NC, Zhao L, Thibert AJ, Lagarias JC, Larsen DS. J Phys Chem B. 2012 doi: 10.1021/jp302637u. in press. [DOI] [PubMed] [Google Scholar]
- 29.Kim PW, Freer LH, Rockwell NC, Martin SS, Lagarias JC, Larsen DS. J Am Chem Soc. 2012;134:130. doi: 10.1021/ja209533x. [DOI] [PMC free article] [PubMed] [Google Scholar]
- 30.Toh KC, Stojkovic EA, van Stokkum IHM, Moffat K, Kennis JTM. Proc Natl Acad Sci USA. 2010;107:9170. doi: 10.1073/pnas.0911535107. [DOI] [PMC free article] [PubMed] [Google Scholar]
- 31.Spillane KM, Dasgupta J, Mathies RA. Biophys J. 2012;102:709. doi: 10.1016/j.bpj.2011.11.4019. [DOI] [PMC free article] [PubMed] [Google Scholar]
- 32.Rohmer T, et al. J Am Chem Soc. 2010;132:9219–19. doi: 10.1021/ja9108616. [DOI] [PubMed] [Google Scholar]
- 33.Yang Y, et al. J Am Chem Soc. 2012;134:1408. doi: 10.1021/ja209413d. [DOI] [PubMed] [Google Scholar]
- 34.Song C, et al. Biochemistry. 2011;50:10987. doi: 10.1021/bi201504a. [DOI] [PubMed] [Google Scholar]
- 35.Rohmer T, Lang C, Hughes J, Essen LO, Gartner W, Matysik J. Proc Natl Acad Sci USA. 2008;105:15229. doi: 10.1073/pnas.0805696105. [DOI] [PMC free article] [PubMed] [Google Scholar]
- 36.Kim JE, Tauber MJ, Mathies RA. Biochemistry. 2001;40:13774. doi: 10.1021/bi0116137. [DOI] [PMC free article] [PubMed] [Google Scholar]
- 37.Levine BG, Martinez TJ. Annu Rev Phys Chem. 2007:613. doi: 10.1146/annurev.physchem.57.032905.104612. [DOI] [PubMed] [Google Scholar]
- 38.Schapiro I, Melaccio F, Laricheva EN, Olivucci M. Photochem Photobiol Sci. 2011;10:867. doi: 10.1039/c0pp00290a. [DOI] [PubMed] [Google Scholar]


