

Abstract
Background
Phenethyl isothiocyanate (PEITC) is a natural plant compound with chemopreventative potential against some cancers and the ability to induce apoptosis in breast cancer cells.
Methods
Female mouse mammary tumor virus–neu mice were fed a control AIN-76A diet (n = 35) or the same diet supplemented with 3 µmol PEITC/g diet (n = 33) for 29 weeks, at which time they were killed. Breast tissue sections were stained with hematoxylin and eosin for histopathological assessments, and incidence and size of macroscopic mammary tumors were assessed. Cell proliferation (Ki-67 staining), apoptosis (terminal deoxynucleotidyl transferase–mediated dUTP nick-labeling), and neoangiogenesis (CD31 staining) were determined in tumor sections. Plasma levels of transthyretin were measured in treated and control mice. Expression of proteins in mammary tumor sections was determined by immunohistochemistry. Proteomic profiling was performed by two-dimensional gel electrophoresis followed by mass spectrometry. All statistical tests were two-sided.
Results
Administration of PEITC for 29 weeks was associated with 53.13% decreased incidence of macroscopic mammary tumors (mean tumor incidence, PEITC-supplemented diet vs control diet, 18.75% vs 40.00%, difference = –21.25%, 95% confidence interval [CI] = –43.19% to 0.69%, P = .07) and with a 56.25% reduction in microscopic mammary carcinoma lesions greater than 2mm2 (mean incidence, PEITC-supplemented diet vs control diet, 18.75% vs 42.86%, difference = –24.11%, 95% CI = –46.35% to –1.86%, P = .04). PEITC-mediated mammary cancer growth inhibition was not because of suppression of human epidermal growth factor receptor-2 expression but was associated with reduced cellular proliferation and neoangiogenesis, increased apoptosis, and altered expression of several proteins, including decreased ATP synthase in the tumor and increased plasma levels of transthyretin.
Conclusions
PEITC inhibits the growth of mammary cancers in a mouse model with similarities to human breast cancer progression. ATP synthase and transthyretin appear to be novel biomarkers associated with PEITC exposure.
Novel approaches for chemoprevention of breast cancer are clinically attractive because many risk factors associated with this disease (eg, genetic predisposition, late-age at first full-term pregnancy, early menarche, and late menopause) are not easily modifiable (1–3). Breast cancer continues to be a leading cause of cancer-related death in women worldwide (4) despite tremendous advances towards targeted therapies and personalized medicine (5,6). Primary prevention of breast cancer is feasible considering successful clinical application of selective estrogen receptor modulators (eg, tamoxifen and raloxifene) (7,8). However, this strategy is ineffective against estrogen receptor–negative breast cancers, and it is associated with risk of rare but serious side effects, including increased risk of uterine cancer, thromboembolism, cataracts, and perimenopausal symptoms (7,8). Use of the aromatase inhibitor (AI) exemestane is now an effective strategy for prevention of breast cancer in postmenopausal women (9,10). Although long-term effects of AIs are still under study, their use raises concerns for potential for increased cardiovascular risk (10,11). For example, combined analysis of multiple randomized controlled trials comparing AIs with tamoxifen reveals higher incidence of grade 3 and 4 cardiovascular events associated with use of AIs (10,11). Increased risk of bone fracture is another potential adverse effect of AIs (10).
Edible plants continue to gain traction in the ongoing search for novel chemopreventative agents (12,13). Phenethyl isothiocyanate (PEITC) is one such promising bioactive component of edible cruciferous vegetables (eg, watercress). PEITC occurs naturally as a thioglucoside conjugate, gluconasturtiin (14,15), and is produced by myrosinase-catalyzed hydrolytic breakdown of gluconasturtiin upon processing (cutting or chewing) of cruciferous vegetables (14). The anticancer potential of PEITC was initially recognized by Wattenberg, who showed that 7,12-dimethylbenz[a]- anthracene–induced mammary cancer development was inhibited in Sprague-Dawley rats that were administered PEITC 4 hours before challenge with the carcinogen (16). Likewise, administration of PEITC inhibited N-nitrosobenzylmethylamine–induced esophageal carcinogenesis in rats (17). More recent studies have now established the efficacy of PEITC as a chemopreventative agent in transgenic mouse models of colon or intestinal cancer or of prostate cancer (18,19).
Successful clinical realization of a cancer chemopreventative strategy is contingent upon systematic investigations: from “flask”-based cellular studies to identify promising agents and to define the mechanisms of their action; to “fur”(animal)-based studies focusing not only on bioavailability, safety, and efficacy assessments but also on discovery of biomarker(s) associated with response; to “folks” in clinical trials, with a pilot biomarker modulation trial followed by larger studies with cancer incidence as the primary endpoint. The discovery of biomarkers associated with response is especially desirable for cancer chemopreventative agents because cancer incidence is too rigorous an endpoint for cancers with long latency, such as breast cancer. Previous studies from our laboratory have shown that PEITC treatment, in association with apoptosis induction, decreases viability of cancer cells, including BRI-JM04, a breast cancer cell line derived from a mammary tumor in a mouse mammary tumor virus–neu (MMTV-neu) transgenic mouse (20,21). By contrast, MCF-10A cells, a spontaneously immortalized and nontumorigenic human mammary epithelial cell line derived from a patient with fibrocystic breast disease, are substantially more resistant than breast cancer cells to PEITC-induced apoptosis (21). PEITC-induced apoptosis in BRI-JM04 cells is regulated by B-cell lymphoma 2 interacting mediator of cell death (Bim) (21).
These in vitro observations prompted us to test PEITC-mediated mammary cancer chemoprevention in mice, with two objectives: 1) to determine in vivo efficacy of dietary PEITC administration for chemoprevention of breast cancer using MMTV-neu model, which not only faithfully recapitulates aspects of human disease progression but also mimics human epidermal growth factor receptor-2 (HER-2/neu) overexpression and amplification in a subset of human breast cancers (22–24), and 2) to identify biomarker(s) associated with PEITC exposure that could be potentially useful in future clinical investigations.
Materials and Methods
Reagents
PEITC (purity ≥98%) was purchased from LKT Laboratories (St Paul, MN). Hematoxylin and eosin stain was purchased from Anatech Limited (Battle Creek, MI). A mouse monoclonal anti-HER-2 antibody (e2-4001 + 3B5, 1:25 dilution) was purchased from Thermo Fisher Scientific (Rockford, IL). Rat monoclonal anti-Ki-67 antibody (TEC-3, 1:50 dilution) was purchased from Dako (Carpinteria, CA). Polyclonal goat anti-CD31 (also known as platelet or endothelial cell adhesion molecule 1; M-20, 1:750 dilution) antibody, polyclonal rabbit anti-transferrin antibody (H-65, 1:50 dilution), and mouse monoclonal anti-Bcl-xL antibody (H-5, 1:50 dilution) were purchased from Santa Cruz Biotechnology (Santa Cruz, CA). Rabbit polyclonal antibody specific for detection of Ser65-phosphorylated Bim (1:100 dilution) was purchased from GenWay (San Diego, CA). Polyclonal rabbit anti-WD repeat containing protein-1 (WDR1) antibody (1:200 dilution) was purchased from Novus Biologicals (Littleton, CO). Polyclonal rabbit anti-ATP synthase (also known as ATPB or ATP5B) antibody (1:200 dilution) and polyclonal rabbit anti-Annexin A4 (Annexin 4) antibody (1:1000 dilution) were purchased from Abcam (Cambridge, MA). ApopTag Plus Peroxidase In Situ Apoptosis Kit (Cat. No. S7101) for terminal deoxynucleotidyl transferase–mediated dUTP nick-labeling (TUNEL) was purchased from Millipore Corporation (Billerica, MA). Mouse transferrin (Cat. No. KT-348) and mouse transthyretin (also known as prealbumin; Cat. No. KT-537) enzyme-linked immunosorbent assay (ELISA) kits were purchased from Kamiya Biomedical Company (Seattle, WA).
Randomization and PEITC Administration
This study was approved by the Institutional Animal Care and Use Committee. Female MMTV-neu mice (4–5 weeks old) were purchased from The Jackson Laboratory (Bar Harbor, ME) and acclimated for 2 weeks before treatment. Mice were placed either on a control AIN-76A diet (n = 35) or AIN-76A diet supplemented with PEITC (3 µmol PEITC/g diet; n = 33). Both diets were prepared by Harlan-Teklad (Indianapolis, IN). Based on a previously published study from our laboratory (25), we estimated that using 28 mice per group would provide 80% power to detect a 40% difference in carcinoma incidence between groups at the .05 level of statistical significance. The food was replenished every 3–4 days at the time of cage changes. Body weights and food consumptions were recorded once a week. Mice were killed by carbon dioxide inhalation followed by cervical dislocation at 35–36 weeks of age, after 29 weeks of treatment. Initially, we had planned to terminate the experiment after 25 weeks of PEITC treatment based on our past experience with this model (25). Because incidence of palpable (macroscopic) tumors in the PEITC treatment group was less than that of control group, the study was extended by 4 weeks (29 weeks of treatment). It is important to point out that this change in plan did not create a bias because the incidence and burden of both macroscopic and microscopic cancer lesions were scored, and data on microscopic cancer was not available before the mice were killed. One mouse from the PEITC group died prematurely after the appearance of dehydration and bloody stool.
Determination of PEITC Levels in Plasma and Breast Tissues
We determined PEITC concentrations in the plasma of mice on the control diet (n = 5) and of mice on the PEITC-supplemented diet (n = 4) and in normal and cancerous breast tissues of these mice (n = 5 for both groups) as we described previously (19). We were limited by the amount of tumor tissue, especially from the mice on the PEITC-supplemented diet, for these measurements. Specifically, only six mice on the PEITC-supplemented diet had macroscopic tumors to allow analysis of the PEITC level. Nevertheless, we selected weight-matched tumor specimens from five mice of each group for the determination of PEITC levels (PEITC-supplemented diet vs control diet, mean tumor weight = 0.97 vs 0.75g, difference = 0.23g, 95% CI = –1.05 to 1.50g, P = .65 by two-sided Student’s t test). Standard curves prepared by addition of PEITC to control breast tissue homogenates were linear over the range of 6–10 000nM and displayed acceptable performance. (The accuracy of at least 14 of 16 calibrators was within 15% of the nominal concentrations; and more than four of six plasma quality control samples at 18, 200, and 8000nM were within 15% of the nominal concentrations.) PEITC was detected with a Quattromicro quadruple mass spectrometer (Waters, Milford, MA) with electrospray ionization in positive-ion mode, monitoring mass to charge (m/z) ratios of 181.2–105.0 for PEITC and 186.2–110.0 for [D5]-PEITC (internal standard). The addition of a fixed amount of [D5]-PEITC to calibration and study samples allowed normalization of the mass spectrometry signal. The PEITC/[D5]-PEITC ratios were regressed against nominal concentrations and were used to back-calculate PEITC concentrations in the study samples.
Histopathological Analysis, Immunohistochemistry, and TUNEL Assay
Hematoxylin and eosin–stained sections were blindly examined by two investigators for the incidence of mammary hyperplasia or carcinoma and for the size of the carcinomas. Hyperplasia was characterized by thick and multilayered ducts, whereas carcinoma was defined by the loss of ductal structures and the presence of enlarged cells and nuclei. Immunohistochemistry was performed by a standard protocol that we described previously (19,25). Briefly, tissues were sectioned at 4–5 µm thickness, deparaffinized, and rehydrated. The sections were then quenched with 3% hydrogen peroxide and blocked with normal goat serum (Dako) diluted 1:67 in Tris-buffered saline (50mM Tris–HCl, 150mM NaCl, 0.05% Tween-20, pH 7.6) in a moist chamber at room temperature for 30 minutes. The sections were incubated for 60 minutes at room temperature with the desired primary antibody (anti-HER-2, anti-Ki-67, anti-CD31, anti-pBim, anti-Bcl-xL, anti-WDR1, anti-transferrin, anti-ATP synthase, or anti-annexin A4; antibody concentrations given above) in phosphate-buffered saline-based antibody diluent with background-reducing components (Dako, Cat. No. S3022) and washed with Tris-buffered saline three times, 5 minutes each at room temperature, followed by incubation for 30 minutes at room temperature with appropriate biotinylated secondary antibody (ready-to-use LSAB2 horseradish peroxidase–conjugated streptavidin; Dako, Cat. No. K1016). A characteristic brown color was developed using 3,3ʹ-diaminobenzidine. The sections were examined under a Leica DC300F microscope at ×200 magnification. At least five nonoverlapping representative images were captured from each section, and images were analyzed using Image ProPlus 5.0 software (Media Cybernetics, Bethesda, MD) or Aperio ImageScope v 9.1 software (Aperio Technologies, Vista, CA). Apoptotic bodies in the tumor sections were visualized by TUNEL staining according to the manufacturer’s protocol (Millipore Corporation). The TUNEL-positive apoptotic bodies were quantified using Aperio ImageScope software.
Two-Dimensional Gel Electrophoresis and Mass Spectrometry
The PEITC-mediated alterations in levels of plasma and tumor proteins were determined by two-dimensional gel electrophoresis followed by MALDI-TOF/TOF by Applied Biomics (Hayward, CA). Weight-matched tumor tissues from three mice, each on control diet and PEITC-supplemented diet, were used for proteomics analyses (PEITC-supplemented diet vs control diet, mean tumor weight = 1.09 vs 0.83g, difference = 0.26g, 95% CI = –0.52 to 1.04g, P = .29 by two-sided Student’s t test). The sample size for the proteomics profiling was based on availability of tissue specimens and our previous experience and success with similar work in a preclinical model of prostate cancer using plasma from three mice per group (19). Briefly, plasma and 10% (wt/vol) tumor supernatants were thawed, vortexed for 20 seconds, and centrifuged at 12 000g for 30 minutes at 4°C. The supernatant fraction (1 µL) was mixed with 5 µL of lysis buffer consisting of 7mM urea, 2mM thiourea, 4% CHAPS, and 30mM Tris–HCl (pH 8.5) and then labeled with 1 µL of diluted CyDye (1:5 dilution; GE Healthcare, Piscataway, NJ). Labeled samples were mixed by vortexing and incubated on ice in the dark for 30 minutes followed by addition of 1 µL of 10mM lysine. Samples were vortexed again and incubated in the dark on ice for an additional 15 minutes. The Cy2-, Cy3-, and Cy5-labeled samples were then mixed with sample buffer (8M urea, 4% CHAPS, 20mg/mL dithiothreitol, 2% pharmalytes, and trace amount of bromophenol blue) and subjected to rehydration to 250 µL for the 13-cm immobilized pH gradient strip. Isoelectric focusing was performed in the dark at 20°C. Immediately after sodium dodecyl sulfate–polyacrylamide gel electrophoresis using 13.5% gels, the images were scanned with the use of Typhoon TRIO (GE Healthcare), analyzed with the use of Image Quant software (version 5.0; GE Healthcare), and subjected to in-gel analysis and cross-gel analysis with the use of DeCyder software (version 6.0; GE Healthcare). Selected spots were identified by the Ettan Spot Picker (GE Healthcare) following DeCyder software analysis and spot picking criteria selection. Selected proteins were subjected to in-gel trypsin digestion, peptide extraction, and desalting followed by MALDI-TOF/TOF to identify the protein. The cutoff criteria for the spot selection and protein identification were 1.3-fold difference in spot intensity (ratio of PEITC treatment group to control group) and a P value of .1 or less for both tumor and plasma proteomics profiling (two-sided Student’s t test). Some spots were not subjected to MALDI-TOF/TOF because their close proximity to other spots suggested that they may be isoform(s) of the same protein. For example, 24 spots from the two-dimensional gel electrophoresis of the breast tumor lysates adhered to the above cutoff criteria (a 1.3-fold difference in intensity and a P ≤ .1). Of these 24 spots, only 18 were subjected to mass spectrometry for protein identification (Table 2). Spots 3–4, 6–8, and 10 were not subjected to mass spectrometry because of their close proximities to spot 2 (transferrin), spot 5 (long-chain fatty acid CoA ligase 4 isoform 1), and spots 9 and 11 (both representing calreticulin precursor; Table 2), respectively. Of the 48 plasma spots that met the above mentioned cutoff criteria, only 17 spots were selected for protein identification by mass spectrometry.
Table 2.
Proteins altered in response to phenethyl isothiocyanate (PEITC) treatment in the tumors of mouse mammary tumor virus–neu mice
| Protein name | Master No. | Protein ID | Ratio of protein abundance, PEITC vs control* | P† |
|---|---|---|---|---|
| Hexokinase 1, isoform CRA_f (Mus musculus) | 234 | 1 | 1.36 | .05 |
| Transferrin (Mus musculus) | 418 | 2 | 1.49 | .09 |
| Long-chain fatty acid CoA ligase 4 isoform 1 (Mus musculus) | 391 | 5 | 1.46 | .08 |
| Calreticulin precursor (Mus musculus)‡ | 521 | 9 | –1.45 | .07 |
| Calreticulin precursor (Mus musculus)‡ | 560 | 11 | –1.50 | .01 |
| Unnamed protein product (Mus musculus) | 675 | 12 | –1.40 | .05 |
| WD repeat domain 1 (Mus musculus) | 504 | 13 | –1.31 | .09 |
| Fibrinogen beta chain precursor (Mus musculus) | 642 | 14 | –1.47 | .06 |
| α-Fetoprotein (Mus musculus) | 739 | 15 | –1.31 | .06 |
| Pyruvate kinase isozymes M1/M2 (Mus musculus) | 639 | 16 | –1.33 | .09 |
| Truncated form platelet-activating factor acetylhydrolase 45-kD subunit (Mus musculus) | 842 | 17 | –1.44 | .02 |
| mCG10591, isoform CRA_b (Mus musculus) | 906 | 18 | –1.43 | .05 |
| L-lactate dehydrogenase A chain isoform 1 (Mus musculus) | 1158 | 19 | 1.57 | .08 |
| Annexin A4 (Mus musculus) | 1208 | 20 | –1.42 | .10 |
| Delta(3,5)-delta(2,4)-dienoyl-CoA isomerase, mitochondrial precursor (Mus musculus) | 1281 | 21 | –1.32 | .08 |
| Chain B, from crystal structure of hemoglobin at 2.8 Å (Mus Musculus) | 1537 | 22 | 1.37 | .07 |
| 3-Hydroxyacyl-CoA dehydrogenase type-2 (Mus Musculus) | 1517 | 23 | 1.37 | .05 |
| Mitochondrial ATP synthase, H+ transporting F1 complex beta subunit (Mus musculus) | 2027 | 24 | –1.38 | .10 |
* Tumor specimens were from mice fed either control diet or 3 µmol PEITC/g diet (n = 3 mice per group).
† All P values were calculated by two-sided Student’s t tests.
‡ The protein spots likely represent isoforms or posttranslational modification(s) of the same protein.
Determination of Transferrin and Transthyretin in Plasma
Transferrin and transthyretin levels in the plasma of mice that had been placed on control diet (n = 5) and PEITC-supplemented diet (n = 5) were determined with the use of a mouse transferrin ELISA kit (Cat. No. KT-348) and a mouse transthyretin ELISA kit (Cat. No. KT-537) as recommended by the manufacturer (Kamiya Biomedical Company).
Statistical Analysis
Statistical significance of differences in body weight, food consumption, multiplicity of hyperplastic lesions, macroscopic tumor volume, microscopic tumor area, biological correlates (eg, HER-2, Ki-67, ATP synthase expression), and plasma transferrin and transthyretin levels was assessed by two-sided Student’s t tests. Statistical significance of differences in hyperplasia and tumor incidence was determined by two-sided Fisher’s exact tests. Results are shown as means with 95% confidence intervals (CIs). Differences were considered statistically significant at P values of .05 or less. All statistical analyses were performed using GraphPad Prism v.4.03 software (GraphPad Software, La Jolla, CA).
Results
Body Weight, Food Consumption, and Plasma and Tissue Levels of PEITC
At 1–4 weeks and at 7 weeks of treatment, the average body weights of mice that were placed on the PEITC-supplemented diet were modestly but statistically significantly higher than those of mice placed on the control diet, but this difference was reduced at later time points (Figure 1, A). The amount of food consumption did not differ between mice that were given the control diet vs the PEITC-supplemented diet (Figure 1, B). PEITC was detected in the plasma of mice placed on PEITC-supplemented diet (mean concentration = 901nM, 95% CI = 741 to 1060nM, n = 4) but not in the plasma of mice placed on the control diet (n = 5) (Figure 1, C). Normal mammary tissues and breast tumors were also analyzed for PEITC levels. Similar to our findings with plasma, PEITC was not detectable in the normal mammary tissue or breast tumors of mice placed on the control diet (n = 5). Interestingly, the concentration of PEITC in the normal mammary tissue (mean = 363 nmol/kg, 95% CI = 246 to 480 nmol/kg, n = 5) was higher than that in breast tumor tissue (mean = 87 nmol/kg, 95% CI = 67 to 107 nmol/kg, n = 5) of mice that were given the PEITC-supplemented diet (Figure 1, C). Collectively, these results indicated that: 1) PEITC administration did not result in weight loss in mice, and 2) steady-state levels of PEITC were detectable in both plasma and tumors of mice placed on the PEITC-supplemented diet.
Figure 1.
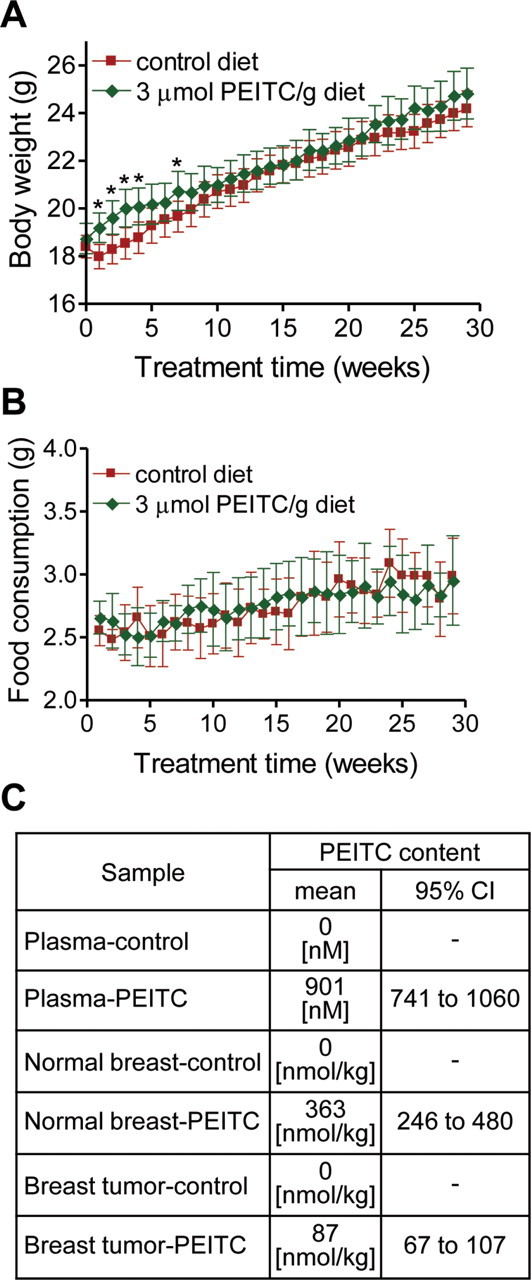
Body weights and food consumptions in mouse mammary tumor virus (MMTV)–neu mice. Female mice that were 6–7 weeks of age were placed on an AIN-76A diet with or without 3 µmol/g phenethyl isothiocyanate (PEITC). A) Body weights over time of MMTV-neu mice that were placed on the control diet or the PEITC-supplemented diet. Mean body weights and their 95% confidence intervals (error bars) are shown (for mice on the control diet, n = 35; for mice on the PEITC-supplemented diet, n = 33 at weeks 1–17 and n = 32 at weeks 18–29 [because one mouse placed on the PEITC-supplemented diet died]). Asterisks denote statistically significant differences (P < .05) compared with the control diet by two-sided Student’s t test. B) Food consumption over time by mice placed on the control diet or the PEITC-supplemented diet. Mean food consumptions and their 95% confidence intervals (error bars) are shown (for mice on the control diet, n = 35; for mice on the PEITC-supplemented diet, n = 33 at weeks 1–17 and n = 32 at weeks 18–29). C) Levels of PEITC in the plasma (n = 5 for mice on the control diet and n = 4 for mice on the PEITC-supplemented diet) and normal mammary tissue (n = 5 for both groups) or breast tumor (n = 5 for both groups) of mice placed on the control diet or the PEITC-supplemented diet.
Effect of Dietary PEITC Administration on Multiplicity of Hyperplastic Mammary Lesions and on Incidence of Carcinomas
The incidence of mammary hyperplasia was 100% in mice given either diet. The histopathology of mammary carcinoma lesions from both groups was similar (Figure 2, A). There were 26.76% fewer hyperplastic mammary lesions in mice placed on the PEITC-supplemented diet compared with mice placed on the control diet (mean number of hyperplastic lesions with PEITC-supplemented diet vs control diet, 61.06 vs 83.37 lesions, difference = –22.31 hyperplastic lesions, 95% CI = –52.65 to 8.04 hyperplastic lesions, P = .15 by two-sided Student’s t test), but the difference did not reach statistical significance. The incidence of macroscopic (visible) tumors in mice placed on the PEITC-supplemented diet was 53.13% less than in mice placed on the control diet (mean percentage of mice with visible tumors with PEITC-supplemented diet vs control diet, 18.75% vs 40.00%, difference = –21.25%, 95% CI = –43.19% to 0.69%, P = .07 by two-sided Fisher’s exact test; Figure 2, B). The incidence of microscopic tumors greater than 2mm2 in size and less than 137mm2 in size was 56.25% less in mice that were fed the PEITC-supplemented diet compared with mice that were fed the control diet (percentage of mice with microscopic tumors, PEITC-supplemented diet vs control diet, 18.75% vs 42.86%, difference = –24.11%, 95% CI = –46.35% to –1.86%, P = .04 by two-sided Fisher’s exact test; Figure 2, B). The incidence of microscopic tumors that were less than 2mm2 in size was 2.55-fold greater in mice that were fed the PEITC-supplemented diet compared with mice fed the control diet, but the difference was statistically insignificant (P = .18 by two-sided Fisher’s exact test; Figure 2, B). The size of the macroscopic and microscopic carcinoma lesions did not differ between mice placed on the control diet and the PEITC-supplemented diet (Figure 2, C). Collectively, these results indicated that PEITC administration delayed cancer progression in MMTV-neu mice.
Figure 2.
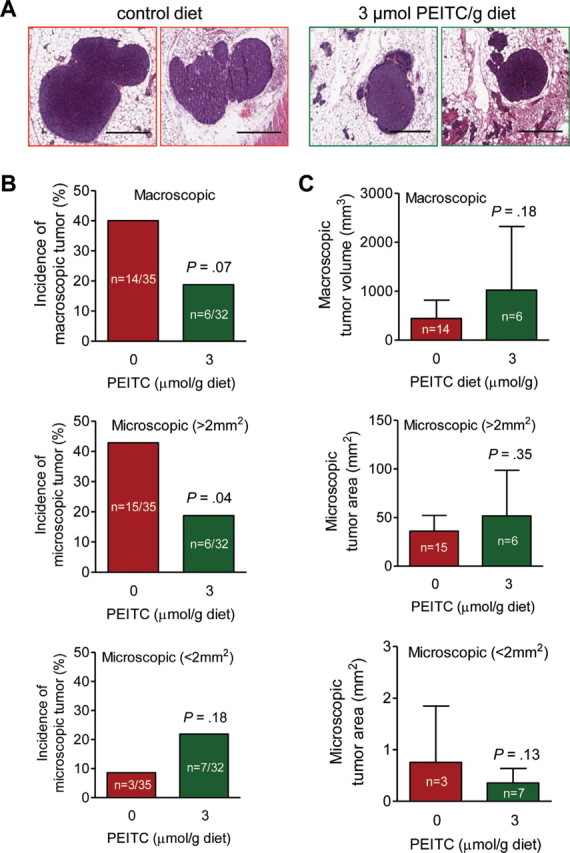
Effect of phenethyl isothiocyanate (PEITC) administration on mammary carcinoma incidence and burden. Female mouse mammary tumor virus–neu mice spontaneously developed mammary tumors especially in the presence of control diets not supplemented with PEITC. Incidence and size of tumors were recorded, and tumors were resected for pathological analysis. A) Hematoxylin and eosin–stained sections depicting mammary carcinomas in representative mice fed the control or PEITC-supplemented diet (×200 magnification, scale bars = 40 µm). B) Incidence of tumors of different sizes. Results represent the mean percentage of mice with macroscopic tumors, microscopic tumors greater than 2mm2 in size, and microscopic tumors less than 2mm2 in size at the time that the mice were killed (after 29 weeks of PEITC treatment). P value was calculated by two-sided Fisher’s exact test. C) Relative tumor sizes. Results represent the mean tumor volumes of macroscopic tumors (mm3) and the tumor areas of microscopic tumors greater than 2mm2 and microscopic tumors less than 2mm2 with their corresponding 95% confidence intervals (error bars). Statistical significance of differences was determined by two-sided Student’s t tests.
Effect of PEITC Administration on HER-2 Expression, Cell Proliferation, Apoptosis Induction, and Angiogenesis in Tumor Tissue
To consider whether the PEITC-mediated delay in mammary carcinoma progression might be attributable to suppression of HER-2 transgene expression, we performed immunohistochemistry to determine expression of HER-2 in the tumors of mice placed on the control diet vs the PEITC-supplemented diet. The multiplicity of HER-2–positive cells in the tumors of mice placed on the control diet and the PEITC-supplemented diet was comparable (mean number of HER-2–positive cells per high power field, PEITC-supplemented diet vs control diet, 2959 vs 3311 cells, difference = –352 cells, 95% CI = –1221.00 to 516.50 cells, P = .35, n = 6; Figure 3, A). Because in vitro studies had revealed that PEITC treatment inhibits growth of breast cancer cells by causing apoptosis (21), we proceeded to determine whether PEITC administration resulted in suppression of cell proliferation and/or apoptosis induction in the tumor. We first compared the number of Ki-67–positive cells, a measure of cell proliferation, using immunohistochemistry (Figure 3, B). The multiplicity of Ki-67–positive cells was 38.65% less in the tumors of mice placed on the PEITC-supplemented diet (n = 11) than in the tumors of mice placed on the control diet (n = 16) (mean number of Ki-67–positive cells per high power field, PEITC-supplemented diet vs control diet, 307.90 vs 501.90 Ki-67–positive cells, difference = –194.00 Ki-67–positive cells, 95% CI = –317.00 to –71.04 Ki-67–positive cells, P = .003 by two-sided Student’s t test). Moreover, consistent with the results of cellular studies (21), the multiplicity of TUNEL-positive bodies (depicted in Figure 3, C) was 16.04-fold greater in the tumors from mice that were fed the PEITC-supplemented diet (n = 10) than in tumors from mice that were fed the control diet (n = 16) (mean number of TUNEL-positive bodies per high power field, mice fed PEITC vs control diet, 527.10 vs 32.87 TUNEL-positive bodies, difference = 494.23 TUNEL-positive bodies, 95% CI = 302.70 to 685.80 TUNEL-positive bodies, P < .001 by two-sided Student’s t test). We have shown previously that PEITC treatment inhibits neoangiogenesis in vitro and ex vivo (26). To determine the effect of PEITC administration on in vivo angiogenesis, we performed immunohistochemistry with anti-CD31 antibody to visualize blood vessels (Figure 3, D). The number of blood vessels in the tumors of mice placed on the PEITC-supplemented diet (n = 11) was 23.95% less than in the tumors of mice placed on the control diet (n = 16) (number of blood vessels per high power field, PEITC-supplemented diet vs control diet, 42.89 vs 56.40 vessels, difference = –13.51 blood vessels, 95% CI = –27.29 to 0.28 blood vessels, P = .05). These results provided in vivo evidence that PEITC mediated inhibition of cell proliferation, angiogenesis, and apoptosis induction in the tumor, and that PEITC-mediated inhibition of mammary carcinoma development was not because of suppression of HER-2 expression.
Figure 3.
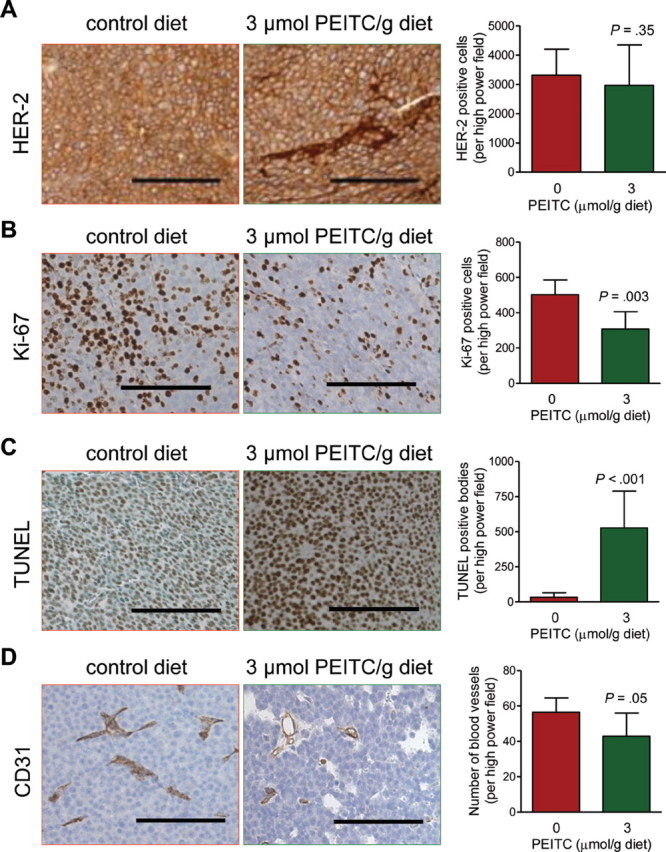
Effects of phenethyl isothiocyanate (PEITC) administration on human epidermal growth factor receptor-2 (HER-2) expression, Ki-67 expression, terminal deoxynucleotidyl transferase–mediated dUTP nick-labeling (TUNEL)–positive bodies, and blood vessels in the tumors of mouse mammary tumor virus–neu mice. A) HER-2 expression in tumors of representative mice placed on the control diet or the PEITC-supplemented diet. Immunohistochemical staining was performed with anti-HER2 antibody (×200 magnification, scale bars = 100 µm). Results represent mean HER-2–positive cells per high power field (n = 6 mice per group, P = .35 by two-sided Student’s t test) with their 95% confidence intervals (error bars). B) Cell proliferation in tumors of representative mice placed on the control diet or the PEITC-supplemented diet (×200 magnification, scale bars = 100 µm). Results represent mean Ki-67–positive cells per high power field (n = 16 for mice placed on the control diet and n = 11 for mice placed on the PEITC-supplemented diet, P = .003 by two-sided Student’s t test) with their 95% confidence intervals (error bars). C) TUNEL-positive apoptotic bodies in tumors of representative mice placed on the control diet or the PEITC-supplemented diet. Apoptotic bodies were visualized by a commercial TUNEL-staining kit (×200 magnification, scale bars = 100 µm). Results represent mean TUNEL-positive bodies per high power field (n = 16 for mice placed on the control diet and n = 10 for mice placed on the PEITC-supplemented diet, P < .001 by two-sided Student’s t test) with their 95% confidence intervals (error bars). D) Blood vessels in tumors of representative mice placed on the control diet or the PEITC-supplemented diet. Immunohistochemistry was performed with anti-CD31 antibody (×200 magnification, scale bars = 100 µm). Results represent mean number of blood vessels per high power field (n = 16 for mice placed on the control diet and n = 11 for mice placed on the PEITC-supplemented diet, P = .05 by two-sided Student’s t test) with their 95% confidence intervals (error bars).
Immunohistochemical Analysis for the Effect of PEITC Administration on Expression of Ser65-Phosphorylated Bim and Bcl-xL in the Tumor
Previous studies from our laboratory have revealed that PEITC-induced apoptosis in BRI-JM04 breast cancer cells, a cell line derived from the tumor of an MMTV-neu mouse, is associated with increased Ser65 phosphorylation of Bim and with reduced Bcl-xL protein expression (21). We questioned if the PEITC-mediated induction of apoptosis in the tumors of MMTV-neu mice was accompanied by similar molecular changes. Levels of Ser65 phosphorylated Bim (Figure 4, A) and of Bcl-xL protein (Figure 4, B) were comparable in the tumors from mice placed on both diets.
Figure 4.

Immunohistochemical analysis for the effect of phenethyl isothiocyanate (PEITC) administration on expression of Bcl-xL and Ser65-phosphorylated Bim (pBim) proteins in the tumors of mouse mammary tumor virus–neu mice. A) Images depicting pBim expression in tumors of representative mice placed on the control diet or the PEITC-supplemented diet (×200 magnification, scale bars = 40 µm). Results represent mean pBim-positive cells per high power field (n = 7 for mice placed on the control diet and n = 6 for mice placed on the PEITC-supplemented diet) with their 95% confidence intervals (error bars). B) Images depicting Bcl-xL expression in tumors of representative mice placed on control diet or PEITC-supplemented diet (×200 magnification, scale bars = 40 µm). Results represent mean Bcl-xL–positive cells per high power field (n = 7 for mice placed on the control diet and n = 6 for mice placed on the PEITC-supplemented diet) with their 95% confidence intervals (error bars). P values for the data in panels A and B were determined by two-sided Student’s t tests.
Determination of PEITC-Mediated Protein Expression Changes in the Plasma
Because the PEITC-mediated changes in pBim and Bcl-xL expression observed in cultured BRI-JM04 cells (21) were not evident in the tumors of MMTV-neu mice (Figure 4), we set out to identify measurable biomarker(s) associated with PEITC exposure and activity using a plasma proteomics approach. We used plasma samples from three mice that were fed the control diet and three mice that were fed the PEITC-supplemented diet to determine differentially expressed proteins by two-dimensional gel electrophoresis followed by mass spectrometry. When proteins in the plasma of a mouse placed on the control diet (labeled green with Cy3) and proteins in the plasma of a mouse placed on the PEITC-supplemented diet (labeled red with Cy5) were resolved by two-dimensional gel electrophoresis and compared by overlay (eg, Figure 5, A), 17 differentially expressed protein spots were identified. Some of the differentially expressed proteins were isoforms of the same protein (eg, α-fetoprotein and “chain L, Fab fragment of neutralizing monoclonal antibody 4c4 complexed with G-H loop from Fmdv”), whereas others were unique (Table 1). We proceeded to verify changes in expression of two of these proteins, transferrin and transthyretin, using plasma from five additional mice of each group. Transferrin levels in the plasma of mice that were fed the control and PEITC-supplemented diets were comparable (Figure 5, B). However, consistent with MALDI/TOF/TOF results (Table 1), levels of transthyretin protein in the plasma of mice placed on the PEITC-supplemented diet were 1.77-fold higher than those in the plasma of mice placed on the control diet (mean plasma transthyretin concentration, PEITC-supplemented diet vs control diet, 22.37 vs 12.63 µg/mg protein, difference = 9.74 µg/mg protein, 95% CI = 1.02 to 18.46 µg/mg protein, P = .04, n = 5; Figure 5, C).
Figure 5.
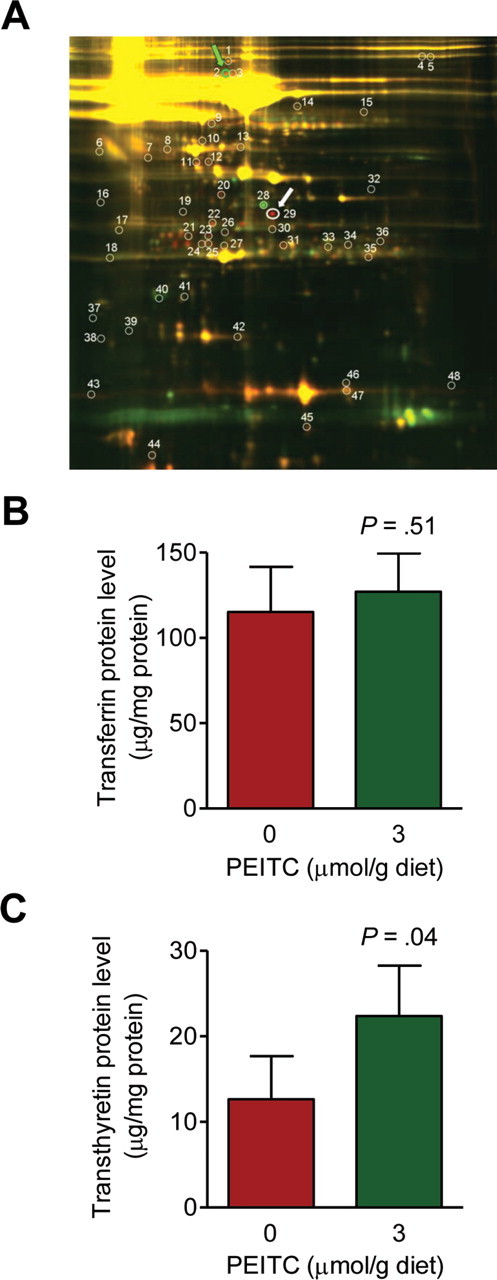
Effect of phenethyl isothiocyanate (PEITC) administration on transferrin and transthyretin protein levels in the plasma of mouse mammary tumor virus–neu mice. A) Fluorescence images of two-dimensional gel electrophoresis overlays depicting differences in protein expression between plasma samples from representative mice placed on the control diet vs the PEITC-supplemented diet. Protein spots for transferrin and transthyretin are identified by green and white arrows, respectively. B) Levels of transferrin in the plasma of mice placed on the control diet vs the PEITC-supplemented diet. Results shown are mean plasma transferrin levels (µg/mg protein) with 95% confidence intervals (error bars) (n = 5 mice per group). C) Levels of transthyretin in the plasma of mice placed on the control diet vs the PEITC-supplemented diet. Results shown are mean plasma transthyretin levels (µg/mg protein) with their 95% confidence intervals (error bars) (n = 5 mice per group). Statistical significance of differences in panels B and C was determined by two-sided Student’s t tests.
Table 1.
Alterations in plasma proteins in response to phenethyl isothiocyanate (PEITC) treatment in mouse mammary tumor virus (MMTV)-neu mice
| Protein name | Master No. | Protein ID | Ratio of protein abundance, PEITC vs control* | P† |
|---|---|---|---|---|
| α-Fetoprotein‡ | 168 | 1 | 1.55 | .07 |
| Transferrin (Mus musculus) | 275 | 2 | 1.49 | .05 |
| α-2-Macroglobulin‡ | 1159 | 19 | 1.47 | .05 |
| α-Fetoprotein‡ | 1045 | 20 | 1.97 | .03 |
| Chain L, crystal structure of the Fab fragment of mouse anti-human Fas antibody Hfe7a | 1335 | 21 | 1.65 | .05 |
| α-2-Macroglobulin‡ | 1248 | 22 | 2.01 | .01 |
| Chain L, Fab fragment of neutralizing monoclonal antibody 4c4 complexed with G-H loop from Fmdv‡ | 1333 | 23 | 2.63 | .06 |
| Apoa1 protein (Mus musculus) | 1380 | 24 | 1.88 | .05 |
| Anti-human seminoprotein monoclonal antibody (Mus musculus) | 1390 | 25 | 2.14 | .05 |
| Chain L, Fab fragment of neutralizing monoclonal antibody 4c4 complexed with G-H loop from Fmdv‡ | 1306 | 26 | 1.63 | .02 |
| α-Fetoprotein‡ | 1125 | 28 | –2.96 | .05 |
| Transthyretin (Mus musculus) | 1181 | 29 | 7.10 | .02 |
| Chain L, human immunodeficiency virus-1 capsid protein (P24) complex with Fab25.3 | 1382 | 34 | 1.53 | .01 |
| Immunoglobulin light chain variable region (Mus musculus) | 1354 | 36 | 2.05 | .01 |
| Predicted hypothetical protein (Mus musculus) | 1953 | 38 | –1.54 | .02 |
| Novel member of the major urinary protein gene family (Mus musculus) | 1742 | 40 | –3.52 | .04 |
| Albumin (Mus musculus) | 1711 | 41 | –1.49 | .04 |
* Plasma samples used were from MMTV-neu mice fed either control diet or 3 µmol PEITC/g diet (n = 3 mice per group). They were separated by two-dimensional electrophoresis and compared.
† All P values were calculated by two-sided Student’s t tests.
‡ The protein spots likely represent isoforms or posttranslational modification(s) of the same protein.
Determination of PEITC-Mediated Protein Expression Changes in the Tumor
Encouraged by the results of plasma proteomics profiling, we used tumor tissues from the mice placed on the control diet and the PEITC-supplemented diet (n = 3 for both groups) for proteomics profiling to identify potential biomarker(s) associated with PEITC exposure and activity. Table 2 lists proteins that were found to be altered in response to PEITC administration in the tumor. Noticeably, some proteins altered by PEITC treatment are related to metabolism or mitochondrial bioenergetics, including hexokinase 1, pyruvate kinase isozymes M1/M2, L-lactate dehydrogenase, and mitochondrial ATP synthase beta subunit (Table 2). We used tumor sections from additional mice of each group to verify changes in expression of some of these proteins, including WDR1 (Figure 6, A), transferrin (Figure 6, B), ATP synthase (Figure 6, C), and annexin A4 (Figure 6, D). Expression of the WDR1 and transferrin proteins was comparable in the tumors from mice placed on both diets. However, expression of ATP synthase in the tumors of mice placed on the PEITC-supplemented diet (n = 6) was 66.06% less than in the tumors of mice placed on the control diet (n = 7) (mean ATP synthase expression in arbitrary units [AU], PEITC-supplemented diet vs control diet, 29.86 vs 87.98 AU, difference = –58.12 AU, 95% CI = –114.70 to –1.54 AU, P = .05 by two-sided Student’s t test). Membrane staining intensity of annexin A4 in the tumors of mice placed on the PEITC-supplemented diet (n = 4) was 25.46% less than in tumors of mice placed on the control diet (n = 5) (mean annexin A4 levels, PEITC-supplemented diet vs control diet, 84.97 vs 114.00 AU, difference = –29.03 AU, 95% CI = –52.65 to –5.34 AU, P = .02 by two-sided Student’s t test). Verification of additional tumor proteins altered by PEITC treatment awaits further investigation.
Figure 6.
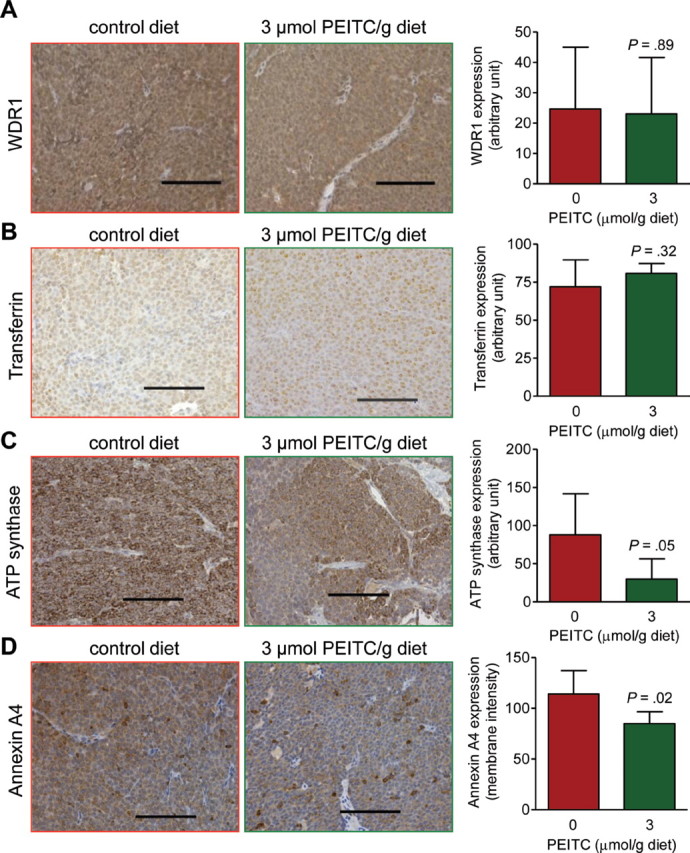
Effect of phenethyl isothiocyanate (PEITC) administration on expression of WD-repeat containing protein-1 (WDR1), transferrin, ATP synthase, and annexin A4 in the tumors of mouse mammary tumor virus–neu mice. A) Expression of WDR1, a protein associated with actin organization, in tumors of representative mice placed on control diet or PEITC-supplemented diet (×200 magnification, scale bars = 100 µm). Results shown are mean expression (arbitrary units) of WDR1 (n = 7 for mice placed on the control diet and n = 6 for mice placed on the PEITC-supplemented diet) with corresponding 95% confidence intervals (error bars). B) Immunohistochemical images depicting transferrin expression in tumors of representative mice placed on control diet or PEITC-supplemented diet (×200 magnification, scale bars = 100 µm). Results shown are mean expression of transferrin (n = 7 for mice placed on the control diet and n = 6 for mice placed on the PEITC-supplemented diet) with corresponding 95% confidence intervals (error bars). C) Immunohistochemical images depicting ATP synthase expression in tumors of representative mice placed on the control diet or the PEITC-supplemented diet (×200 magnification, scale bars = 100 µm). Results shown are mean expression of ATP synthase (n = 7 for mice placed on the control diet and n = 6 for mice placed on the PEITC-supplemented diet) with corresponding 95% confidence intervals (error bars). D) Immunohistochemical images depicting annexin A4 expression in tumors of representative mice placed on the control diet or the PEITC-supplemented diet (×200 magnification, scale bars = 100 µm). Results shown are mean membrane intensity of annexin A4 expression (n = 5 for mice placed on the control diet and n = 4 for mice placed on the PEITC-supplemented diet) with corresponding 95% confidence intervals (error bars). Statistical significance of differences in panels A to D was determined by two-sided Student’s t tests.
Discussion
This study shows that dietary PEITC administration is well tolerated by mice and results in detectable levels of the compound in the plasma as well as both normal and cancerous breast tissues. Although PEITC administration does not confer complete protection against mammary carcinogenesis, mice placed on the PEITC-supplemented diet, compared with mice placed on the control diet, clearly exhibited suppression of carcinoma progression as evidenced by a decrease in the incidence of macroscopic (palpable) carcinoma lesions and microscopic carcinoma lesions that were greater than 2mm2 in size. The PEITC-mediated delay in carcinoma progression was not associated with suppression of the neu oncoprotein. The PEITC diet dose used in this study was approximately 8.28 µmol PEITC per day based on an average dietary intake of 2.76g per mouse per day among the mice of this group. Content of PEITC precursor, gluconasturtiin, in edible cruciferous vegetables ranged between 0.5 and 3mg/g. In comparison, a single one-ounce serving of watercress is estimated to result in intake of approximately 37 µmol of PEITC (15).
Chemoprevention trials with cancer incidence as the primary endpoint are expensive and time-consuming and require thousands of human subjects, coordinated multi-institutional efforts, and years of follow-up to draw meaningful conclusions. Therefore, the discovery of biomarker(s) associated with exposure and activity is critical for clinical development of promising cancer chemopreventative agents; sufficiently powered yet smaller cohort pilot biomarker modulation studies could provide rational justification for larger primary cancer prevention trials. Initially, we focused on processes (eg, cell proliferation, apoptosis induction, and neoangiogenesis) and molecules known to regulate cellular responses to PEITC (eg, pBim and Bcl-xL). In agreement with cellular results (20,21,26), PEITC administration in the diet resulted in reduced cell proliferation, increased apoptosis, and a modest yet statistically significant decrease in number of blood vessels. Angiogenesis is essential for both tumor growth and metastatic spread (27).
Because cancer pathogenesis is complex and often characterized by abnormalities in various checkpoints and oncogenic pathways, the ability to target multiple pathways is a desirable attribute for potential chemopreventative agents. In cultured cancer cells, PEITC treatment is known to suppress multiple oncogenic pathways, such as nuclear factor κB, signal transducer and activator of transcription 3, and Akt [reviewed in (28)]. This study suggests that all changes observed in cellular models may not be valid in vivo. For example, we have shown previously that the PEITC-induced apoptosis in BRI-JM04 mouse mammary carcinoma cells was associated with increased Ser65 phosphorylation of Bim and decreased expression of Bcl-xL (21). Moreover, silencing of Bim expression with small interfering RNA conferred marked protection against PEITC-induced apoptosis not only in BRI-JM04 cells but also in MDA-MB-231 and MCF-7 human breast cancer cells (21). However, a PEITC-mediated decrease in Bcl-xL expression or increase in Ser65 phosphorylation of Bim was not evident in the tumors of MMTV-neu mice in this study. This discrepancy in results between in vitro and in vivo models [(21) and this study] is not likely to be related to estrogen receptor and HER-2 status; previously, PEITC treatment caused apoptosis in a panel of breast cancer cell lines with different estrogen receptor and HER-2 status, including MCF-7 (estrogen receptor–positive, normal HER-2 expression), MDA-MB-231 (triple negative), and BRI-JM04 cells (estrogen receptor–negative and HER-2 overexpression) (21). Thus, the PEITC-mediated apoptosis in the tumors of MMTV-neu mice may be mediated by molecules other than Bim and Bcl-xL.
PEITC administration resulted in altered expression of several proteins in the tumors and plasma of MMTV-neu mice. Interestingly, the mitochondrial ATP synthase β-subunit protein, levels of which were statistically significantly reduced by PEITC administration in the tumors of MMTV-neu mice, is functionally linked to oxidative phosphorylation: this is the catalytic subunit of the mitochondrial H+-ATP complex and the rate-limiting component for the production of ATP. Previous studies from our laboratory have indicated that the PEITC-induced apoptosis in prostate cancer cells is tightly linked to inhibition of oxidative phosphorylation leading to activation of the pro-apoptotic protein Bax by reactive oxygen species (20). Oxidative phosphorylation is also inhibited upon treatment of BRI-JM04 cells with PEITC (S.V. Singh, unpublished observations). Because PEITC is an electrophilic molecule, it is capable of reacting with protein sulfhydryl groups, and protein binding is considered an important mechanism in chemopreventative cellular responses to PEITC (29). Notably, ATP synthase is one of the proteins that are susceptible to binding by PEITC (29). Furthermore, ATP synthase expression is increased in breast tumor tissues compared with nonmalignant breast tissues (30). Pharmacological inhibition of ATP synthase using aurovertin B has inhibited proliferation and caused apoptosis in several breast cancer cell lines but not in a normal mammary epithelial cell line, MCF-10A (30). Collectively, these results appear to indicate that ATP synthase is a valid biomarker for PEITC activity and perhaps a mediator of PEITC-induced apoptosis in vivo. Further studies are necessary to determine whether: 1) PEITC administration inhibits complex V activity in vivo, and 2) PEITC administration causes activation of Bax in the tumors of MMTV-neu mice. Other metabolism-related proteins that are differentially altered by PEITC administration, such as pyruvate kinase isozymes M1 and M2 and L-lactate dehydrogenase A chain isoform 1, may also be relevant to cancer (31,32).
It is equally important to note that the PEITC-mediated inhibition of breast cancer growth in MMTV-neu mice is associated with reduced plasma membrane staining for annexin A4, a member of the annexin family of ubiquitously expressed proteins. Annexin A4 regulates a calmodulin-dependent kinase II-activated chloride conductance (33). Nothing is known about the expression of annexin A4 in the context of HER-2–positive human breast cancers, but in renal clear cell carcinoma, overexpression of annexin A4 is associated with increased metastatic potential of the tumor (34). Expression of annexin A4 is also elevated in ovarian tumors and associated with chemoresistance in cultured lung cancer cells (35). Annexin A4 was shown to be induced in human non–small cell lung carcinoma cells by the antimitotic drug paclitaxel and localized to the nucleus in stressed cells (35). Thus, it is reasonable to postulate that suppression of annexin A4 protein levels contributes to PEITC-mediated inhibition of breast cancer growth in vivo.
Finally, this study illustrates the 1.77-fold increase in plasma protein levels of transthyretin in mice placed on the PEITC-supplemented diet compared with the control diet. Transthyretin, also called prealbumin, is an acute phase protein that decreases in the setting of inflammation and is highly sensitive to alterations by short-term changes in diet (36,37). Interestingly, a recent study showed that feeding of cruciferous vegetables has a glutathione-S-transferase mu1 (GSTM1) genotype-dependent effect on transthyretin, with decrease in GSTM1-positive individuals but not among GSTM1-null individuals (38). Nevertheless, the expression of GSTM1 protein was not altered in the tumors of MMTV-neu mice by PEITC administration. Expression of GSTM1 protein in the tumors of MMTV-neu mice placed on control diet (n = 16) and the PEITC-supplemented diet (n = 10) was comparable (PEITC-supplemented diet vs control diet, mean = 189.40 vs 193.70 H-score, difference = –4.30 H-score, 95% CI= –39.48 to 30.85 H-score, P = .8 by two-sided Student’s t test).
Our study has some limitations. First, the mechanism by which PEITC administration causes apoptosis induction in the tumor in vivo is still elusive. Second, the functional relevance of other altered proteins in the context of PEITC-mediated inhibition of breast tumor growth is unclear. Third, we used a transgenic mouse model of breast cancer with similarities to human disease progression to demonstrate the chemopreventative efficacy of PEITC; however, the results of PEITC treatment as a preventive strategy may be different in humans than in mice. Finally, this study highlights mechanistic differences between the outcomes of PEITC exposure in in vitro vs in vivo models.
Funding
This investigation was supported in part by the research grants from the National Cancer Institute at the National Institutes of Health (RO1 CA101753-08 and RO1 CA129347-05 to S.V.S.). This research project used an animal facility, clinical pharmacology facility (of JHB), and tissue and research pathology facility (of RD) that were supported in part by a grant from the National Cancer Institute at the National Institutes of Health (P30 CA047904).
Notes
Julie A. Arlotti, Anna A. Powolny, and Kumar Chandra-Kuntal were responsible for feeding the mice, determining body weights and food consumptions, necropsy, and collection of tissues. PEITC levels in the plasma and tissues were determined by Jan H. Beumer. Histopathological evaluations were done by Su-Hyeong Kim, Anuradha Sehrawat, and Eun-Ryeong Hahm in consultation with a board-certified pathologist (Rajiv Dhir). Immunohistochemical analyses were performed by Kozue Sakao, Eun-Ryeong Hahm, Kumar Chandra-Kuntal, and Joomin Lee. Eun-Ryeong Hahm performed the ELISA assays to quantify plasma transferrin and transthyretin levels. Rachel C. Jankowitz was involved with manuscript preparation. Shivendra V. Singh was responsible for the overall experimental design and supervision of the experiments, data interpretation, and preparation of the final manuscript.
References
- 1. Hulka BS, Stark AT. Breast cancer: cause and prevention Lancet. 1995;346(8979):883–887 [DOI] [PubMed] [Google Scholar]
- Zhang Y, Kiel DP, Kreger BE, et al. Bone mass and the risk of breast cancer among postmenopausal women N Engl J Med. 1997;336(9):611–617 [DOI] [PubMed] [Google Scholar]
- 3. van Zitteren M, van der Net JB, Kundu S, Freedman AN, van Duijn CM, Janssens AC. Genome-based prediction of breast cancer risk in the general population: a modeling study based on meta-analyses of genetic associations Cancer Epidemiol Biomarkers Prev. 2011;20(1):9–22 [DOI] [PubMed] [Google Scholar]
- 4. Jemal A, Siegel R, Xu J, Ward E. Cancer statistics, 2010 CA Cancer J Clin. 2010;60(5):277–300 [DOI] [PubMed] [Google Scholar]
- 5. Alvarez RH. Present and future evolution of advanced breast cancer therapy Breast Cancer Res. 2010;12(suppl 2):S1. [DOI] [PMC free article] [PubMed] [Google Scholar]
- 6. Higgins MJ, Baselga J. Breast cancer in 2010: novel targets and therapies for a personalized approach Nat Rev Clin Oncol. 2011;8(2):65–66 [DOI] [PubMed] [Google Scholar]
- 7. Fisher B, Costantino JP, Wickerham DL, et al. Tamoxifen for prevention of breast cancer: report of the National Surgical Adjuvant Breast and Bowel Project P-1 study J Natl Cancer Inst. 1998;90(18):1371–1388 [DOI] [PubMed] [Google Scholar]
- 8. Cauley JA, Norton L, Lippman ME, et al. Continued breast cancer risk reduction in postmenopausal women treated with raloxifene: 4-year results from the MORE trial Breast Cancer Res Treat. 2001;65(2):125–134 [DOI] [PubMed] [Google Scholar]
- 9. Goss PE, Ingle JN, Alés-Martínez JE, et al. Exemestane for breast-cancer prevention in postmenopausal women N Engl J Med. 2011;364(25):2381–2391 [DOI] [PubMed] [Google Scholar]
- 10. Obiorah I, Jordan VC. Progress in endocrine approaches to the treatment and prevention of breast cancer Maturitas. 2011;70(4):315–321 [DOI] [PMC free article] [PubMed] [Google Scholar]
- 11. Boccardo F, Rubagotti A, Guglielmini P, et al. Switching to anastrozole versus continued tamoxifen treatment of early breast cancer. Updated results of the Italian tamoxifen anastrozole (ITA) trial Ann Oncol. 2006;17(suppl 7):vii,10–14 [DOI] [PubMed] [Google Scholar]
- 12. Surh YJ. Cancer chemoprevention with dietary phytochemicals Nat Rev Cancer. 2003;3(10):768–780 [DOI] [PubMed] [Google Scholar]
- 13. Newman DJ, Cragg GM, Snader KM. Natural products as sources of new drugs over the period 1981 2002 J Nat Prod. 2003;66(7):1022–1037 [DOI] [PubMed] [Google Scholar]
- 14. Fahey JW, Zalcmann AT, Talalay P. The chemical diversity and distribution of glucosinolates and isothiocyanates among plants Phytochemistry. 2001;56(1):5–51 [DOI] [PubMed] [Google Scholar]
- 15. Hecht SS. Inhibition of carcinogenesis by isothiocyanates Drug Metab Rev. 2000;32(3-4):395–411 [DOI] [PubMed] [Google Scholar]
- 16. Wattenberg LW. Inhibition of carcinogenic effects of polycyclic hydrocarbons by benzyl isothiocyanate and related compounds J Natl Cancer Inst. 1977;58(2):395–398 [DOI] [PubMed] [Google Scholar]
- 17. Stoner GD, Morrissey DT, Heur YH, Daniel EM, Galati AJ, Wagner SA. Inhibitory effects of phenethyl isothiocyanate on N-nitrosobenzylmethylamine carcinogenesis in the rat esophagus Cancer Res. 1991;51(8):2063–2068 [PubMed] [Google Scholar]
- 18. Khor TO, Cheung WK, Prawan A, Reddy BS, Kong AN. Chemoprevention of familial adenomatous polyposis in Apc Min/+ mice by phenethyl isothiocyanate (PEITC) Mol Carcinog. 2008;47(5):321–325 [DOI] [PubMed] [Google Scholar]
- 19. Powolny AA, Bommareddy A, Hahm ER, et al. Chemopreventative potential of the cruciferous vegetable constituent phenethyl isothiocyanate in a mouse model of prostate cancer J Natl Cancer Inst. 2011;103(7):571–584 [DOI] [PMC free article] [PubMed] [Google Scholar]
- 20. Xiao D, Powolny AA, Moura MB, et al. Phenethyl isothiocyanate inhibits oxidative phosphorylation to trigger reactive oxygen species-mediated death of human prostate cancer cells J Biol Chem. 2010;285(34):2655826569. [DOI] [PMC free article] [PubMed] [Google Scholar]
- 21. Hahm ER, Singh SV. Bim contributes to phenethyl isothiocyanate-induced apoptosis in breast cancer cells Mol Carcinog. 2012;51(6):465–474 [DOI] [PMC free article] [PubMed] [Google Scholar]
- 22. Slamon DJ, Clark GM, Wong SG, Levin WJ, Ullrich A, McGuire WL. Human breast cancer: correlation of relapse and survival with amplification of the HER-2/neu oncogene Science. 1987;235(4785):177–182 [DOI] [PubMed] [Google Scholar]
- 23. Guy CT Webster MA Schaller M Parsons TJ Cardiff RD Muller WJ Expression of the neu protooncogene in the mammary epithelium of transgenic mice induces metastatic disease Proc Natl Acad Sci U S A. 1992;89(22):10578–10582 [DOI] [PMC free article] [PubMed] [Google Scholar]
- 24. Ménard S, Tagliabue E, Campiglio M, Pupa SM. Role of HER2 gene overexpression in breast carcinoma J Cell Physiol. 2000;182(2):150–162 [DOI] [PubMed] [Google Scholar]
- 25. Warin R, Chambers WH, Potter DM, Singh SV. Prevention of mammary carcinogenesis in MMTV-neu mice by cruciferous vegetable constituent benzyl isothiocyanate Cancer Res. 2009;69(24):9473–9480 [DOI] [PMC free article] [PubMed] [Google Scholar]
- 26. Xiao D, Singh SV. Phenethyl isothiocyanate inhibits angiogenesis in vitro and ex vivo Cancer Res. 2007;67(5):2239–2246 [DOI] [PubMed] [Google Scholar]
- 27. Folkman J. Tumor angiogenesis: therapeutic implications N Eng J Med. 1971;285(21):1182–1186 [DOI] [PubMed] [Google Scholar]
- 28. Powolny AA, Bommareddy A, Singh SV. Slow but steady progress in cancer chemoprevention with phenethyl isothiocyanate: fulfilled promises and translational challenges. In: Sarkar FH, ed. Neutraceuticals and Cancer. Houten, Netherlands: Springer Science+Business Media B.V; 2012:231−–258 [Google Scholar]
- 29. Mi L, Hood BL, Stewart NA, et al. Identification of potential protein targets of isothiocyanates by proteomics Chem Res Toxicol. 2011;24(10):1735–1743 [DOI] [PMC free article] [PubMed] [Google Scholar]
- 30. Huang TC, Chang HY, Hsu CH, Kuo WH, Chang KJ, Juan HF. Targeting therapy for breast carcinoma by ATP synthase inhibitor aurovertin B J Proteome Res. 2008;7(4):1433–1444 [DOI] [PubMed] [Google Scholar]
- 31. Mazurek S Boschek CB Hugo F Eigenbrodt E Pyruvate kinase type M2 and its role in tumor growth and spreading Semin Cancer Biol. 2005;15 4):300–308 [DOI] [PubMed] [Google Scholar]
- 32. Fantin VR, St-Pierre J, Leder P. Attenuation of LDH-A expression uncovers a link between glycolysis, mitochondrial physiology, and tumor maintenance Cancer Cell. 2006;9(6):425–434 [DOI] [PubMed] [Google Scholar]
- 33. Huang P, Liu J, Di A, et al. Regulation of human CLC-3 channels by multifunctional Ca2+/calmodulin-dependent protein kinase J Biol Chem. 2001;276(23):20093–20100 [DOI] [PubMed] [Google Scholar]
- 34. Zimmermann U, Balabanov S, Giebel J, et al. Increased expression and altered location of annexin IV in renal clear cell carcinoma: a possible role in tumour dissemination Cancer Lett. 2004;209(1):111–118 [DOI] [PubMed] [Google Scholar]
- 35. Han EK, Tahir SK, Cherian SP, Collins N, Ng SC. Modulation of paclitaxel resistance by annexin IV in human cancer cell lines Br J Cancer. 2000;83(1):83–88 [DOI] [PMC free article] [PubMed] [Google Scholar]
- 36. Shenkin A. Serum prealbumin: is it a marker of nutritional status or of risk of malnutrition? Clin Chem. 2006;52(12):21772179. [DOI] [PubMed] [Google Scholar]
- 37. Gabay C, Kushner I. Acute-phase proteins and other systemic responses to inflammation N Engl J Med. 1999;340(6):448–454 [DOI] [PubMed] [Google Scholar]
- 38. Brauer HA, Libby TE, Mitchell BL, et al. Cruciferous vegetable supplementation in a controlled diet study alters the serum peptidome in a GSTM1-genotype dependent manner Nutr J. 2011;10:11 [DOI] [PMC free article] [PubMed] [Google Scholar]