

Abstract
Surrogate endpoints offer the hope of smaller or shorter cancer trials. It is, however, important to realize they come at the cost of an unverifiable extrapolation that could lead to misleading conclusions. With cancer prevention, the focus is on hypothesis testing in small surrogate endpoint trials before deciding whether to proceed to a large prevention trial. However, it is not generally appreciated that a small surrogate endpoint trial is highly sensitive to a deviation from the key Prentice criterion needed for the hypothesis-testing extrapolation. With cancer treatment, the focus is on estimation using historical trials with both surrogate and true endpoints to predict treatment effect based on the surrogate endpoint in a new trial. Successively leaving out one historical trial and computing the predicted treatment effect in the left-out trial yields a standard error multiplier that summarizes the increased uncertainty in estimation extrapolation. If this increased uncertainty is acceptable, three additional extrapolation issues (biological mechanism, treatment following observation of the surrogate endpoint, and side effects following observation of the surrogate endpoint) need to be considered. In summary, when using surrogate endpoint analyses, an appreciation of the problems of extrapolation is crucial.
A surrogate endpoint, such as a biomarker, is an endpoint observed sooner than a true endpoint, such as cancer or mortality, and is used to make conclusions about the effect of an intervention on true endpoint. Consequently, surrogate endpoints offer the hope of making results available sooner and at reduced costs. However, there is no free lunch. Surrogate endpoint analyses involve an extrapolation to an unobserved effect of intervention on the true endpoint, and no statistical approach can fully address the unknown nature of this extrapolation. A bewildering variety of statistical methods have been proposed for analyzing trials with surrogate endpoints (1–12), and it is easy to lose an appreciation of the extrapolation amid the mathematics. The focus here is on two simple methods for surrogate endpoint analysis that elucidate the potential cost of extrapolation.
Importantly, the type of surrogate endpoint analysis depends on the application, with considerable differences between cancer prevention trials (13) and cancer treatment trials (14). Surrogate endpoints also play a role in double sampling trials, in which surrogate endpoints are observed in all trial participants and true endpoints are observed in a random sample of participants (15–20). In double sampling, the use of a random sampling to observe some true endpoints provides a firm basis for drawing conclusions without problems of extrapolation. In the situations discussed in this article, the investigators are more ambitious in drawing conclusions because they have no data on the true endpoint in the trial of interest and the validity of an extrapolation is a crucial consideration.
Cancer Prevention Trials: Hypothesis-Testing Extrapolation
A typical definitive cancer prevention trial to study the effect of an intervention on the true endpoint of cancer incidence among healthy persons may require a sample size in the tens of thousands. Before committing time and resources to such a large trial, investigators seek preliminary evidence that the intervention to prevent cancer will likely be beneficial. A frequent source of evidence is a small trial with a surrogate endpoint (21). The choice of surrogate endpoint for cancer incidence depends on the current understanding of cancer biology (22). Examples of candidate surrogate endpoints include measurements or indicators based on tumor-associated gene expression or function; circulating blood biomarkers, such as hormone levels or cellular morphology; markers of cell proliferation; and tissue changes, such as onset of adenomas (23). The biological link may or may not be solid. However, the focus here is on statistical issues. Because it is unusual to find any previous prevention trial that measures the surrogate endpoints of interest, there are no data for constructing a model to estimate the effect of an intervention on cancer incidence based on the surrogate endpoint. In this setting, surrogate endpoint analyses are based on what we call hypothesis-testing extrapolation—namely, rejecting the null hypothesis that intervention has no effect on the surrogate endpoint implies rejecting the null hypothesis that intervention has no effect on true endpoint.
It is not uncommon for a surrogate endpoint trial for cancer prevention to be less than 1% the size of the corresponding prevention trial with a true endpoint. For example, a trial that involved a surrogate endpoint of bronchial dysplasia had a sample size of 267 (24), whereas a trial that involved a true endpoint of lung cancer incidence among healthy persons had a sample size of 70 000 (25). Because a small surrogate endpoint trial usually has adequate power to detect a specified reduction in a surrogate endpoint, investigators rarely question its relevance to a large prevention trial with a true endpoint. This may partly arise from the seductive assumption that the underlying biology is fully understood. However, as discussed below, there is no free lunch when it comes to hypothesis-testing extrapolation.
The Prentice Criterion
The problem with drawing conclusions from a small surrogate endpoint trial for cancer prevention is that hypothesis-testing extrapolation can be misleading because of sensitivity to violations of a key assumption (13). A key assumption for hypothesis-testing extrapolation is the Prentice criterion—that the probability of true endpoint given the surrogate endpoint is the same in both randomization groups. This criterion is named after Ross Prentice, who discussed requirements for hypothesis-testing extrapolation (26). In the case of a binary surrogate endpoint, the two requirements for valid hypothesis-testing extrapolation are 1) the Prentice criterion and 2) an association between the probabilities of true and surrogate endpoints within each randomization group (27). Sometimes an additional “requirement” is listed—namely, the probabilities of surrogate and true endpoints depend on the intervention, but this is not really a requirement but instead part of the statement of hypothesis-testing extrapolation
Insight into these requirements is provided by Figures 1 and 2, which display BK plots (28–30) in a modified form that is related to a plot for continuous surrogate and true endpoints that shows that a “perfect correlate does not a surrogate make” (31). The horizontal axis is the probability of the surrogate endpoint (at one level). The vertical axis is the probability of the true endpoint (at the corresponding level). Points are labeled as C for control group and E for experimental group. The diagonal lines connect the probabilities of true endpoint for the two levels of the surrogate endpoints. The first requirement, the Prentice criterion, translates into identical diagonal lines for each randomization group, as in Figure 1. The second requirement says the diagonal lines are, in fact, not flat. The additional mistaken “requirement” says points C and E are distinct.
Figure 1.

A BK plot showing the Prentice criterion. The Prentice criterion corresponds to a single diagonal line. C = control; E = experimental.
Figure 2.
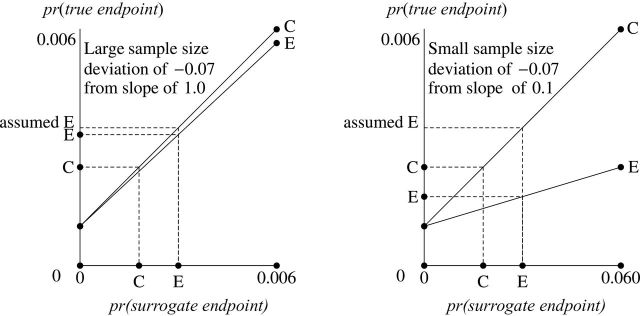
BK plots showing deviations from the Prentice criterion. The deviations from the Prentice criterion correspond to different diagonal lines. C = control; E = experimental.
To understand the graphical implications of these requirements for hypothesis-testing extrapolation, it is necessary to explain the relationship between corresponding points on the vertical and horizontal axes. Point C on the vertical axis (the probability of true endpoint in the control group) is graphically computed by connecting a vertical line from point C on the horizontal axis (the probability of surrogate endpoint in the control group) to the diagonal line for the control group and drawing a horizontal line to the left. A similar algorithm applies for computing point E on the vertical axis from point E on the horizontal axis. If the requirements for hypothesis-testing extrapolation hold (a single diagonal line), then the true result (the difference between vertical points E and C) is proportional to the surrogate result (the difference between horizontal points E and C). Consequently, hypothesis-testing extrapolation holds because any surrogate result greater than zero implies a true result greater than zero.
Deviation From the Prentice Criterion: Sensitivity of Extrapolation
A deviation from the Prentice criterion can be specified as a difference in the probabilities of true endpoint given surrogate endpoint between the two randomization groups. In Figure 2, this deviation translates into different slopes for the diagonal lines for the two groups. The point “assumed E” is the probability of true endpoint in the experimental group if investigators incorrectly assumed the Prentice criterion held and believed the diagonal line for the experimental group coincided with the diagonal line for the control group. The left side of Figure 2 shows a slope of 1 for the control group, which corresponds to a large surrogate endpoint trial with the same size as the true endpoint trial. A small deviation of −0.07 in the Prentice criterion gives a slope of 0.993 for the experimental group. Because point assumed E is close to point E, hypothesis-testing extrapolation approximately holds. The right side of Figure 2 shows a slope of 0.100 for control group (note that the scale of the horizontal axis differs from that of the left side), which corresponds to a small surrogate endpoint trial about one-tenth the size of the true endpoint trial. The same small deviation of −0.07 in the Prentice criterion gives a slope of 0.093 for the experimental group. Because the point assumed E is far from point E (in fact on the opposite side of C), hypothesis-testing extrapolation can be seriously misleading.
The impact of a small deviation from the Prentice criterion is quantified by the relative error, which is the error in the estimated effect of intervention on the true endpoint (the distance between assumed E and E on the vertical axis) as a percentage of the true result investigators hope to detect. Based on previous calculations that involved a sample size of 73 300 for a trial with a true endpoint, a very small deviation in the Prentice criterion of −0.002 is consistent with a relative error of −0.8%, −8%, and −80% for a trial with a surrogate endpoint of size of 73 300, 7100, and 496, respectively (14). In other words, with a small trial of size 496, the relative error is an important concern. With an intermediate-sized trial of 7100, the relative error is only a moderate concern. With a large trial of 73 300, the relative error is a minor concern, but this defeats the purpose of using the surrogate endpoint. Although the focus of this discussion has been on the Prentice criterion with a binary surrogate endpoint, qualitatively similar results are obtained with a Prentice criterion for the mean of a continuous surrogate endpoint and for a related criterion that involves a principal stratification model with binary surrogate endpoint (32).
The low tolerance for a small deviation from the Prentice criterion is the fundamental problem with small sample sizes for surrogate endpoint trials. As an analogy, suppose you are tossing two coins, a small coin weighing 1g and a large coin weighing 100g. It is a rainy day, and mud weighing 0.2g sticks to one side of each coin when it lands on the ground. In subsequent tosses, this extra mud has a larger effect on the probability of heads with the small coin than with the large coin.
A Practical Recommendation
Hypothesis testing from a small surrogate endpoint trial is a major component in making decisions about implementing a definitive trial with an endpoint of cancer incidence. The above results lead to the following recommendation. Before jumping directly from a statistically significant result in a small surrogate endpoint trial to implementation of a large prevention trial with a true endpoint of cancer incidence, a moderately sized surrogate endpoint trial should be implemented to reduce the possibility of misleading hypothesis-testing extrapolation. Implementing the moderately sized surrogate endpoint trial would require finding a surrogate endpoint that occurs less often than the surrogate endpoint in the initial small surrogate endpoint trial. However, even if the moderately sized surrogate endpoint trial yields a promising result, other types of evidence, such as any results from mechanistic studies, experimental studies in animals, or observational studies in humans, should also factor into the decision of whether to launch a large prevention trial. Also a larger deviation from the Prentice criterion than specified in this example could render the results from even a moderately sized surrogate endpoint trial misleading.
Cancer Treatment Trials: Estimation Extrapolation
Surrogate endpoints play a different role in cancer treatment trials than in cancer prevention trials. With treatment trials, the main purpose of using the surrogate endpoint is usually to shorten the duration of the trial, sometimes with an eye toward drug approval. Unlike with prevention trials, data are typically available from one or more historical trials with the same surrogate and true endpoints as in the new trial. The goal is to predict the effect of treatment on true endpoint in a new trial based on the surrogate endpoints in the new trial and a prediction model that relates surrogate and true endpoints derived from historical trials, a procedure we call estimation extrapolation. The focus here is on one relatively simple method that highlights the extrapolation.
The Prediction Model
A major challenge in formulating a prediction model is labeling control and experimental groups. A problem is that an experimental treatment in one historical trial may be a control treatment in another historical trial (33). Also, there may be more than two randomization groups in a trial (14). The following two-part strategy addresses this challenge. First, the randomization group with smallest (largest) estimated probability of the favorable surrogate endpoint is labeled as the control (experimental) group (14). This procedure assumes that the treatment effect for the surrogate endpoint is in the same direction as the treatment effect for the true endpoint. Second, the prediction model specifies the Prentice criterion—namely, the true result is proportional to the surrogate result—so that if mislabeling changes the sign of both results, the model is unchanged (33). Importantly, the rationale for using the Prentice criterion differs between estimation extrapolation and hypothesis-testing extrapolation.
Uncertainty With the Prediction Model: The Standard Error Multiplier
The standard error multiplier quantifies the uncertainty associated with the prediction model based on a successive leave-one-out analysis that mimics estimation extrapolation using past data (14). Computation of the standard error multiplier involves the following steps. Successively, one historical trial is removed from the analysis, the prediction is model is fit to data from the remaining historical trials, and the prediction model is applied to the surrogate endpoints in the left-out trial to compute a model result. The extrapolation error for the left-out trial is the difference between the model result and the true result. The predicted result for the left-out trial equals the model result plus the mean of the extrapolation errors. The variance of the predicted result for the left-out trial equals the variance of the model result plus the variance of the extrapolation error. The standard error multiplier is the average, over historical trials, of the standard errors of the predicted result divided by the standard error of the true result.
Computation of the standard error multiplier requires surrogate and true endpoints that are binary, which importantly includes an indicator of survival to a prespecified time. A surrogate or true result that is the difference in estimated survival to a clinically meaningful prespecified time is an attractive alternative to the commonly used hazard ratio, and it provides a more easily understood outcome for both clinician and patient. The main objection to the former is the need to specify a time for the analysis. However, without a strong assumption of proportional hazards, the hazard ratio depends on the duration of follow-up (34), so it also depends on a prespecified time. Because an absolute difference is more clinically relevant than a ratio (35–38), the difference in estimated survival at specified time can be a more appealing measure than the hazard ratio.
The standard error multiplier has been computed for the following datasets: 1) 10 historical, randomized trials for early colon cancer where the surrogate endpoint was survival to 3 years without cancer recurrence and the true endpoint was overall survival to 5 years (14,39); 2) 10 randomized trials for advanced colorectal cancer where the surrogate endpoint was survival to 6 months without cancer progression and the true endpoint was overall survival to 12 months (14,40,41); and 3) 27 randomized trials for advanced colorectal cancer, some of which are the same as in the second example, where the surrogate endpoint was tumor status assessed after 3–6 months, and the true endpoint was overall survival to 12 months (3,42). For these three examples, the standard error multipliers were 1.36, 1.33, and 1.25, respectively (14). Using the original labels for control and treatment groups (for a sensitivity analysis), the standard error multipliers were similar—namely, 1.30, 1.33, and 1.23, respectively. Detailed calculations for the second example are presented in the Supplementary Material (available online).
Simple Recommendation: Addressing Four Questions
Before planning a new trial with only a surrogate endpoint and drawing conclusions based on estimation extrapolation, it is necessary to address the following four questions.
Question 1: Does the increased uncertainty associated with estimation extrapolation in historical trials (as summarized by the standard error multiplier) outweigh the advantage of drawing conclusions sooner than with a true endpoint trial?
If the answer to Question 1 is “no,” there is no point in implementing a new surrogate endpoint trial because confidence intervals will likely be too wide to be informative. If the answer to Question 1 is “yes,” then the following three additional questions, that reframe known issues in surrogate endpoint analysis (43), need to be addressed:
Question 2: Would the biological mechanism in which treatment affects surrogate and true endpoints likely be similar in the new trial as in some of the historical trials?
Question 3: Would patient management following the surrogate endpoint likely be similar in the new trial as in some of the historical trials?
Question 4: Would no serious detrimental side effects likely arise in the new trial between the time of observation of the surrogate endpoint and the time of observation of true endpoint?
If the answers to Questions 2, 3, and 4 are all “yes,” then a surrogate endpoint trial could reasonably be used to rule in a promising treatment. Of course, this is a tall order, particularly Questions 2 and 4, which could involve many unknowns. If the answers to Questions 2 and 3 are “yes,” a surrogate endpoint trial could be reasonably used to rule out an unpromising treatment without the need to consider Question 4. The detrimental consequences of incorrectly answering these questions is greatly lessened if estimation extrapolation is applied to a preliminary randomized trial with a surrogate endpoint, which is used to decide whether or not to implement a trial with a definitive true endpoint.
Conclusions
For clinicians and clinical trialists contemplating the use of a surrogate endpoint trial, the key point is not to lose sight of the fact that the analysis is fundamentally an extrapolation. In the cancer prevention setting, the reliance on hypothesis-testing extrapolation is particularly risky with a small surrogate endpoint trial. In the cancer treatment setting, a useful first step is to quantify the uncertainty of estimation extrapolation based on a leave-one-out analysis of previous historical trials. Subsequently, other extrapolations issues need to be addressed.
Funding
This work was supported by the Division of Cancer Prevention in the National Cancer Institute and the National Institutes of Health.
Supplementary Material
The funders did not have a role in the study design, data collection, analysis, and interpretation; the writing of the article; or the decision to submit the article for publication.
References
- 1. Torri V, Simon R, Russek-Cohen E, Midthune D, Friedman M. Statistical model to determine the relationship of response and survival in patients with advanced ovarian cancer treated with chemotherapy. J Natl Cancer Inst. 1992; 84(6):407–414 [DOI] [PubMed] [Google Scholar]
- 2. Freedman LS, Graubard BI, Schatzkin A. Statistical validation of intermediate endpoints for chronic disease. Stat Med. 1992; 11(2)167–178 [DOI] [PubMed] [Google Scholar]
- 3. Daniels MJ, Hughes MD. Meta-analysis for the evaluation of potential surrogate markers. Stat Med. 1997; 16(17):1965–1982 [DOI] [PubMed] [Google Scholar]
- 4. Gail MH, Pfeiffer R, Houwelingen HC, Carroll RJ. On meta-analytic assessment of surrogate outcomes. Biostatistics. 2000; 1(3):231–246 [DOI] [PubMed] [Google Scholar]
- 5. Buyse M, Molenberghs G, Burzykowski T, Renard D, Geys H. The validation of surrogate endpoints in meta-analyses of randomized experiments. Biostatistics. 2000; 1(1):49–67 [DOI] [PubMed] [Google Scholar]
- 6. Korn EL, Albert PS, McShane LM. Assessing surrogates as trial endpoints using mixed model. Stat Med. 2005; 24(2):163–182 [DOI] [PubMed] [Google Scholar]
- 7. Weir CJ, Walle RJ. Statistical evaluation of biomarkers as surrogate endpoints: a literature review. Stat Med. 2006; 25(2):183–203 [DOI] [PubMed] [Google Scholar]
- 8. Lassere MN, Johnson KR, Schiff M, Rees D. Is blood pressure reduction a valid surrogate endpoint for stroke prevention? An analysis incorporating a systematic review of randomised controlled trials, a by-trial weighted errors-in-variables regression, the surrogate threshold effect (STE) and the biomarker-surrogacy (biosurrogate) evaluation schema (BSES).. BMC Med Res Methodol. 2012;;12:27. [DOI] [PMC free article] [PubMed] [Google Scholar]
- 9. Joffe MM, Greene T. Related causal frameworks for surrogate outcomes. Biometrics. 2009; 65(2):530–538 [DOI] [PubMed] [Google Scholar]
- 10. Li Y, Taylor JMG, Elliott MR, Sargent DJ. Causal assessment of surrogacy in a meta-analysis of colorectal cancer trials. Biostatistics. 2011; 12(3):478–492 [DOI] [PMC free article] [PubMed] [Google Scholar]
- 11. Ghosh D, Taylor JMG, Sargent DJ. Meta-analysis for surrogacy: accelerated failure time models and semicompeting risks modeling. Biometrics. 2012; 68(1):226–247 [DOI] [PMC free article] [PubMed] [Google Scholar]
- 12. Dai JY, Hughes JP. A unified procedure for meta-analytic evaluation of surrogate end points in randomized clinical trials. Biostatistics. 2012; 13(4):609–624 [DOI] [PMC free article] [PubMed] [Google Scholar]
- 13. Baker SG, Kramer BS. The risky reliance on small surrogate endpoint studies when planning a large prevention trial [published online ahead of print June 28, 2012]. J R Stat Soc (A).. doi:10.1111/j.1467-985X.2012.01052.x [DOI] [PMC free article] [PubMed] [Google Scholar]
- 14. Baker SG, Sargent DJ, Buyse M, Burzykowski T. Predicting treatment effect from surrogate endpoints and historical trials: an extrapolation involving probabilities of a binary outcome or survival to a specific time. Biometrics. 2012; 68(1):248–257 [DOI] [PMC free article] [PubMed] [Google Scholar]
- 15. Palmgren J. Precision of double sampling estimators for comparing two probabilities. Biometrika. 1987; 74(4):687–694 [Google Scholar]
- 16. Chernoff H, Haitovsky Y. Locally optimal design for comparing two probabilities from binomial data subject to misclassification. Biometrika. 1990; 77(4):797–805 [Google Scholar]
- 17. Finkelstein D, Schoenfeld DA. Analyzing survival in the presence of an auxiliary variable. Stat Med. 1994; 13(17):1747–1754 [DOI] [PubMed] [Google Scholar]
- 18. Fleming TR, Prentice RL, Pepe MS, Glidden D. Surrogate and auxiliary endpoints in clinical trials with potential applications in cancer and AIDS research. Stat Med. 1994; 13(9):955–968 [DOI] [PubMed] [Google Scholar]
- 19. Pepe MS. Inference using surrogate outcome data and a validation sample. Biometrika. 1992; 79(2):355–365 [Google Scholar]
- 20. Goldman B, LeBlanc M, Crowley J. Interim futility analysis with intermediate endpoints. Clin Trials. 2008; 5(1):14–22 [DOI] [PubMed] [Google Scholar]
- 21. Stearns V, Gallagher A, Kleer CG, et al. A pilot study to establish a clinical model to perform phase II studies of breast cancer chemopreventive agents in women at high risk with biomarkers as surrogate endpoints for activity. Clin Cancer Res. 2004; 10(24):8332–8340 [DOI] [PubMed] [Google Scholar]
- 22. Baker SG. Paradoxes in carcinogenesis should spur new avenues of research: an historical perspective. Disruptive Sci and Technol.. 2012;1(2): 100–107. [Google Scholar]
- 23. Dunn BK, Akpa E. Biomarkers as surrogate endpoints in cancer trials. Semin Oncol Nurs. 2012; 28(2):99–108 [DOI] [PubMed] [Google Scholar]
- 24. Lam S, leRiche JC, McWilliams A, et al. A randomized phase IIb trial of pulmicort turbuhaler (budesonide) in people with dysplasia of the bronchial epithelium. Clinical Cancer Research. 2004; 10(19):6502–6511 [DOI] [PubMed] [Google Scholar]
- 25. The Alpha-Tocopherol Beta Carotene Cancer Prevention Study Group The effect of vitamin E and beta carotene on the incidence of lung cancer and other cancers in male smokers. N Engl J Med. 1994; 330(15):1029–1103 [DOI] [PubMed] [Google Scholar]
- 26. Prentice RL. Surrogate endpoints in clinical trials: definitions and operational criteria. Stat Med. 1989; 8(4):431–440 [DOI] [PubMed] [Google Scholar]
- 27. Buyse M, Molenberghs G. Criteria for the validation of surrogate endpoints in randomized experiments. Biometrics. 1998; 54(3):1014–1029 [PubMed] [Google Scholar]
- 28. Jeon JW, Chung HY, Bae JS. Chances of Simpson’s paradox. J. Korean Statist Soc. 1987; 16(2):117–125 [Google Scholar]
- 29. Baker SG, Kramer BS. Good for women, good for men, bad for people: Simpson’s paradox and the importance of sex-specific analysis in observational studies. J Womens Health Gend Based Med. 2001; 10(9):867–872 [DOI] [PubMed] [Google Scholar]
- 30. Wainer H. The BK-plot: making Simpson’s paradox clear to the masses. Chance. 2002; 15(3):60–62 [Google Scholar]
- 31. Baker SG, Kramer BS. A perfect correlate does not a surrogate make. BMC Med Res Methodol. 2003; 3–16 [DOI] [PMC free article] [PubMed] [Google Scholar]
- 32. Frangakis CE, Rubin DB. Principal stratification in causal inference. Biometrics. 2002; 58(1)21–29 [DOI] [PMC free article] [PubMed] [Google Scholar]
- 33. Freedman L. Commentary on assessing surrogates as trial endpoints using mixed models. Stat Med. 2005; 24(2):183–185 [DOI] [PubMed] [Google Scholar]
- 34. Hernan MA. The hazards of hazard ratios. Epidemiology. 2010; 21(1):13–15 [DOI] [PMC free article] [PubMed] [Google Scholar]
- 35. Schwartz LM, Woloshin S, Dvorin EL, Welch HG. Ratio measures in leading medical journals: structured review of accessibility of underlying absolute risks. Br Med J. 2006; 333 1248 [DOI] [PMC free article] [PubMed] [Google Scholar]
- 36. Forrow L, Taylor WC, Arnold RM. Absolutely relative: how research results are summarized can affect treatment decisions. Am J Med. 1992; 92(2):121–124 [DOI] [PubMed] [Google Scholar]
- 37. Naylor C, Chen E, Strauss B. Measured enthusiasm: does the method of reporting trial results alter perceptions of therapeutic effectiveness?. Ann Intern Med. 1992; 117(11):916–921 [DOI] [PubMed] [Google Scholar]
- 38. Malenka DJ, Baron JA, Johansen S, Wahrenberger JW, Ross JM. The framing effect of relative and absolute risk. J Gen Intern Med. 1993; 8(10):543–548 [DOI] [PubMed] [Google Scholar]
- 39. Sargent DJ, Wieand S, Haller DG, et al. Disease-free survival (DFS) vs. overall survival (OS) as a primary endpoint for adjuvant colon cancer studies: individual patient data from 20,898 patients on 18 randomized trials. J Clin Oncol. 2005; 23(34):8664–8670 [DOI] [PubMed] [Google Scholar]
- 40. Buyse M, Burzykowski T, Carroll K, et al. Progression-free survival is a surrogate for survival in advanced colorectal cancer. J Clin Oncol. 2007; 25(33):5218–5224 [DOI] [PubMed] [Google Scholar]
- 41. Meta-Analysis Group in Cancer Modulation of fluorouracil by leucovorin in patients with advanced colorectal cancer: an updated meta-analysis. J Clin Oncol. 2004; 22(18):3766–3775 [DOI] [PubMed] [Google Scholar]
- 42. Burzykowski T, Molenberghs G, Buyse M. The validation of surrogate end points by using data from randomized clinical trials: a case-study in advanced colorectal cancer. J R Stat Soc (A). 2004; 167(1):103–124 [Google Scholar]
- 43. Ellenberg SS. Surrogate endpoints. Br J Cancer. 1993; 68(3):457–459 [DOI] [PMC free article] [PubMed] [Google Scholar]
Associated Data
This section collects any data citations, data availability statements, or supplementary materials included in this article.