

Dear Editor,
Members of Foxa transcription factor family, namely Foxa1, Foxa2, and Foxa3, play crucial roles in guiding hepatic differentiation and hepatic homeostatic maintenance (Le Lay and Kaestner, 2010; Zaret and Carroll, 2011). They act at several critical time points to regulate hepatic differentiation as early as embryonic definitive endoderm (DE) stage (Gualdi et al., 1996). Combination of both Foxa1 and Foxa2 was required for the formation of foregut DE cells and the further liver bud differentiation during embryonic hepatic development (Lee et al., 2005). Foxa proteins can bind the condensed chromatin of Alb1 enhancer and induce local chromatin relaxation prior to the initiation of transcription (Cirillo et al., 2002). The binding of Foxa on Alb1 enhancer before transcription activation determined the developmental competence by pre-marking the chromatin. Thus, Foxa proteins were proposed to behave as pioneer factors in DE to prime hepatic genes prior to their actual transcription activation in nascent liver (Zaret and Carroll, 2011).
Although Foxa2 binding profiles were extensively mapped in adult liver cells using ChIP-sequencing (ChIP-seq) technology (Wederell et al., 2008; Tuteja et al., 2009; Wallerman et al., 2009; Hoffman et al., 2010), binding profile of Foxa proteins at the embryonic DE stage has not been obtained yet. Functions of Foxa family have been known with significant differences between embryonic hepatic developing stage and post-developing stage (Cirillo et al., 2002; Li et al., 2011). Therefore, a systematic analysis of Foxa binding at the DE stage will help elucidate its functions at early hepatogenesis stage.
We first established a protocol to efficiently differentiate ES cells to DE cells and then early hepatic cells. DE cell fate commitment was confirmed by qPCR and FACS assays and in vitro hepatic differentiation analysis (Supplementary Figure S1).
The obtained DE cells were used to map Foxa2 binding sites by ChIP-seq. We obtained 4.2 million reads, and 36675 peaks were generated by Model-based Analysis of ChIP-seq (MACS) program after aligning these reads to the mouse genome and retrieving only the unique reads (Figure 1A) (Zhang et al., 2008). To verify the peaks, ChIP-qPCR assays were performed. Twenty-eight out of 30 randomly selected peak sites were positive for Foxa2 binding, while all 21 randomly selected non-peak sites were negative (Supplementary Figure S2A and B), proving the specificity of the ChIP-seq results. Motif analysis showed that all of the five top scored motifs were consistent with previously documented Foxa2 binding sites (Supplementary Figure S2C) (Tuteja et al., 2009; Hoffman et al., 2010). After mapping the enriched peaks to ±50 kb of transcription start sites of the nearest RefSeq genes, 8495 genes were identified as the candidate target genes for Foxa2 in DE.
Figure 1.
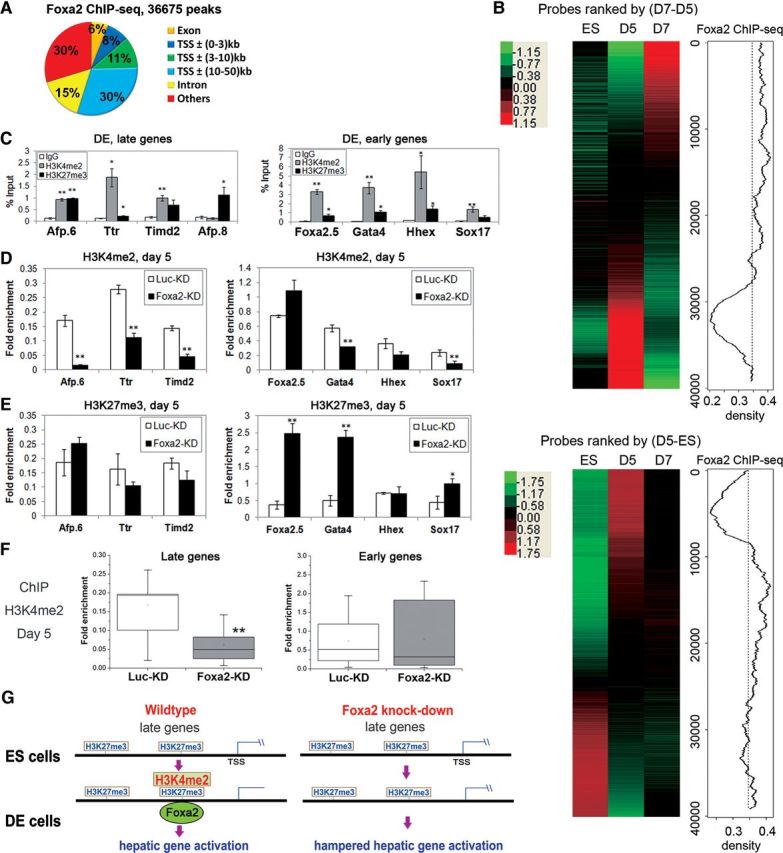
Foxa2 correlated with active histone modification to direct liver specification. (A) Distribution of Foxa2 ChIP-seq peaks mapped to the RefSeq genes. (B) Gene probes were rank-ordered by the degree of induction (red) and repression (green) between day 5 cells (D5) and day 7 cells (D7) (upper left), or between ES cells (ES) and D5 (lower left). The right plots showed moving average of probe frequencies for Foxa2-bound genes in a 2000-probe sliding window. The dashed lines indicated the expected average. (C) ChIP assays were performed on late and early genes using H3K4me2, H3K27me3 antibodies and IgG in MACS-sorted CXCR4+c-kit+ DE cells at day 5. The relative binding level of each factor on the sites was analyzed by qPCR and normalized to the Input DNA (shown as mean ± SEM; n= 3). Afp.8 is a site not occupied by Foxa2. ChIP assays were performed on late and early genes using antibodies against H3K4me2 (D) or H3K27me3 (E) and IgG as control in day 5 cells differentiated from Luciferase-KD (Luc-KD) or Foxa2-KD ES cells. The relative binding level of each factor on each site was analyzed by qPCR and normalized to that on calibrator site (Gapdh for H3K4me2, p16 for H3K27me3) to facilitate cross-cell comparisons (shown as mean ± SEM; n= 3). (F) The same ChIP assays in D were performed on 11 late genes and 11 early genes. The results were summarized in box plots. Whiskers corresponded to the largest and smallest observations. The bottom and top of the box and the middle line corresponded to lower quartile, upper quartile, and median, respectively. *P< 0.05, **P< 0.01 in C–F. (G) A schematic model indicating functions of Foxa2 in hepatic differentiation.
In order to gain a genome-wide view on how Foxa2 affected the expression of its target genes, samples from three time points during differentiation process were taken for microarray analysis: day 0 representing ES cells (no Foxa2 expression), day 5 representing DE cells, and day 7 representing early hepatic cells. Two comparisons were made with the microarray data sets: (i) between ES cells and DE cells; and (ii) between DE cells and early hepatic cells (Figure 1B). Furthermore, the up-regulated genes obtained from the above two comparisons were mapped to the pool of Foxa2 target genes identified by ChIP-seq (Figure 1B). Seven hundred and ninety-four Foxa2-bound genes displayed higher transcription levels at the hepatic cell stage after the DE stage, though all DNA binding by Foxa2 happened at the DE stage. Late activation of these genes was statistically significant as shown by parametric analysis of gene expression (PAGE) (Supplementary Table S1) (Kim and Volsky, 2005). Our results indicated that activation of many Foxa2 target genes indeed happened later than the Foxa2 binding and revealed a widely existing uncoupling between promoter/enhancer occupation and immediate transcription activation during the process of hepatic differentiation, consistent with previous observations made on Alb1 gene activation (Gualdi et al., 1996).
Previously, Foxa binding was suggested to correlate with histone H3 lysine 4 di-methylation (H3K4me2) in human cancer cell lines (Lupien et al., 2008). In order to investigate whether the binding of Foxa2 at the DE stage could also be related to certain histone modifications, we assessed the histone modification status on Foxa2 target genes in DE cells. Genes such as Afp, Ttr, and nine other genes, whose promoter/enhancers were occupied by Foxa2 at the DE stage, and transcription activation occurred at early hepatic cell stage, were categorized as ‘late genes’ (Supplementary Figure S3A and C); genes whose expression levels were concomitantly up-regulated with Foxa2 binding at the DE stage, such as Foxa2, Gata4, and nine other genes, were grouped as ‘early genes’ (Supplementary Figure S3B and D). Histone H3 acetylation (H3ac) status on all of these genes in DE cells was first examined. H3ac around Foxa2 binding sites could only be detected on the ‘early genes’, but not on the ‘late genes’ (Supplementary Figure S4A). Next, histone H3 methylation status on these genes was examined. High levels of both H3K4me2 and H3K27me3 were detected on the ‘late genes’ around Foxa2 recognition sites (Figure 1C). In ES cells, where Foxa2 was not expressed, only repressive H3K27me3 modification, but not H3K4me2, was detected on ‘late genes’ (Supplementary Figure S5). In contrast, both H3K4me2 and H3K27me3 were present on ‘early genes’ in ES cells (Supplementary Figure S5). Sequential-ChIP assay results suggested that H3K4me2, H3K27me3 and Foxa2 binding occurred on the same promoter/enhancer, but not from several distinct cell populations (Supplementary Figure S6). Next, we generated Foxa2 knock-down (Foxa2-KD) ES cells and induced these cells to differentiate into DE cells. Foxa2-KD resulted in significantly reduced levels of H3K4me2, but not H3K27me3, only on ‘late genes’ (Figure 1D and E). On ‘early genes’, no consistent pattern of H3K4me2 changes could be found upon Foxa2-KD (Figure 1D). H3K27me3 levels were significantly increased in Foxa2-KD cells (Figure 1E), and H3ac levels were not changed upon Foxa2-KD (Supplementary Figure S4B). Statistical analysis from 11 ‘late genes’ and 11 ‘early genes’ showed a significant reduction in H3K4me2 levels on ‘late genes’ upon Foxa2-KD, but not on ‘early genes’ (Figure 1F). These results suggested that knocking-down Foxa2 specifically affected H3K4me2 levels on ‘late genes’ during hepatic specification. Taken together, our results suggested that Foxa2 may prime the hepatic genes at the DE stage by either inducing or stabilizing H3K4me2 modification on ‘late genes’ to direct the cells toward hepatic cell fate commitment (Figure 1G). These findings will help us further understand the hepatic cell fate determination from DE cells in vivo, and guide directed hepatic lineage specification in vitro to obtain cells for potential regenerative medicine.
[Supplementary material is available at Journal of Molecular Cell Biology online. We thank Dr Wang Gang for providing the plasmid pSIREN-RetroQ, and Dr Jing Naihe for critical reading of the manuscript. This work was supported by National Key Basic Research and Development Program of China (2011CB966200, 2009CB941100, 2010CB945600, 2011CB504206, and 2012CB722306); National Natural Science Foundation of China (30623003, 30801115, 30890033, 30901449, 31171420, and 91019019); Chinese Academy of Sciences (XDA01010204, XDA01010303, KSCX1-YW-R-40, KSCX2-EW-J-15, KSCX2-EW-R-02, and KSCX2-YW-R-49); One Hundred Talents Program of Chinese Academy of Sciences to P.H.; Chinese National 863 Plan Project (2006AA02Z474); National Institutes of Health Grant (DK074561 and AI065565 to X.W.).]
References
- Cirillo L.A., Lin F.R., Cuesta I., et al. Opening of compacted chromatin by early developmental transcription factors HNF3 (FoxA) and GATA-4. Mol. Cell. 2002;9:279–289. doi: 10.1016/s1097-2765(02)00459-8. [DOI] [PubMed] [Google Scholar]
- Gualdi R., Bossard P., Zheng M., et al. Hepatic specification of the gut endoderm in vitro: cell signaling and transcriptional control. Genes Dev. 1996;10:1670–1682. doi: 10.1101/gad.10.13.1670. [DOI] [PubMed] [Google Scholar]
- Hoffman B.G., Robertson G., Zavaglia B., et al. Locus co-occupancy, nucleosome positioning, and H3K4me1 regulate the functionality of FOXA2-, HNF4A-, and PDX1-bound loci in islets and liver. Genome Res. 2010;20:1037–1051. doi: 10.1101/gr.104356.109. [DOI] [PMC free article] [PubMed] [Google Scholar]
- Kim S.Y., Volsky D.J. PAGE: parametric analysis of gene set enrichment. BMC Bioinformatics. 2005;6:144. doi: 10.1186/1471-2105-6-144. [DOI] [PMC free article] [PubMed] [Google Scholar]
- Le Lay J., Kaestner K.H. The Fox genes in the liver: from organogenesis to functional integration. Physiol. Rev. 2010;90:1–22. doi: 10.1152/physrev.00018.2009. [DOI] [PubMed] [Google Scholar]
- Lee C.S., Friedman J.R., Fulmer J.T., et al. The initiation of liver development is dependent on Foxa transcription factors. Nature. 2005;435:944–947. doi: 10.1038/nature03649. [DOI] [PubMed] [Google Scholar]
- Li Z., Schug J., Tuteja G., et al. The nucleosome map of the mammalian liver. Nat. Struct. Mol. Biol. 2011;18:742–746. doi: 10.1038/nsmb.2060. [DOI] [PMC free article] [PubMed] [Google Scholar]
- Lupien M., Eeckhoute J., Meyer C.A., et al. FoxA1 translates epigenetic signatures into enhancer-driven lineage-specific transcription. Cell. 2008;132:958–970. doi: 10.1016/j.cell.2008.01.018. [DOI] [PMC free article] [PubMed] [Google Scholar]
- Tuteja G., White P., Schug J., et al. Extracting transcription factor targets from ChIP-Seq data. Nucleic Acids Res. 2009;37:e113. doi: 10.1093/nar/gkp536. [DOI] [PMC free article] [PubMed] [Google Scholar]
- Wallerman O., Motallebipour M., Enroth S., et al. Molecular interactions between HNF4a, FOXA2 and GABP identified at regulatory DNA elements through ChIP-sequencing. Nucleic Acids Res. 2009;37:7498–7508. doi: 10.1093/nar/gkp823. [DOI] [PMC free article] [PubMed] [Google Scholar]
- Wederell E.D., Bilenky M., Cullum R., et al. Global analysis of in vivo Foxa2-binding sites in mouse adult liver using massively parallel sequencing. Nucleic Acids Res. 2008;36:4549–4564. doi: 10.1093/nar/gkn382. [DOI] [PMC free article] [PubMed] [Google Scholar]
- Zaret K.S., Carroll J.S. Pioneer transcription factors: establishing competence for gene expression. Genes Dev. 2011;25:2227–2241. doi: 10.1101/gad.176826.111. [DOI] [PMC free article] [PubMed] [Google Scholar]
- Zhang Y., Liu T., Meyer C.A., et al. Model-based analysis of ChIP-Seq (MACS) Genome Biol. 2008;9:R137. doi: 10.1186/gb-2008-9-9-r137. [DOI] [PMC free article] [PubMed] [Google Scholar]