Abstract
Purpose: To characterize and quantify free breathing lung tissue motion distributions.
Methods: Forty seven patient data sets were acquired using a 4DCT protocol consisting of 25 ciné scans at abutting couch positions on a 16-slice scanner. The tidal volume of each scan was measured by simultaneously acquiring spirometry and an abdominal pneumatic bellows. The concept of a characteristic breath was developed to manage otherwise natural breathing pattern variations. The characteristic breath was found by first dividing the breathing traces into individual breaths, from maximum exhalation to maximum exhalation. A linear breathing drift model was assumed and the drift removed for each breath. Breaths that exceeded one standard deviation in period or amplitude were removed from further analysis. A characteristic breath was defined by normalizing each breath to a common amplitude, aligning the peak inhalation times for all of the breaths, and determining the average time at each tidal volume, keeping inhalation and exhalation separate. Breathing motion trajectories were computed using a previously published five-dimensional lung tissue trajectory model which expresses the position of internal lung tissue, , as: where is the internal lung tissue position at zero tidal volume and zero airflow, the scalar values v and f are the measured tidal volume and airflow, respectively, and the vectors and are fitted free parameters. In order to characterize the motion patterns, the trajectory elongations were examined throughout the subject's lungs. Elongation was defined here by generating a rectangular bounding box with one side parallel to the vector and the box oriented in the plane defined by the and motion vectors. Hysteresis motion was defined as the ratio of the box dimensions aligned orthogonal to and parallel to the vector. The 15th and 85th percentile of the elongation were used to characterize tissue trajectory hysteresis.
Results: The 15th and 85th percentile bounding box elongations were 0.090 ± 0.005 and 0.083 ± 0.013 in the upper left lung and 0.187 ± 0.037 and 0.203 ± 0.053, in the lower left lung. The 15th and 85th percentiles for the upper right lung were 0.092 ± 0.006 and 0.085 ± 0.013, and 0.184 ± 0.038, and 0.196 ± 0.043 in the lower right lung. Both percentiles were calculated for tidal volume displacements between 5 and 15 mm. In the left lung, the average elongations in the upper and lower lung were and , respectively. The average elongations in the upper and lower right lung were and , respectively. The elongation varied smoothly throughout the lungs.
Conclusions: The hysteresis motion was relatively small compared to the volume-filling motion, contributing between 8% and 20% of the overall motion. Statistically significant differences were observed in the range of hysteresis contribution for upper and lower lung regions. The characteristic breath process provided an excellent method for defining an average breath. The characteristic breath had continuous tidal volume and airflow characteristics when the breath was continuously repeated,useful for generating patterns representative of realistic motion for breathing motion studies.
Keywords: 4DCT, Lung, Hysteresis
INTRODUCTION
Low et al.1 has hypothesized that breathing motion hysteresis is caused by the distribution of internal lung pressure imbalances during breathing. To arrive at their breathing motion model, a few assumptions were made for quiet respiration. The pressure imbalances were assumed to be proportional to the vacuum developed to generate inspiration and the vacuum was itself proportional to the airflow. Hysteresis motion magnitudes were assumed to be proportional to the airflow. The breathing motion model assumed that the motion component due to tidal volume fluctuations was independent of the motion component due to airflow variations. As a consequence of this assumption, hysteresis motion due to pressure imbalances would occur with the same magnitude regardless of whether the subject was near peak inhalation or exhalation. Similarly, the tidal volume lung expansion component at a specific point in time would not depend on the breathing rate.
In respiratory physiology, hysteresis is defined as the difference between the transpulmonary pressure of inhalation (increasing volume) and the pressure of exhalation (decreasing volume).2 Transpulmonary pressure is defined as the difference between the alveolar pressure and the pleural pressure within the lung, which is not equally distributed throughout the lung. Therefore hysteresis is not equivalent at every point. The heterogeneous distribution in the transpulmonary pressure was first proposed to be caused by the distension of internal air spaces by the elastic forces surrounding the tissue.3 Based on an idealized phantom of lung parenchyma, they suggested that tissue in the lung uniformly expanded with volume. The phantom was an enlarged alveolar geometry consisting of a rigid frame enclosed with latex to form a membrane. Known volumes of air were introduced into the phantom and the resulting membrane displacement was observed. Lambert et al.4 expanded these findings to nonidealized situations by developing a mathematical model of the parenchyma utilizing the pressure and volume as metrics to calculate tissue stress, which they called tissue elasticity. The tissue elasticity was subsequently shown to be uneven throughout the parenchyma.5, 6, 7 Attempts to model the imperfect elasticity of the lung were made with nonlinear models7, 8, 9, 10, 11 and stress force heterogeneity of parenchyma strips.12, 13, 14, 15
Advances in radiation therapy imaging enabled Seppenwoolde et al.16 to perform real time measurements of gold markers implanted in the lung. The trajectories of the gold markers were observed and the marker paths were modeled as even power cosine functions in time, one for each orthogonal direction. They described the phase difference between the two paths as the magnitude of hysteresis. While the authors stressed they were not proposing a respiratory model, they discussed the possibility of modeling respiration as a function of time. However, because of breathing pattern irregularities, time alone was insufficient to model lung tissue motion.
The transport of gas within the lung exhibits simultaneous diffusion and convection which Paiva17 proposed to be a function of tidal volume, airflow, and respiratory period. The solution was based on matter balance for an infinitesimally small volume. He claimed that inhomogeneous lung ventilation was most likely caused by the irregular dichotomy of the bronchial tree.
While these studies attempted to characterize and quantify lung tissue motion during free breathing, they fell short in achieving a comprehensive characterization metric. Construction of a comprehensive characterization metric would account for the large variability in period and amplitude during the observational period. We propose instead a method to create a single characteristic breath that maintains the underlying respiratory patterns of the subject during the observational period. With the characteristic breath we will construct characteristic trajectories for each lung tissue voxel during the observational period that mirrors the breath to breath lung tissue trajectories. Our characterization metric will provide a quantitative tool to create realistic and repeatable patient specific breathing patterns that can be used, for example, to drive dynamic lung phantoms. We will employ the characteristic breath, along with the measured motion model parameters, to determine the relative amount of hysteresis in lung tissue motion patterns.
METHODS AND MATERIALS
Data acquisition
This study recruited 47 patients on an IRB approved clinical trial; each imaged using a 4DCT protocol conducted on a 16-slice CT scanner (Philips 16-slice Brilliance CT). The patient cohort contained 26 lung cancer patients and 21 nonlung cancer patients. The protocol called for 25 ciné scans at abutting couch positions to image the lungs, using 0.75 mm thick slices. Each couch position took 18.2 s to acquire all 25 scans. The images were reconstructed using a 512 × 512 voxel matrix and an inplane field of view of 50 cm. The slice thickness was 1.5 mm. The duration of recorded breathing data collected for each scanning session was in excess of 300 s.
The tidal volume was simultaneously monitored using a spirometer and an abdominal pneumatic bellows. The spirometer (Interface Associates, Aliso Viejo, CA, VMM 400) was sampled at a rate of 100 Hz and with a 1 ml tidal volume resolution. To account for known spirometer instrumental signal drift,18, 19, 20 an abdominal pneumatic belt (Philips Medical Systems, Cleveland, OH), known as the bellows, was used as an independent metric. An illustration of the experimental setup can be viewed in Fig. 1 of Lu et al.19 A pressure transducer measured the pressure change inside the belt during inhalation and exhalation. The relationship between the bellows and spirometer was found to be highly correlated by Werner et al.21 over a time period equal to the time to scan a single couch position; 18.2 s. A linear drift correction was independently applied to the spirometer signal for each segment and used to convert the bellows signal into tidal volume.21
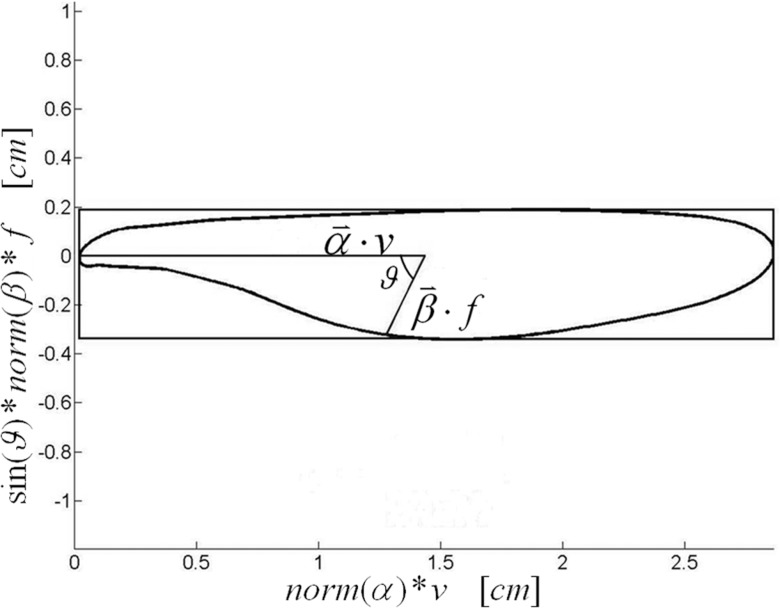
Figure 1.
The tissue trajectory was calculated by the and vectors scaled by v and f, respectively, which was calculated from the characteristic breath, and the angle between and , ϑ.
Airflow was calculated from tidal volume with a first order time derivative. The tidal volume was smoothed using a moving fifth order polynomial fit to reduce sampling noise. The polynomial order was selected based on observing no substantial improvement for using higher order polynomial fits. An analytical derivative of the tidal volume was calculated over a period of one gantry rotation centered on the point where the airflow was determined.
Characteristic breath
In order to characterize the average motion of lung tissue during respiration, the concept of a characteristic breath was developed. The characteristic breath was calculated from the respiratory signal as measured by the bellows, the absolute breathing amplitude being unnecessary for the subsequent analysis. The signal was segmented into individual breaths from maximum exhalation to maximum exhalation. Each breath was normalized to maximum inhalation, shifted in time to align at maximum inhalation, and linearly corrected for physiologic drift such that the beginning and end tidal volumes were equal and zero. Breaths exceeding one standard deviation in period or amplitude from their respective means were removed from subsequent analysis. One standard deviation was selected to conservatively exclude breathing outliers from the definition of the characteristic breath. The breaths were further subdivided into inhale and exhale components. This process resulted in a set of superimposed normalized breaths coincident in both amplitude and time at peak inhalation, and having zero amplitude at exhalation. The characteristic breath was defined as the average of the breaths in time at each tidal volume, separately determined during inhalation and exhalation. The airflow was calculated by a first-order time derivative of the characteristic breath. The characteristic breath provided the airflow and tidal volume samples that, along with the 5D breathing motion model, provided the hysteresis evaluation.
Five-Dimensional breathing motion model
In 2005, Low et al.1 proposed a motion model that employed tidal volume and airflow as measurable surrogates for the breathing cycle. The breathing motion model described the position of internal lung tissue as a function of tidal volume (v) and air flow (f) for tissue positioned at .during tidal exhalation, v = f = 01
| (1) |
where accounted for motion due to lung filling, and described the hysteresis motion component. While time was not explicitly expressed in the model, it was implicitly considered in the time dependence of the tidal volume and airflow. The coefficients and were determined using measured tissue positions acquired by conducting deformable image registration on 4DCT images that were acquired with simultaneous quantitative spirometry. The model has been used to evaluate both tumor and normal lung tissue motion and initial indications show the model to be sensitive to radiation-induced tissue changes.22
The breathing motion model employed two vector fields, and , that, along with the breathing waveform, were used to describe the lung tissue motion during breathing. and , were not in and of themselves sufficient to provide a description of the motion. In order to visualize and analyze the complex nature of breathing motion, some simplification was required. In this work, we elected to define a characteristic breath as a breath that began and ended at the same tidal volume (defined as 0 ml) with zero airflow. The breath had also to be truly characteristic of the patient's breathing cycle and therefore the breath had to be derived from the patient's breathing cycles. The second simplification was in the description of the breathing motion pattern. The characteristic breath allowed, along with and , the generation of a single, closed path for each tissue voxel.
Image registration
Deformable image registration was used to map the motion of each tissue region. The image reconstructed at a tidal volume closest to end exhalation was employed as the reference scan. A fast normalized cross-correlation (NCC) method23 was used with a 11 × 11 × 10 pixel cube centered on each voxel, corresponding to a volume of 10.7 × 10.7 × 15 mm3. The center voxel was searched for in the bounded region for each scan. Each voxel in the nonreference image was searched for in the bounded region centered on the spatial location corresponding to the reference image. The bounded region was sufficiently large enough to contain the voxel in question. Image datasets were reconstructed with percentile tidal volumes corresponding to the percentage of time the surrogate measured a particular volume. Each breath has different inhalation and exhalation volumes. Exhalation (i.e., zero volume) was defined as the 5th percentile, v5, meaning the tidal volume was less than this value 5% of the time during the scanning session. Inhalation was defined as the 85th percentile tidal volume; v85. The reference image was chosen to be the scans closest to exhalation. The total tidal volume difference between successive scans was less than 100 ml, which corresponded to less than 8 mm of tissue motion. The search was first conducted with the scan nearest to tidal exhalation. Once the vector deformation map between that scan and the reference was determined, the next scan was selected. Rather than start the search assuming that the third scan had the same deformation as the second, the second was extrapolated by the ratio of tidal volumes to provide the initial search space for the third scan. This process was repeated separately for the scans acquired during inhalation and scans acquired during exhalation.
Once the registrations were completed, the 5D breathing motion model was fit to the motion data using a Nelder-Mead Optimization Algorithm24 where the root mean least square distance between the measurements and the fitting of the breathing motion model was defined as:22
| (2) |
where , vi, and fi were the tissue position, tidal volume, and airflow for the ith scan. The , , and vectors in space ℜ3 were the fitting parameters. The angle ϑ between and was determined with the expression
| (3) |
Lung tissue elongation
The phase difference between the volume and flow allowed the 5D breathing motion model to describe the complex lung tissue motion paths, but made a straightforward description of those paths challenging. Given the inherent complexity of the trajectories, we elected to describe the hysteresis behavior by building a bounding box around the closed trajectory, with one edge of the box parallel to (termed the parallel side), the box lying in the plane of the and vectors, and whose width and length just encompassed the trajectory. The ratio of perpendicular to parallel box dimensions were defined as the tissue trajectory elongation ζ. An illustration of the elongation geometry and terms can be seen in Fig. 1. For example, when and were orthogonal, the elongation was
| (4) |
Lung subdivision
Breathing motion magnitudes and characteristics are known to be functions of the location within the lungs. Most lung tissue motion has been shown to be oriented in the superior-inferior direction and the magnitude of the motion is greater in the inferior lung.16 The contribution of hysteresis is also expected to differ as a function of the position within the lungs. The apex of the lung should display an increased elongation as the motion in the superior-inferior direction is constrained. Furthermore the presence of varying types of tissue, such as a localized tumor, should have an effect on the relative contribution of hysteresis to the trajectory of the tissue.
Differences also exist between the right and the left lungs. The left lung contains two lobes compared to the three lobes of the right lung. The right lung is shorter than the left lung in the cranial caudal direction but wider in the lateral direction. Overall the total volume capacity of the right lung is typically greater than the capacity of the left lung. The Ansari-Bradley test was used to test the spread of the lung tissue elongation distribution compared to a lognormal distribution. The lung tissue elongation for the upper and lower lung was tested with a Kruskal-Wallis ANOVA test to determine if a significant difference existed between the right and left lung at the 95% confidence interval. The tissue elongations of the right and left lung, as well as the superior and inferior portions of the lungs, were independently analyzed to identify spatial hysteresis differences. Tissues with displacements of less than 5 mm were excluded from the analysis. To further characterize the tissue elongation, the 15th and 85th percentile values were reported to illustrate the small and large elongations, respectively.
RESULTS
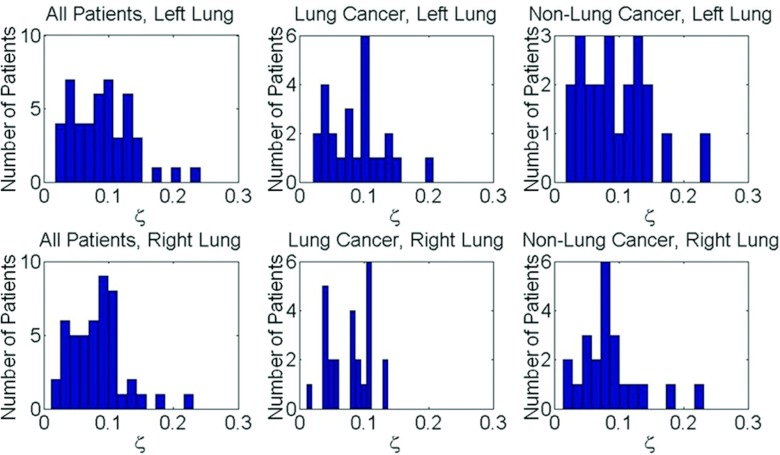
An Ansari-Bradley Test found the lung tissue elongation had a lognormal distribution (). The average elongation in the upper and lower halves of the left lung were and , respectively. The average elongation in the upper and lower halves of the left lung were and . The average elongation in the upper and lower halves of the right lung were and . In each lung and sub-region the elongation trend decreased for increasing tissue displacement. The 15th percentile elongations were 0.090 ± 0.005 and 0.083 ± 0.013 in the upper and lower left lung, respectively, and 0.092 ± 0.006 and 0.085±0.013 in the upper and lower right lung, respectively, for motion magnitudes between displacements of 5 mm and 15 mm. The 85th percentile elongations were 0.187 ± 0.037 and 0.203 ± 0.053 in the upper and lower left lung, respectively, and 0.184 ± 0.038 and 0.196 ± 0.043 in the upper and lower right lung, respectively, for motion magnitudes between 5 mm and 15 mm. A summary of the elongation distribution at the 15th and 85th percentiles for tissue displacements up to 25 mm can be seen in Table 1. In each lung and sub-region, the elongation decreased with increasing tissue displacement. A Kruskal-Wallis ANOVA test found statistically significant differences between the lung tissue elongation in the upper and lower portions of the left lung (p = 0.009) for 85% of patients and the right lung (p = 0.018) in 83% of patients. The lung tissue elongation in both the upper and lower right and left lungs were found to be similar (p = 0.355) for the majority of the patients. Table 2 reports the percentage of patients displaying a statistically different comparison between the lung sub-regions. Figure 2 displays the distribution of maximum tissue displacement and the elongation distribution at increasing tissue motion intervals for all patients. The elongation distribution for lung cancer and nonlung cancer patients is illustrated in Fig. 3 for the right and left lungs.
Table 1.
Summary of the 15th and 85th percentile lung tissue elongation for increasing tissue displacement in each lung sub-region.
| Tissue | Left upper lung |
Left lower lung |
Right upper lung |
Right lower lung |
||||
|---|---|---|---|---|---|---|---|---|
| displacement (mm) | 15th | 85th | 15th | 85th | 15th | 85th | 15th | 85th |
| 5–7.5 | 0.097 | 0.238 | 0.099 | 0.271 | 0.098 | 0.239 | 0.102 | 0.252 |
| 7.5–10 | 0.088 | 0.187 | 0.086 | 0.215 | 0.089 | 0.177 | 0.089 | 0.204 |
| 10–12.5 | 0.091 | 0.172 | 0.079 | 0.178 | 0.084 | 0.162 | 0.077 | 0.172 |
| 12.5–15 | 0.085 | 0.150 | 0.069 | 0.148 | 0.095 | 0.158 | 0.072 | 0.155 |
| 15–17.5 | 0.094 | 0.156 | 0.070 | 0.138 | 0.098 | 0.164 | 0.060 | 0.134 |
| 17.5–20 | 0.072 | 0.143 | 0.066 | 0.130 | 0.108 | 0.173 | 0.056 | 0.117 |
| 20–22.5 | 0.081 | 0.121 | 0.063 | 0.117 | 0.114 | 0.199 | 0.054 | 0.115 |
| 22.5–25 | 0.089 | 0.169 | 0.064 | 0.121 | 0.121 | 0.216 | 0.058 | 0.124 |
Table 2.
Percentage of cases showing significant difference between the respective comparisons.
| Lung sub-region comparison | Upper left vs lower left | Upper right vs lower right | Upper left vs upper right | Lower left vs lower right |
|---|---|---|---|---|
| Statistically different at 95% CI | 85% | 83% | 35% | 22% |
Figure 2.
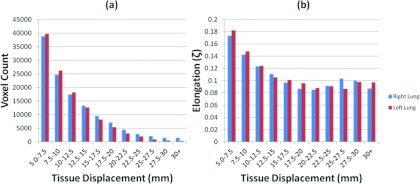
Histograms displaying the distribution of the tissue displacement (a) and the distribution of the elongation at increasing tissue motion intervals (b).
Figure 3.
Histograms summarizing the average distribution of the tissue elongation for the left and right lung across lung cancer, nonlung cancer, and combined patient data sets.
DISCUSSION
The characteristic breath method consistently produced a single breath that was highly representative of the breaths measured during the collection duration. An observable respiratory pattern was displayed in the characteristic breath. Figure 4 shows four examples of the characteristic breath for three lung cancer patients, one patient was imaged twice. The patient who was imaged twice [Figs. 4a, 4b] had similar characteristic breaths in both sessions. The sessions occurred two weeks apart but the characteristic breaths had similar respiratory patterns. The characteristic breaths of this patient had a strikingly different pattern than the two other examples shown in Figs. 4c, 4d. There was a unique characteristic breath for each patient.
Figure 4.
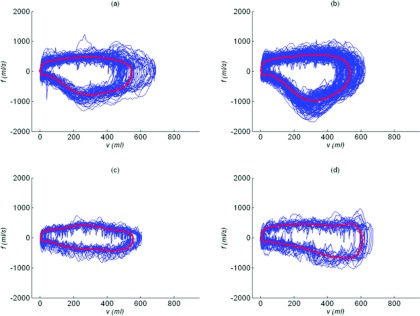
Airflow vs tidal volume relationships for the entire breathing session and the unique characteristic breath for one patient imaged in two separate sessions (a) and (b) and two additional patients (c) and (d).
The elongation distribution throughout the lung displayed characteristics that differed in the presence of lung cancer. Figure 5 displays two examples of lung cancer and two examples of nonlung cancer results that were typical of the observed results. The patient in Fig. 5a had a stage 1A tumor in the left upper lung in the same location as the greater elongation values. The locally greater elongation values can be seen in Fig. 5b where a stage 3A tumor was present in the right lower lung. The elongation distributions for the lung cancer patients in the local tumor region were different than for the nonlung cancer patients in similar locations. Figures 5c, 5d displays typical results for nonlung cancer patients. For these cases the elongation varied smoothly throughout the lung and did not exhibit large local variations. Despite an observable local difference, there was no statistically significant difference, at the 95% confidence interval, with respect to the average lung tissue elongation between lung cancer and nonlung cancer patients (Kruskal-Wallis test) as shown in Fig. 3. This suggests the lung compensated for the increased hysteresis of diseased tissue by reducing the hysteresis of healthy lung tissue.
Figure 5.
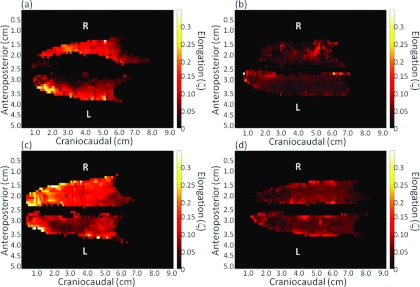
Elongation maps of different patients with (a) and (b) and without (c) and (d) lung cancer. The elongation distribution varies smoothly in the nonlung cancer patients and displays regionally high elongation at the tumor sights in the lung cancer patients.
The comparison between the upper right lung and upper left lung displayed statistically significant variation in 35% of patients. Only 22% of patients displayed a statistically significant difference between the lower right lung and lower left lung at the 95% confidence interval. This disparity between the upper and lower lung regions can be expected due to the relatively small motion magnitudes present in the upper lung compared to the lower lung.25 The motion variation was less for the lower right lung and lower left lung due to the increased motion magnitudes present there. As seen in Table 1, when the overall motion displacement increased, the average elongation was observed to decrease in magnitude. This inverse relationship shows the relative hysteresis component of lung tissue motion decreases as the motion displacement increases. When modeling lung tissue motion it would be possible to ignore hysteresis for sufficiently large displacements with only a marginal error in tissue motion characterization.
In 2008 a study by Boldea et al.26 reported hysteresis for five patients treated with external beam radiation for nonsmall cell lung cancer. They reported the hysteresis motion to be larger in the tumor volume than in healthy tissue which is in agreement with the results of this study. Furthermore the elongation was in agreement with the ratio of hysteresis magnitude to tissue trajectory length reported in previous studies.16, 27
CONCLUSIONS
The hysteresis behavior of breathing motion was analyzed using a motion model that describes breathing motion as a function of tidal volume and airflow. A characteristic breath was defined to summarize individual patient's breathing cycles in such a way that the breathing motion path could be defined without discontinuities. The elongation magnitude was relatively small, usually less than 25% of the tidal-volume generated tissue motion. Implications of these results are that in many cases, ignoring hysteresis would yield small errors in the tissue motion characterization. Therefore, when developing amplitude-based gating techniques, reviewing these data could be used to determine the consequences of ignoring hysteresis.
ACKNOWLEDGMENT
This work is supported in part by NIH R01CA096679 and R01CA116712.
References
- Low D. A. et al. , “Novel breathing motion model for radiotherapy,” Int. J. Radiat. Oncol. Biol. Phys. 63(3), 921–9 (2005). 10.1016/j.ijrobp.2005.03.070 [DOI] [PubMed] [Google Scholar]
- Bruce E. N., “Deflation-related variability of breathing pattern persists with intact upper airway,” Respir. Physiol. 106(3), 273–83 (1996). 10.1016/S0034-5687(96)00074-6 [DOI] [PubMed] [Google Scholar]
- Mead J., Takishima T., and Leith D., “Stress distribution in lungs: A model of pulmonary elasticity,” J. Appl. Physiol. 28(5), 596–608 (1970). [DOI] [PubMed] [Google Scholar]
- Lambert R. K. and Wilson T. A., “A model for the elastic properties of the lung and their effect of expiratory flow,” J. Appl. Physiol. 34(1), 34–48 (1973). [DOI] [PubMed] [Google Scholar]
- Fredberg J. J. and Stamenovic D., “On the imperfect elasticity of lung tissue,” J. Appl. Physiol. 67(6), 2408–19 (1989). [DOI] [PubMed] [Google Scholar]
- Bachofen H. and Schurch S., “Alveolar surface forces and lung architecture,” Comp. Biochem. Physiol., Part A: Mol. Integr. Physiol. 129(1), 183–93 (2001). 10.1016/S1095-6433(01)00315-4 [DOI] [PubMed] [Google Scholar]
- Suki B. and Bates J. H., “A nonlinear viscoelastic model of lung tissue mechanics,” J. Appl. Physiol. 71(3), 826–33 (1991). [DOI] [PubMed] [Google Scholar]
- Maksym G. N. and Bates J. H., “A distributed nonlinear model of lung tissue elasticity,” J. Appl. Physiol. 82(1), 32–41 (1997). [DOI] [PubMed] [Google Scholar]
- Suki B. et al. , “Biomechanics of the lung parenchyma: Critical roles of collagen and mechanical forces,” J. Appl. Physiol. 98(5), 1892–1899 (2005). 10.1152/japplphysiol.01087.2004 [DOI] [PubMed] [Google Scholar]
- Lande B. and Mitzner W., “Analysis of lung parenchyma as a parametric porous medium,” J. Appl. Physiol. 101(3), 926–933 (2006). 10.1152/japplphysiol.01548.2005 [DOI] [PubMed] [Google Scholar]
- Polak A. G. and Lutchen K. R., “Computational model for forced expiration from asymmetric normal lungs,” Ann. Biomed. Eng. 31(8), 891–907 (2003). 10.1114/1.1588651 [DOI] [PubMed] [Google Scholar]
- Yuan H., Ingenito E. P., and Suki B., “Dynamic properties of lung parenchyma: Mechanical contributions of fiber network and interstitial cells,” J. Appl. Physiol. 83(5), 1420–1431 (1997). [DOI] [PubMed] [Google Scholar]
- Maksym G. N., Fredberg J. J., and Bates J. H., “Force heterogeneity in a two-dimensional network model of lung tissue elasticity,” J. Appl Physiol 85(4), 1223–1229 (1998). [DOI] [PubMed] [Google Scholar]
- Betensley A. D. and Yankaskas J. R., “Factor viia for alveolar hemorrhage in microscopic polyangiitis,” Am. J. Respir. Crit. Care Med. 166(9), 1291–1292 (2002). [DOI] [PubMed] [Google Scholar]
- Yan X. et al. , “Variation of lung volume after fixation when measured by immersion or Cavalieri method,” Am. J. Physiol. Lung Cell. Mol. Physiol. 284(1), L242–L245 (2003). [DOI] [PubMed] [Google Scholar]
- Seppenwoolde Y. et al. , “Precise and real-time measurement of 3D tumor motion in lung due to breathing and heartbeat, measured during radiotherapy,” Int J. Radiat. Oncol., Biol., Phys. 53(4), 822–834 (2002). 10.1016/S0360-3016(02)02803-1 [DOI] [PubMed] [Google Scholar]
- Paiva M., “Gas transport in the human lung,” J. Appl. Physiol. 35(3), 401–410 (1973). [DOI] [PubMed] [Google Scholar]
- Lu W. et al. , “Comparison of spirometry and abdominal height as four-dimensional computed tomography metrics in lung,” Med. Phys. 32(7), 2351–2357 (2005). 10.1118/1.1935776 [DOI] [PubMed] [Google Scholar]
- Lu W. et al. , “A comparison between amplitude sorting and phase-angle sorting using external respiratory measurement for 4D CT,” Med. Phys. 33(8), 2964–2974 (2006). 10.1118/1.2219772 [DOI] [PubMed] [Google Scholar]
- Zhang T. et al. , “Application of the spirometer in respiratory gated radiotherapy,” Med. Phys. 30(12), 3165–71 (2003). 10.1118/1.1625439 [DOI] [PubMed] [Google Scholar]
- Werner R. et al. , “Technical note: Development of a tidal volume surrogate that replaces spirometry for physiological breathing monitoring in 4D CT,” Med Phys. 37(2), 615–619 (2010). 10.1118/1.3284282 [DOI] [PMC free article] [PubMed] [Google Scholar]
- Zhao T. et al. , “Biomechanical interpretation of a free-breathing lung motion model,” Phys. Med. Biol. 56(23), 7523–40 (2011). 10.1088/0031-9155/56/23/012 [DOI] [PMC free article] [PubMed] [Google Scholar]
- Lewis J., “Fast Template Matching. in Vision Interface '95,” Canadian Image Processing and Pattern Recognition Society, Quebec, Canada, 1995.
- Nelder J. and Mead J., “A simplex method for function minimization,” Comput. 7, 308–313 (1964). 10.1093/comjnl/7.4.308 [DOI] [Google Scholar]
- Zhao T. et al. , “Characterization of free breathing patterns with 5D lung motion model,” Med. Phys. 36(11), 5183–5189 (2009). 10.1118/1.3246348 [DOI] [PMC free article] [PubMed] [Google Scholar]
- Boldea V. et al. , “4D-CT lung motion estimation with deformable registration: Quantification of motion nonlinearity and hysteresis,” Med. Phys. 35(3), 1008–1018 (2008). 10.1118/1.2839103 [DOI] [PubMed] [Google Scholar]
- Mageras G. S. et al. , “Measurement of lung tumor motion using respiration-correlated CT,” Int. J. Radiat. Oncol., Biol., Phys. 60(3), 933–941 (2004). 10.1016/j.ijrobp.2004.06.021 [DOI] [PubMed] [Google Scholar]


