Abstract
Study Objectives:
Manual scoring of polysomnograms (PSG) is labor intensive and has considerable variance between scorers. Automation of scoring could reduce cost and improve reproducibility. The purpose of this study was to compare a new automated scoring system (YST-Limited, Winnipeg, Canada) with computer-assisted manual scoring.
Design:
Technical assessment.
Setting:
Five academic medical centers.
Participants:
N/A.
Interventions:
N/A.
Measurements and Results:
Seventy PSG files were selected at University of Pennsylvania (Penn) and distributed to five US academic sleep centers. Two blinded technologists from each center scored each file. Automatic scoring was performed at Penn by a YST Limited technician using a laptop containing the software. Variables examined were sleep stages, arousals, and apnea-hypopnea index (AHI) using three methods of identifying hypopneas. Automatic scores were not edited and were compared to the average scores of the 10 technologists. Intraclass correlation coefficient (ICC) was obtained for the 70 pairs and compared to across-sites ICCs for manually scored results. ICCs for automatic versus manual scoring were > 0.8 for total sleep time, stage N2, and nonrapid eye movement arousals and > 0.9 for AHI scored by primary and secondary American Academy of Sleep Medicine criteria. ICCs for other variables were not as high but were comparable to the across-site ICCs for manually scored results.
Conclusion:
The automatic system yielded results that were similar to those obtained by experienced technologists. Very good ICCs were obtained for many primary PSG outcome measures. This automated scoring software, particularly if supplemented with manual editing, may increase laboratory efficiency and standardize PSG scoring results within and across sleep centers.
Citation:
Malhotra A; Younes M; Kuna ST; Benca R; Kushida CA; Walsh J; Hanlon A; Staley B; Pack AI; Pien GW. Performance of an automated polysomnography scoring system versus computer-assisted manual scoring. SLEEP 2013;36(4):573-582.
Keywords: apnea-hypopnea index, lung, polysomnography, reliability, scoring, sleep
INTRODUCTION
Obstructive sleep apnea (OSA) is a common condition with major cardiovascular consequences. Symptomatic OSA was estimated by Young et al.1 to occur in 4% of North American men and 2% of North American women in 1993. However, prevalence estimates are currently much higher if only because of the increase in obesity rates since 1993,2 and the improved event detection through the use of nasal pressure.3 Thus, there is currently a large number of people with OSA, with the condition remaining undiagnosed in most cases.
As a result, efforts have been ongoing to increase the efficiency of OSA diagnosis. Home sleep testing has appeal based on perceived economic savings, but lack of adequate monitoring of the electroencephalogram (EEG) to quantify sleep time objectively may be a major drawback.4 On the other hand, adding EEG to home sleep testing would add considerable cost if the signals require manual scoring. Strategies to reduce the cost of diagnostic testing are thus imperative given the current economic challenges.
One approach to improve efficiency and reduce cost is automation of scoring. Currently, a polysomnography (PSG) technologist spends up to 2.0 hr to score an overnight sleep recording manually. Manual scoring also has considerable interscorer and intrascorer variability, making its reliability and reproducibility questionable.5–11 Thus, automation of scoring has appeal, both in terms of reducing cost and improving the reproducibility of the data used for diagnostic decisions.
Several attempts at automation have been undertaken,12 but the currently available systems have only moderate accuracy and are perceived as cumbersome and expensive. One of the authors (MY) developed an automated system of scoring that showed comparable accuracy to manual scoring using in-house testing. The Academic Alliance for Sleep Research (AASR), a consortium of academic sleep centers established to perform multicenter research studies, conducted a study to investigate interscorer variability of computer-assisted manual PSG scoring between and across sites. The results of that study are reported in a companion article.13 The AASR investigators invited YST Limited (Winnipeg, Canada) to compare its automatic scoring software to the results of the AASR's manual scoring project. To test the new automated algorithm in an independent fashion, the AASR investigators maintained full control of study design, file selection, data analysis, and interpretation.
METHODS
The Automated Scoring Software
The software was written in C# and developed within Microsoft Visual Studio 2008 (Microsoft Inc, Seattle, WA).
Sleep Staging
This task is done through analysis of the two central EEG signals, the chin electromyogram (chin EMG) and the two eye movement channels. The power spectrum of the EEG between 0.33 and 60.0 Hz is obtained in discrete time intervals and is further processed through a proprietary algorithm that classifies the power spectrum into one of three categories, awake (W), asleep (S), and uncertain (U). The S epochs are further characterized as R, rapid eye movement (REM) or NR, nonrapid eye movement (non-REM) based on the presence of REM and the chin EMG power. Epochs classified as R are extended into neighboring epochs classified as NR or U based on the 2007 guidelines of the American Academy of Sleep Medicine (AASM), i.e., provided there is no increase in chin EMG, no K complexes or spindles, and < 6 sec of delta waves.14 Spindles, K complexes, and delta waves are identified using time-series and frequency-based analyses of the EEG signals. The criteria used to identify these events are based on the rules of Rechtschaffen and Kales.15 Classification of the remaining uncertain epochs (U) occurs after scoring arousals and respiratory events. Uncertain epochs are classified as W or NR based on percentage of time with dominant alpha rhythm in the EEG, and the presence of respiratory events. Epochs with stage NR are then classified as N1, N2, or N3 based on the 2007 AASM guidelines.14 Epochs following arousals are classified as N1 unless a spindle or K complex is present in the first half of the epoch.
Arousal Scoring
For arousal scoring, the following values are scanned during periods classified as R or NR: alpha/sigma power, beta power, chin EMG, heart rate, and respiratory amplitude. A significant increase in alpha/sigma power and/or beta power relative to adjacent regions that lasts > 3 sec is scored as a potential arousal. The arousal is confirmed if (1) the increase in [normalized alpha/sigma * normalized beta] exceeds a threshold value, or (2) the potential arousal is associated with a significant increase in a product that combines normalized values of heart rate, chin EMG, and respiratory amplitude. For arousals in REM sleep an increase in chin EMG is also a requirement. In this fashion, and according to the 2007 AASM criteria,14 an increase in high-frequency power is essential but marginal increases in high-frequency power may or not be scored depending on the presence of other findings typically associated with arousals.
Scoring of Respiratory Events
This process is based on analysis of signals from the nasal pressure cannula, the oronasal thermistor, and the respiratory bands. Each signal is subjected to quality tests and the signal is not used when the quality criteria are not met in the file section being analyzed. The nasal pressure signal is used to quantify respiratory amplitude unless it is of poor quality. In such cases the primary signal used is the thermistor's. If both signals are of poor quality, respiratory amplitude is determined from the respiratory bands after summing the ribcage and abdomen signals using a proprietary algorithm. Respiratory bands are used for amplitude determination only if the bands were of the inductance variety. When the respiratory bands used other technologies, such as the piezoelectric crystal bands used in this study, the band signals are used only to classify apneas.
The oxyhemoglobin saturation signal (SpO2) is scanned. Periods with bad signal are identified and ignored. Instances in which SpO2 decreased by > 2% relative to the highest value in the interval (90 sec before to 30 sec after the SpO2 trough) are identified. The location (in time) and magnitude of decrease in SpO2 are recorded for each such event.
Scoring of apneas follows the 2007 AASM guidelines.14 Presumptive apneas are scored if respiratory amplitude is ≤ 10% of the average of the three largest amplitudes in the preceding 2 min for ≥ 10 sec. Apneas are confirmed if the thermistor signal (if valid) also met the same amplitude criteria and there is no snoring for a continuous period ≥ 10 sec during the presumptive apnea. Once an apnea is identified it is classified as obstructive, central, or mixed using the 2007 AASM guidelines.14 The respiratory bands' signals are used to determine if there were respiratory efforts during the apnea.
Hypopneas were then scored according to one of three options14:
Primary (recommended) AASM criteria (Criteria 4A): ≥ 30% reduction in respiratory amplitude for ≥ 10 sec associated with ≥ 4% decrease in SpO2.
Secondary (alternate) AASM criteria (Criteria 4B): ≥ 50% reduction in respiratory amplitude for ≥ 10 sec associated with ≥ 3 % decrease in SpO2 or an arousal.
AASM Research (Chicago) criteria14: ≥ 50% reduction in respiratory amplitude for ≥ 10 sec or ≥ 20% reduction in respiratory amplitude for ≥ 10 sec associated with ≥ 3 % decrease in SpO2 or an arousal.
Although the software scores leg movements, the information was not used in the current study because the PSGs used did not include leg movements.
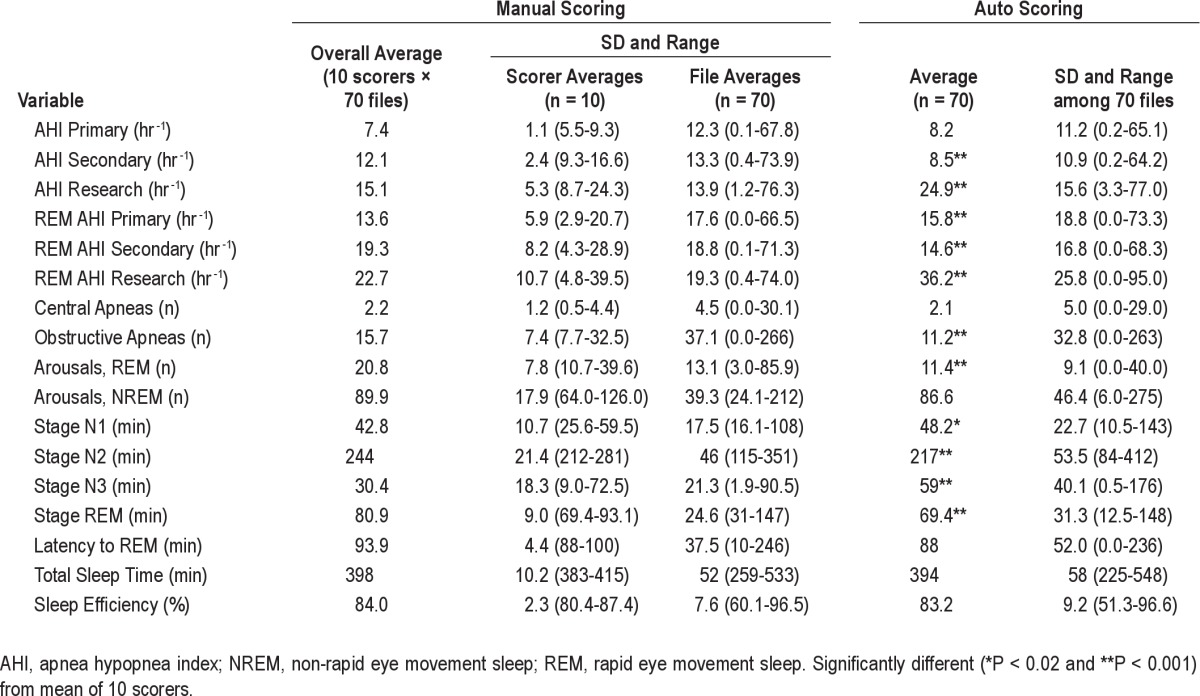
The software analyzes all data between lights out and lights on. At the end of the analysis it generates a table that contains the time at which each sleep stage begins and ends, as well as the times and type of each event scored. This file is analogous to the scoring sheet generated after manual scoring of the files. A report is then generated. As required by the protocol of the AASR manual scoring study used for comparison, the report contained the results of 17 measurements (see Table 1 for list of variables measured). By protocol of the AASR study, obstructive and mixed apneas were combined and are reported as obstructive events.
Table 1.
Average scores by manual scorers and by the automatic system
Study Design
Manual Scoring
Seventy PSGs were manually scored with the assistance of computer software by two scorers at each of the five AASR-affiliated sites. The methods of selection of the 70 files, scoring methods, participating institutions, manual scorers, data collection and transfer, and compilation and analysis of the 10 manual scores are described in the companion paper.13
Automatic Scoring
One of the investigators (MY, the developer of the software) and two technicians from the company that owns the software (YST, Winnipeg, Canada) traveled to the Clinical Research Center (CRC) for Sleep at the University of Pennsylvania on May 27, 2010. The 70 PSG files were given to the technicians in EDF file format on a portable hard drive. The files were then scored onsite using a laptop with the automated scoring software. Scoring of sleep staging, arousals, and respiratory events using the three different criteria took approximately 4 hr for the 70 files. The YST team copied their results onto one of the CRC for Sleep computers and departed. The CRC for Sleep submitted the automated scoring reports to the project statistician (AH) for comparison with the manual scoring results. YST had no ability to modify the automated scoring or influence the analysis after leaving the CRC for Sleep. YST was blinded to the manual scoring results until the analyses were completed.
Analysis
Comparison of Automatic Results and the Average of Ten Manual Scores
For each variable of interest a table with 10 columns (one per scorer) and 70 rows (one per file) was generated. The average of the 10 values in each row was calculated, resulting in 70 average values (file averages). Standard deviation (SD) and range of these file averages were calculated to indicate the range of findings among the different files. The 70 file averages were compared with the 70 results obtained from the autoscoring by the paired t test. The intra-class correlation coefficient (ICC) was computed for the 70 pairs and Bland-Altman plots of the difference between the two measurements (auto and average of 10 scorers) versus the average of the two measurements were generated.16 Agreement from the plots was displayed as median difference (or bias) between scoring criteria and the 5th and 95th percentiles of the difference.
The average of each column in the 10 × 70 table was also computed and resulted in 10 average values, each of which provided the average of the 70 scores made by one scorer (scorer averages). SD and range of these scorer averages were examined to determine if the average autoscore fell within the range observed among the 10 scorers.
Within-Site and Across-Sites Agreement Versus Agreement between Autoscore and the Average Manual Score
ICCs were obtained for agreement between the two scorers in each center, resulting in five within-site coefficients for each variable. For each file the average of the two values scored by the two technologists at each site was obtained. ICC was determined for the agreement across the five sites using the average values of the two scorers in each site. The Fisher test17 was used to identify significant differences between the ICCs of “automatic versus manual” comparisons and the within-site and across-sites ICCs.
RESULTS
The files were obtained from 70 females aged 51.1 ± 4.2 years with a body mass index of 32.9 ± 9.2 kg/m2 as described elsewhere.13
Table 1 shows the average scores of respiratory events, sleep stages, and arousals for the 70 files as determined by manual and automatic scoring. The 70-file average obtained by auto-score was not significantly different from the average of the 10 scorers for AHI primary criteria (8.2 ± 11.2 versus 7.4 ± 12.3 hr-1), central apneas (2.1 ± 5.0 versus 2.2 ± 4.5), non-REM arousals (86.6 ± 46.4 versus 89.9 ± 39.3), latency to REM sleep (87.9 ± 52.0 versus 93.9 ± 37.5 minutes), total sleep time (394 ± 58 versus 398 ± 52 min), and sleep efficiency (83.2 ± 9.2 versus 84.0 ± 7.6 %). For AHI determined by the secondary criteria, the autoscore mean AHI was significantly lower than the average manual score (8.5 ± 10.9 versus 12.1 ± 13.3 hr-1; P < 0.001) and was just below the lowest average value obtained by any scorer (9.3 hr-1; see range of scorer averages in Table 1). By contrast, for AHI determined by the research criteria the auto-score was significantly higher than the average manual score (24.9 ± 15.6 versus 15.1 ± 13.9 hr-1; P < 0.001) and was just above the highest average value obtained by any scorer (24.3 hr-1). For the remaining nine variables there were significant bidirectional differences but the auto-score was within the range obtained by the 10 scorers, indicating that at least one scorer was more different from the overall average score than the autoscore.
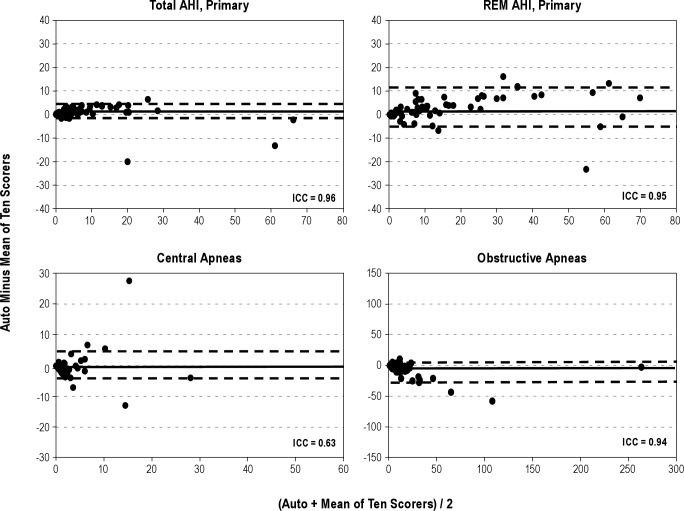
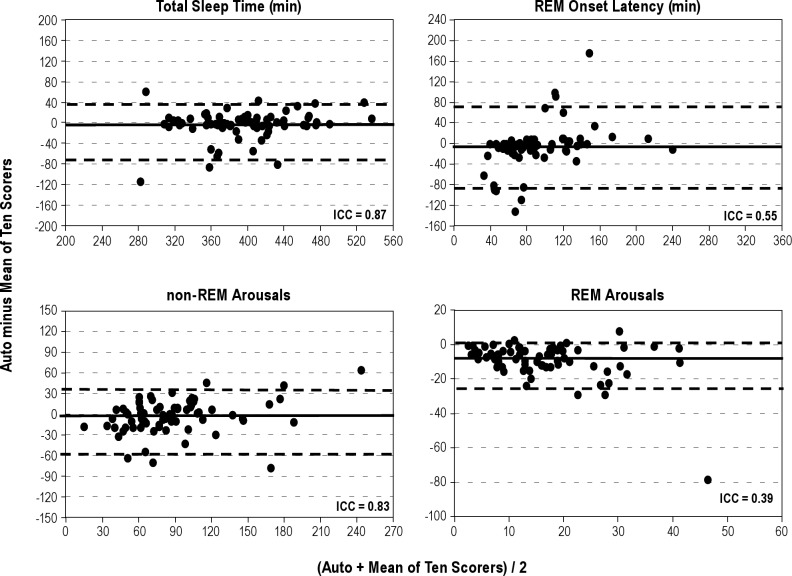
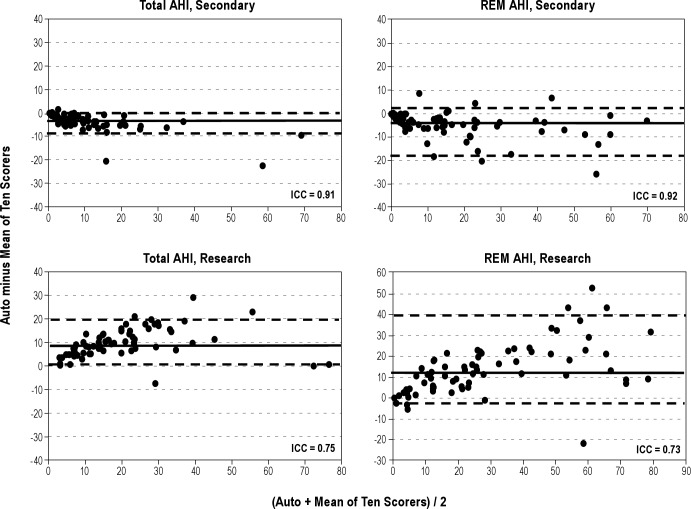
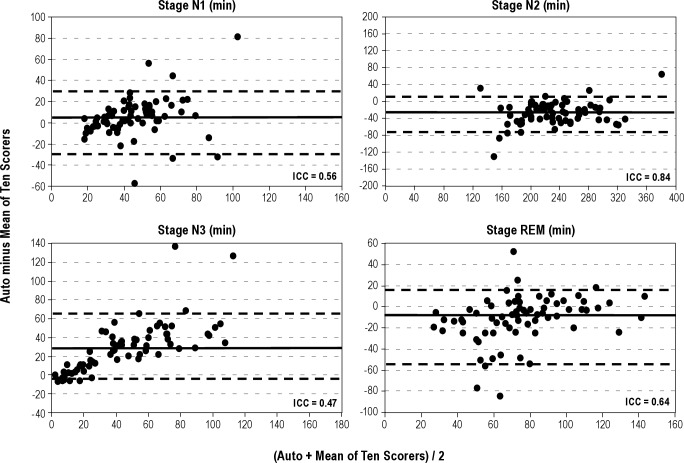
Figures 1 through 4 show Bland-Altman plots16 for the different variables along with the ICCs. Agreement was excellent (ICC > 0.90) for AHI by primary (Figure 1) and secondary (Figure 2) AASM criteria, both during REM sleep time and total sleep time. It was also excellent for a number of obstructive events (Figure 1). Agreement was good (ICC 0.80-0.90) for stage N2 (Figure 3), total sleep time (Figure 4), and non-REM arousals (Figure 4) and moderate (ICC 0.7-0.8) for AHI by the research criteria (Figure 2). For the remaining variables the agreement was modest to poor. Of particular note, the difference between autoscore and average manual score for AHI by the research criteria (Figure 2) and stage N3 (Figure 3) increased as the average value (abscissa) increased.
Figure 1.
Bland-Altman plots showing the difference between autoscoring and the average of 10 scorers versus the average of the two scores, for total apnea-hypopnea index (AHI) scored by the American Academy of Sleep Medicine (AASM) primary criteria (top left), REM AHI scored by the AASM primary criteria (top right), number of central apneas (bottom left), and number of obstructive apneas (bottom right). ICC, intraclass correlation coefficient; REM, rapid eye movement sleep. The solid horizontal line in each panel represents the median difference and the two dashed lines represent the fifth and 95th percentiles of the difference.
Figure 4.
Bland-Altman plots showing the difference between autoscoring and the average of 10 scorers versus the average of the two scores, for total sleep time (top left), onset of rapid eye movement (REM) sleep (top right), number of arousals in non-REM (bottom left), and REM sleep (bottom right). ICC, intraclass correlation coefficient. The solid horizontal line in each panel represents the median difference and the two dashed lines represent the fifth and 95th percentiles of the difference.
Figure 2.
Bland-Altman plots showing the difference between autoscoring and the average of 10 scorers versus the average of the two scores, for total apnea-hypopnea index (AHI) scored by the American Academy of Sleep Medicine (AASM) secondary criteria (top left), REM AHI scored by the AASM secondary criteria (top right), total AHI scored by the research criteria (bottom left), and REM AHI scored by the research criteria (bottom right). ICC, intraclass correlation coefficient; REM, rapid eye movement sleep. The solid horizontal line in each panel represents the median difference and the two dashed lines represent the fifth and 95th percentiles of the difference.
Figure 3.
Bland-Altman plots showing the difference between autoscoring and the average of 10 scorers versus the average of the two scores, for sleep stages N1 (top left), N2 (top right), N3 (bottom left), and rapid eye movement (REM) sleep (bottom right). ICC, intraclass correlation coefficient. The solid horizontal line in each panel represents the median difference and the two dashed lines represent the fifth and 95th percentiles of the difference.
A relatively poor agreement between the autoscore and the average of the 10 manual scores may reflect inaccuracies in the autoscore or large interscorer variability in manual scoring of the variable in question. In the latter case, between-scorers ICCs should also be poor. Table 2 lists the ICCs for within-site comparisons (first two columns), across-sites comparisons (column 3), and comparisons between autoscore and the average of 10 manual scores (column 4). There were five within-site ICCs. Column 1 shows the average of the five ICCs. Column 2 shows the range of the five actual within-site ICCs observed. Figures 5A and 5B are scatterplots of ICCs obtained from automatic versus manual comparisons of the 17 variables measured (Y axes) and average within-site ICCs (Figure 5A) or across-sites ICCs (Figure 5B) for the same variables.
Table 2.
ICCs of automatic vs. average manual scoring and of manual scoring within and across 5 sites
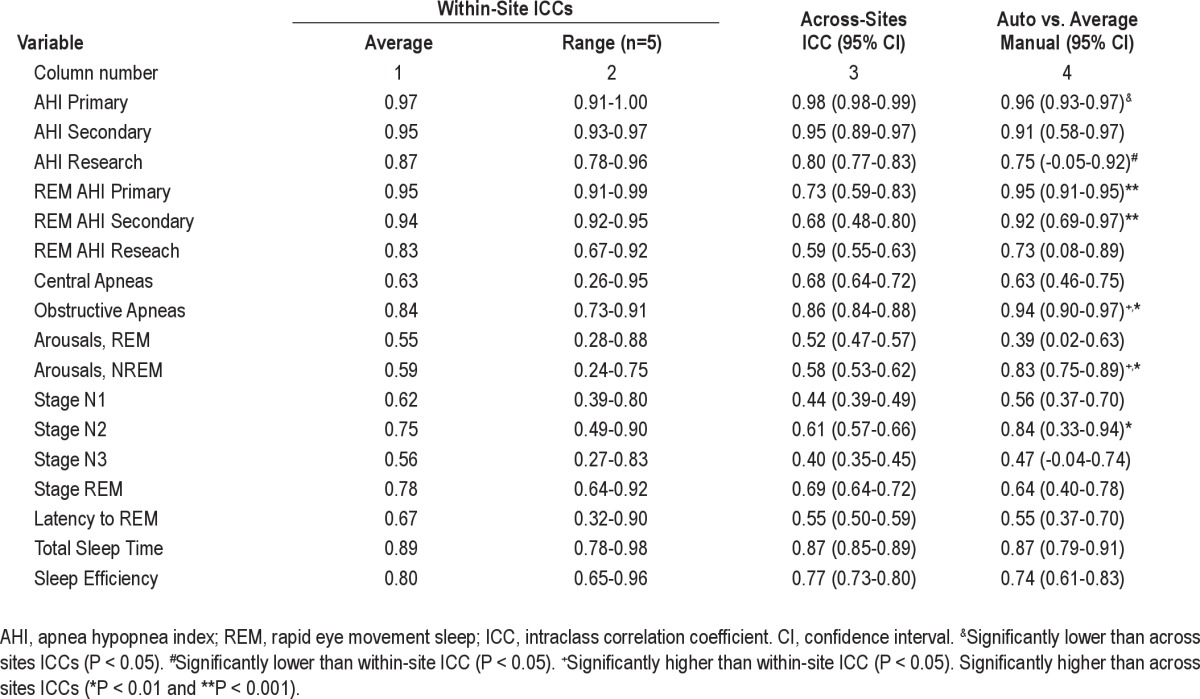
Figure 5.
Scatterplots of intraclass correlation coefficients (ICC) for autoscoring versus average manual scoring of the 17 variables measured (ordinate) versus within-site (A) and across-sites (B) ICCs for the same variables. Each dot is a separate variable. Diagonal lines are the lines of identity.
For AHI using primary criteria, the ICC for automatic versus manual was significantly lower than across-sites ICC although it remained excellent (r = 0.96). For AHI using research criteria the ICC for automatic versus manual comparison was significantly lower than the within-site ICC, but not significantly different from the across-sites ICC. The agreement between autoscore and average manual score was significantly better than either the within-site agreement or the across-sites agreement, or both, for REM AHI using primary or secondary criteria, number of OSAs, number of non-REM arousals, and time in stage N2. There were no other significant differences. Figure 5 and Table 2 both show that when agreement between manual scorers was very high, the agreement between autoscore and the average manual score was also very high. On the other hand, when manual scoring showed greater within-site or across-sites variability the agreement between autoscoring and average manual scoring was also lower but was predominantly better than the across-sites agreement (Figure 5B).
DISCUSSION
The current study is among the first validation studies of an automated scoring system that validated the system in a large number of patients, evaluated the accuracy of sleep staging as well as scoring of arousals and respiratory events, compared the automatic results with the consensus scores of multiple expert scorers, and was performed completely independently of the developer of the software. The results of our study can be summarized as follows. First, we have demonstrated that the agreement between the results of the current automated algorithm and the average of 10 expert scorers is comparable to the agreement between two expert scorers in the same site and similar to or better than the agreement between expert scorers across sites (Table 2 and Figure 5). This finding applies to sleep staging, and scoring of arousals and respiratory events. Second, the automated algorithm shows no systematic bias in the scoring of several key variables, including AHI by primary AASM criteria, total sleep time, sleep efficiency, and non-REM arousals. Third, the automated algorithm scores fewer respiratory events by the secondary AASM criteria and more respiratory events by the AASM research criteria than the average of 10 expert scorers. Fourth, the automated algorithm scores more stage N3, at the expense of stage N2, than the average of 10 scorers.
What to Use as a Reference
One of the major problems in evaluating the accuracy of any PSG scoring system is the presence of considerable inter-rater variability in scoring the same files. This limitation has been documented in several previous studies,5–11 and is clearly evident in the current study by the wide range of results obtained by 10 expert scorers (SD and range of scorer averages13 [Table 1]). The level of agreement among scorers varies greatly depending on what variable is being scored (Tables 1 and 2). When agreement among scorers of a given variable is very high, the score of only one or two expert scorers should suffice as a reference for this variable. However, in the presence of considerable interrater variability and disagreement there is no reliable reference. Interrater variability may be due in part to guidelines that are ambiguous (e.g., what is baseline SpO2 or respiratory amplitude when there is no stable baseline, or what constitutes a significant shift to a higher EEG frequency in a signal in which the dominant frequency is continuously changing) or difficult to implement (e.g., is total duration of delta waves > 6 sec, or is the increase in leg EMG > 8 microV?). Accordingly, scoring of many variables is subject to individual interpretation of the guidelines and the willingness of the scorer to make time- consuming measurements. Given these considerations and the absence of a gold standard, we thought it was appropriate to use the average and range of results observed among scorers as a composite reference standard,18 the average reflecting the consensus and the range representing the spectrum of interpretations and vigilance encountered among expert scorers. By using 10 expert scorers from five different institutions across the United States for each file and each variable, we believe our reference yardsticks were more than adequate for evaluating an automatic scoring system.
Agreement between the Automatic System and the Average of 10 Scorers
The agreement (ICC) between the automatic score and the average of 10 scorers was similar to or better than the agreement across sites for virtually all variables (Figure 5B). Considering that, as a target, the average of 10 expert scorers is preferable to the average of two scorers at different sites, the results obtained by this automatic system are more robust than those obtained by any single site, even when the result in each site is the average of two scorers. The absolute level of agreement between the autoscore and the average manual score was, however, not high with all variables. When agreement among scorers was high, the automatic versus manual agreement was also high (e.g., AHI by primary and secondary criteria, total sleep time, and number of OSAs, Table 2). However, when agreement among scorers was only moderate or poor (ICC < 0.8), the automatic versus manual agreement was often also moderate to poor (e.g., stages N1, N3, and REM, latency to REM, REM arousals, and number of central apneas). Nevertheless, in all such cases, the ICC for automatic versus manual comparison remained within the 95% confidence interval (CI) of the across-sites ICC or the range of within-site ICCs (Table 2). Reducing ambiguity and time-consuming measurements in scoring guidelines is likely to be needed to reduce interrater variability for these variables.
Systematic Differences between Automatic and Manual Scoring
Although there was excellent agreement between automatic and manual scoring of the AHI when respiratory events were scored using the secondary AASM criteria (ICC = 0.91, Table 2 and Figure 2), the automatic score was on average 3.5 hr-1 less than the manual score (8.5 versus 12.1 hr-1, P < 0.001, Table 1) despite similar total sleep time. The difference appeared to increase as AHI increased (Figure 2). The reason for this systematic bias is not clear, although, in view of the excellent agreement, and no bias, for scoring AHI by the primary AASM criteria, the reason is most likely the method of determining whether the amplitude of breathing decreased by more than 50% of baseline. As indicated earlier, the definition of what is baseline when breathing is periodic is not clear14 and amenable to subjective interpretation. It is interesting to note that at least one of the expert scorers scored almost the same average AHI as the automatic system (9.3 versus 8.5 hr-1, Table 1). It is also interesting that the AHIs determined by the automatic system with the primary and secondary criteria were almost identical (8.2 ± 11.2 versus 8.5 ± 10.9 hr-1, Table 1, ICC = 0.98). Perhaps the method used for determining baseline amplitude in the automatic system fortuitously cancelled out the effect of the difference between the two sets of criteria.
By contrast, the AHI scored by the Chicago criteria was, on average, substantially higher than that scored by experts (Table 1 and Figure 2). The difference also increased as AHI increased (Figure 2). According to the Chicago criteria19 a hypopnea would be scored if there is “a clear amplitude reduction of a validated measure of breathing during sleep that does not reach the above criterion (i.e., 50% reduction) but is associated with either an oxygen desaturation of > 3% or an arousal”. There is no recommended threshold reduction in amplitude below which a hypopnea is not scored. In the current software a reduction of at least 20% is required. Manual scorers could well require other more substantial reductions to score hypopneas. It is worth noting that the AHI scores by Chicago criteria ranged 8.7 to 24.3 hr-1 among the 10 scorers (Table 1), with the values obtained by at least one of the scorers being very similar to the automatic score (24.3 versus 24.9 hr-1).
The automatic system also scored more N3 time than manual scorers (Table 1) and the difference increased as N3 time increased (Figure 3). Without reviewing the relevant sections of the files, it is difficult to know which scoring is correct. However, in many cases where the amplitudes of the slow waves is borderline, and the slow waves are not numerous, precise measurement of slow wave amplitudes and duration is required to determine if the stage is N2 or N3. Most technologists simply “eyeball” the epoch, whereas precise measurements are not a problem for the software. Thus, it is possible that the automatic score is more precise. This possibility is further suggested by the fact that N3 time scored by the 10 technologists ranged from 9.0 to 72.5 min, with at least one scoring more N3 time than the automatic system (Table 1).
Other Automated Scoring Systems
Most PSG acquisition systems include software modules that automatically score sleep stages, arousals, respiratory events, and leg movements. Experience with these systems has been quite disappointing and in practice their use is limited to simple tasks such as identifying SpO2 changes and leg movements. There are two freestanding commercial systems that perform complete automatic analysis of PSGs and for which there are published validation studies, Morpheus (WideMed Ltd, Omer, Israel)20 and Somnolyzer (Philips Respironics, Murrysville, PA).21–25 Comparison between the current study and these other validation studies is difficult because of differences in the populations studied, the references used to compare with the automatic scores, and the analytical methods used. For example, all but one of the studies on Somnolyzer21 were performed exclusively on healthy patients and those with insomnia22–25 and in all studies21–25 evaluation was limited to sleep staging (i.e., scoring of respiratory and arousal scoring was not evaluated). In the only study in which some patients with sleep apnea were included,21 accuracy of sleep staging was reported as epoch-by-epoch agreement, where data from all files are pooled, and it is therefore not possible to evaluate the effect of disagreements on sleep time in individual patients.
In the only published study on Morpheus,20 the automatic results were compared with the results of two individual scorers. Interrater variability among manual scorers was evaluated from the agreement between the two scorers (in the same institution). There was good agreement between the automatic score and each of the two scorers for the estimation of the AHI by the primary AASM criteria (ICCs = 0.95, 0.95; CI of the difference between automatic and manual scoring -17 to 12 hr-1). In the current study, the comparable values against the average of 10 scorers were slightly better (ICC = 0.96 and CI of the difference -6 to 8 hr-1, Table 2 and Figure 1). Morpheus also performed well versus each of the two scorers for total sleep time (ICCs = 0.92, 0.94). However, agreement was only modest for other important outcome measures such as the arousal index (ICCs = 0.58, 0.72), staging of REM sleep (ICCs = 0.72, 0.76), stage N1 (ICCs = 0.37, 0.53), stage N2 (ICCs = 0.72, 0.84), stage N3 (ICCs = 0.18, 0.53), and latency to REM sleep (ICCs = 0.43, 0.46). These values cannot be readily compared with the current results because only two technologists from the same institution were used. The agreement between these two scorers may not be representative of within-site or across-sites agreement given the wide range of interscorer variability for these variables (Table 2, column 2).
Need for Manual Editing
One concern that arises is the use of automated systems without human involvement, which we do not endorse. We believe that a combination of automated scoring and human editing is required for ideal results. Human errors can result from fatigue or carelessness, which are inherent in repetitive tasks being done under time pressures. Although computerized systems are free from these concerns, they have their own shortcomings in that human experience can be beneficial in defining unusual or unexpected patterns that are foreign to the computerized algorithms. Occasionally, obvious artifacts to a human may not be identified by a computerized system if such a pattern is not accounted for by the automated algorithms.
Limitations
Despite our study's strength, we acknowledge a number of limitations. First, our 70 patients included only a few patients with severe sleep apnea. We recognize the need for further study of clinical populations, but would argue that we observed good negative predictive value for OSA based on our analyses. In addition, many of the patients had severe OSA during REM sleep and the ICC for AHI in REM sleep remained very high (0.95, Table 2 and Figure 1). Second, there were no patients with important central sleep apnea; the highest total number of central apneas in any patient was 28 (Figure 1). Third, we recognize the need for further study of varying clinical populations including those with insomnia, heart failure, epilepsy, and other conditions. Fourth, the PSG recordings were selected as good-quality studies for our companion research.13 Thus, the results of the manual as well as the automated scoring may be different in unselected recordings. Fifth, we recognize that there is no optimal gold standard against which automated scoring should be compared. Although some authors have used epoch-by-epoch comparisons, others have used overall results from a large number of scorers. We do not believe that any method is ideal given that PSG scoring is subjective as currently defined. This subjectivity of human scoring is equally present using an epoch-by-epoch approach versus an overall PSG approach. Ultimately, the ability of various scoring methods to predict clinical outcome may be the most informative, although existing data suggest that AHI correlates quite poorly with many clinical outcomes. Thus, no method is ideal.26 Despite these limitations, we believe that our findings are robust and worthy of further study.
CONCLUSION
The automatic system yielded results that were similar to those obtained by experienced technologists. Very good ICCs were obtained for many primary PSG outcome measures. This automated scoring software, particularly if supplemented with manual editing, promises to increase laboratory efficiency and standardize PSG scoring results within and across sleep centers.
DISCLOSURE STATEMENT
This study was funded in part by the Philips Respironics Foundation. Dr. Malhotra had previously received (prior to May 2012) consulting and/or research income from Philips Respironics, SHC, SGS, Apnex Medical, Pfizer and Apnicure. Dr. Kuna receives grant support from Philips-Respironics. Dr. Benca has received consulting income from Merck and Sanofi-Aventis. Dr. Walsh has received research support from Apnex, NovoNordisk, Merck, Phillips-Respironics, Vanda, and Ventus. Dr. Younes is the owner of YRT a research and development company. Dr. Kushida receives research support from ResMed, Pacific Medico, Merck, Cephalon, Ventus Medical, and Jazz Pharmaceuticals. He receives royalties from Philips-Respironics. The other authors have indicated no financial conflicts of interest.
ACKNOWLEDGMENTS
Scorers at the University of Pennsylvania: Haideliza Soto-Calderon, Mary Jones-Parker, RPSGT; scorers at Harvard University: Mary MacDonald, RPSGT, Pam DeYoung, RPSGT; scorers at the University of Wisconsin at Madison: Jennifer Noe, RPSGT, Rebecca Weise, RPSGT; scorers at Stanford University: Martin Ukockis, RPSGT; scorers at St. Luke's Hospital: Hilary Simon, RPSGT, Laura Rahubka, RPSGT. Eileen O'Leary, RPSGT coordinated activity at Stanford University and assisted in data export at the sites using Alice software. Sources of support: NIH R01 HL085695; Academic Alliance for Sleep Research (Philips-Respironics Foundation)
Footnotes
A commentary on this article appears in this issue on page 465.
REFERENCES
- 1.Young T, Palta M, Dempsey J, Skatrud J, Weber S, Badr S. The occur-rence of sleep-disordered breathing among middle-aged adults. N Engl J Med. 1993;328:1230–5. doi: 10.1056/NEJM199304293281704. [DOI] [PubMed] [Google Scholar]
- 2.Flegal KM, Carroll MD, Ogden CL, Curtin LR. Prevalence and trends in obesity among US adults, 1999-2008. JAMA. 2010;303:235–41. doi: 10.1001/jama.2009.2014. [DOI] [PubMed] [Google Scholar]
- 3.Hosselet JJ, Norman RG, Ayappa I, Rapoport DM. Detection of flow limitation with a nasal cannula/pressure transducer system. Am J Respir Crit Care Med. 1998;157:1461–7. doi: 10.1164/ajrccm.157.5.9708008. [DOI] [PubMed] [Google Scholar]
- 4.Mulgrew AT, Fox N, Ayas NT, Ryan CF. Diagnosis and initial management of obstructive sleep apnea without polysomnography: a randomized validation study. Ann Intern Med. 2007;146:157–66. doi: 10.7326/0003-4819-146-3-200702060-00004. [DOI] [PubMed] [Google Scholar]
- 5.Collop NA. Scoring variability between polysomnography technologists in different sleep laboratories. Sleep Med. 2002;3:43–7. doi: 10.1016/s1389-9457(01)00115-0. [DOI] [PubMed] [Google Scholar]
- 6.Loredo JS, Clausen JL, Ancoli-Israel S, Dimsdale JE. Night-to-night arousal variability and interscorer reliability of arousal measurements. Sleep. 1999;22:916–20. doi: 10.1093/sleep/22.7.916. [DOI] [PubMed] [Google Scholar]
- 7.Norman RG, Pal I, Stewart C, Walsleben JA, Rapoport DM. Interobserver Agreement among sleep scorers from different centers in a large dataset. Sleep. 2000;23:901–8. [PubMed] [Google Scholar]
- 8.Bliwise D, Bliwise NG, Kraemer HC, Dement W. Measurement error in visually scored electrophysiological data: respiration during sleep. J Neurosci Meth. 1984;12:49–56. doi: 10.1016/0165-0270(84)90047-5. [DOI] [PubMed] [Google Scholar]
- 9.Lord S, Sawyer B, Pond D, et al. Inter-rater reliability of computer-assisted scoring of breathing during sleep. Sleep. 1989;12:550–8. doi: 10.1093/sleep/12.6.550. [DOI] [PubMed] [Google Scholar]
- 10.Whitney CW, Gottlieb DJ, Redline S, et al. Reliability of scoring respiratory disturbance indices and sleep staging. Sleep. 1998;21:749–57. doi: 10.1093/sleep/21.7.749. [DOI] [PubMed] [Google Scholar]
- 11.Drinnan MJ, Murray A, Griffiths CJ, Gibson GJ. Interobserver variability in recognizing arousal in respiratory sleep disorders. Am J Respir Crit Care Med. 1998;158:358–62. doi: 10.1164/ajrccm.158.2.9705035. [DOI] [PubMed] [Google Scholar]
- 12.Penzel T, Hirshkowitz M, Harsh J, et al. Digital analysis and technical specifications. J Clin Sleep Med. 2007;3:109–20. [PubMed] [Google Scholar]
- 13.Kuna ST, Benca R, Kushida CA, et al. Agreement in computer-assisted manual scoring of polysomnograms across sleep centers. Sleep. 2013;36:583–9. doi: 10.5665/sleep.2550. [DOI] [PMC free article] [PubMed] [Google Scholar]
- 14.Iber C, Ancoli-Israel S, Chesson AL, Quan SF. Westchester, IL: American Academy of Sleep Medicine; 2007. The AASM Manual for the scoring of sleep and associated events: rules, terminology and technical specifications. [Google Scholar]
- 15.Rechtschaffen A, Kales A. NIH Publication. No. 204. Washington, DC: U.S. Government Printing Office; 1968. A manual of standardized terminology, techniques, and scoring system for sleep stages of human subjects. [Google Scholar]
- 16.Bland JM, Altman DG. Statistical methods for assessing agreement between two methods of clinical measurement. Lancet. 1986;1:307–10. [PubMed] [Google Scholar]
- 17.Fisher RA. On the probable error of a coefficient of correlation deduced from a small sample. Metron. 1921;1:3–32. [Google Scholar]
- 18.Rutjes AW, Reitsma JB, Coomarasamy A, Khan KS, Bossuyt PM. Evaluation of diagnostic tests when there is no gold standard. A review of methods. Health Technol Assess. 2007;11:iii–ix. 51. doi: 10.3310/hta11500. [DOI] [PubMed] [Google Scholar]
- 19.American Academy of Sleep Medicine. Sleep-related breathing disorders in adults: recommendations for syndrome definition, and measurement techniques in clinical research. The report of an American Academy of Sleep Medicine Task Force. Sleep. 1999;22:667–89. [PubMed] [Google Scholar]
- 20.Pittman SD, MacDonald MM, Fogel RB, et al. Assessment of automated scoring of polysomnographic recordings in a population with suspected sleep-disordered breathing. Sleep. 2004;27:1394–403. doi: 10.1093/sleep/27.7.1394. [DOI] [PubMed] [Google Scholar]
- 21.Anderer P, Gruber G, Parapatics S, et al. An e-health solution for automatic sleep classification according to Rechtschaffen and Kales: validation study of the Somnolyzer 24 × 7 utilizing the Siesta database. Neuropsychobiology. 2005;51:115–33. doi: 10.1159/000085205. [DOI] [PubMed] [Google Scholar]
- 22.Barbanoj MJ, Clos S, Romero S, et al. Sleep laboratory study on single and repeated dose effects of paroxetine, alprazolam and their combination in healthy young volunteers. Neuropsychobiology. 2005;51:134–47. doi: 10.1159/000085206. [DOI] [PubMed] [Google Scholar]
- 23.Saletu B, Prause W, Anderer P, et al. Insomnia in somatoform pain disorder: sleep laboratory studies on differences to controls and acute effects of trazodone, evaluated by the Somnolyzer 24 × 7 and the Siesta database. Neuropsychobiology. 2005;51:148–63. doi: 10.1159/000085207. [DOI] [PubMed] [Google Scholar]
- 24.Svetnik V, Ma J, Soper KA, et al. Evaluation of automated and semiautomated scoring of polysomnographic recordings from a clinical trial using zolpidem in the treatment of insomnia. Sleep. 2007;30:1562–74. doi: 10.1093/sleep/30.11.1562. [DOI] [PMC free article] [PubMed] [Google Scholar]
- 25.Anderer P, Moreau A, Woertz M, et al. Computer-assisted sleep classification according to the standard of the American Academy of Sleep Medicine: validation study of the AASM version of the Somnolyzer 24 × 7. Neuropsychobiology. 2010;62:250–64. doi: 10.1159/000320864. [DOI] [PubMed] [Google Scholar]
- 26.Ferri R, Ferri P, Colognola RM, Petrella MA, Musumeci SA, Bergonzi P. Comparison between the results of an automatic and a visual scoring of sleep EEG recordings. Sleep. 1989;12:354–62. [PubMed] [Google Scholar]


