Abstract
Background:
Grewia gum has received attention as a polymeric pharmaceutical excipient in the recent times, being employed as a suspending, film coating, mucoadhesive, and binding agent. The low aqueous solubility, however, has limited its characterization and application.
Objective:
The purpose of this study was to fractionate and evaluate some physicochemical properties of the gum.
Materials and Methods:
Aqueous dispersion of the gum was treated at 80°C for 30 min in the presence of sodium chloride and was subsequently fractionated by successively centrifuging it at 3445 rpm for 30 min. Skeletal density, solubility, particle size, and rheological as well as thermal characteristics of the fractions were evaluated. The 1H nuclear magnetic resonance (NMR) and near infrared (NIR) profiles of the fractions were also investigated. The solubility of the gum increased up to fourfold while the viscosity decreased from 244 to as low as70 cP at 40 rpm with some fractions.
Results:
Grewia gum and the fractions showed good thermal stability exhibiting no thermal events, but charred irreversibly at 297°C irrespective of the fraction. The molecular weight averages by weight and by number of the fractions were between 233,100 and 235,000. The 1H nuclear magnetic resonance (NMR) spectra showed broad peaks. The NMR and NIR spectra suggested the presence of –OH and –OCH3 functional groups in this gum.
Conclusion:
The fractionation improved solubility and facilitated further investigations on its characteristics that may have implication on its processing, application, and optimization as a potential pharmaceutical excipient.
KEY WORDS: Characterization, fractions, grewia gum, pharmaceutical excipient, potential
Grewia gum is a natural polymer that has been of interest to pharmaceutical scientists in Nigeria in the last decade as a potential pharmaceutical excipient. The researchers focused on the binding,[1–4] bioadhesive,[5] suspending,[6] and film coating properties[7] of the gum. In the earlier studies, attempts were made to characterize grewia gum with regard to the rheological properties and water vapor permeation of aqueous-based films.[3,8,9] Recently, efforts were made to further characterize the gum with respect to the sugar units, molecular weight averages, and Fourier transform infrared spectroscopy (FTIR) profile.[10] These investigations were on the whole gum, which were limited by its solubility. Various techniques and methods are available for characterizing gums and mucilage intended for pharmaceutical use.[11–14] Quality by design (QbD) principle makes it necessary to establish a design space for each pharmaceutical product, active ingredient, excipient, and the unit operation used to produce the finished products and the excipients.[15–17] Polymer, as the name implies, is made up of repeating units and these repeating units can be of different lengths. The length of a polymer chain may be a key basis for some of its physicochemical properties and fractionation may affect these properties. The purpose of this work was to obtain fractions and compare the physicochemical properties of the fractions to those of the whole gum as potential pharmaceutical excipients, with special reference to its use as an aqueous film coating agent.
Materials and Methods
Materials
Sodium hydroxide and sodium chloride were of analytical grade. Grewia gum was obtained in December 2008 from Grewia mollis plant that grows wildly in Pankshin Local Government Area, Plateau State, Nigeria.
Methods
Extraction of the gum
G. mollis stems were harvested from the shrub in December 2008 at Pankshin, Plateau State of Nigeria. The inner stem bark was removed and sun dried for 48 h. A quantity of approximately 500 g was size reduced and soaked in 15 L of demineralized water for 48 h to extract the gum. A clean muslin cloth was used to filter out debris from the gum. About 4.5 L of ethanol 96% was added to precipitate the gum. The precipitated gum was further treated with another 4.5 L of ethanol 96% to completely extract the gum. The gum was dried in the oven at 50°C for 12 h. The gum sample was pulverized in Quadro mill using sieve mesh corresponding to 1.19, 1.0, 0.595, 0.149, and 0.105 mm in succession, and the samples from sieve size 0.105 mm (code named G19) were collected and stored in airtight polythene bags until required.
Purification
Three hundred grams of grewia gum (G19) was dispersed in 2 L demineralized water (Millipore Corporation, Billerica, MA, USA) in which 100 g of sodium chloride had been dissolved. The dispersion was subjected to heat on a hot magnetic plate with continuous stirring and the mixture was boiled for 30 min. The dispersion was allowed to stand for 24 h to cool and was divided into two portions. One of the portions was transferred to centrifuge tubes and centrifuged at 3445 rpm (Allegra 6R centrifuge, Beckman Coulter™, USA) for 30 min and the sediment was collected as G1. The supernatant was subjected to two successive centrifugations at 3445 rpm for 30 min each time, and the sediment was collected and code named G2 and FR2, respectively. Each of the fractions was re-dispersed in demineralized water and centrifuged at 150 rpm for 5 min and the process was repeated five times with fresh water to remove any residue of sodium chloride. The fractions were suspended in Millipore® water and freeze dried. To freeze dry, the sample was filled to one-third volume of the centrifuge tubes, slanted, and frozen at -80°C. The frozen samples were then freeze dried. The second portion was freeze dried without being subjected to centrifugations and was code named G0. Similarly 100 g of whole grewia gum powder dispersion in 800 ml Millipore® water was heated at 80°C for 30 min in the presence of 40 g sodium chloride. The suspension was allowed to stand for 12 h and the supernatant decanted and kept. The sediment was washed with aliquots of Millipore® water until there was no slimy feel. The supernatant was added to the previous portion and the lot was extracted with 100 mL ethanol 96% for 4-5 times and dried. The sample was code named GR. Sample GN was sample G0 treated with sodium hydroxide, while sample BN001 was G1 centrifuged at 4200 rpm for 20 min.
Determination of pH of grewia gum fractions
For each grewia gum sample, a 2% w/v suspension was made and the pH was determined at 25°C using Orion ISE/pH meter (Model 720A, Thermo Electron Corporation, Marietta, OH, USA).
Determination of loss on drying
About 5 g sample of grewia gum fraction was weighed in a weighing balance (Model HB 43 Halogen, Mettler Toledo, Columbus, OH, USA) and subjected to heating at 105°C with inbuilt heating device for 5 min. The loss on drying data as a percentage was displayed on the instrument screen. The average of five determinations was taken and used as the loss on drying.
Determination of skeletal density
The samples to be analyzed were dried to about 1% w/w moisture content before the experiment. Prior to running samples on the gas pycnometer, the volume of the sample cell and the expansion volume were taken. The cup of the gas pycnometer (Model Acupyc 1330, S/N 3902; Micromeritics Instrument Corporation, Norcross, GA, USA) was first cleaned and its weight together with the two calibration balls was taken. The main gas supply was turned on and the pressure was set at 20-22.0 psig. The pycnometer chamber cap was removed and the small circular side was greased with Dow Corning® vacuum grease with the help of the greasing disk. The transducer was zeroed and the calibration balls were placed securely in the cell chamber cup. The calibration was accomplished by running the balls in the cup as standard. The sample identification, analysis parameters and report, purge fill pressure, number of runs, run fill pressure, and equilibration rate were sequentially imputed. The option on run precision was selected as 0.5%. Powdered grewia gum sample of known weight in the cup was introduced and the readings were taken with the analysis terminating when five consecutive runs were within the specified tolerance or a full scale of 10 runs were executed, and the result is the average of the number of runs. The data was printed on HP Laser Jet 2055 (Hewlett parker, Miami, FL, USA).
Determination of solubility of grewia gum
One gram of the sample was weighed and introduced into a 100-ml beaker. The sample was placed on a magnetic shaker and allowed to mix for 24 h. Hypodermic syringe was used to withdraw 5 ml of the sample and this was filtered through a membrane filtration disk. Two milliliters of the filtrate was withdrawn into a glass vial of known weight using an Eppendorf® micropipette. The sample was dried in the oven at 60°C to a constant weight. The difference in the initial bottle weight and the weight after drying was used to calculate the solubility of the sample as the amount of grewia in grams that dissolved in 100 ml of the solvent. The procedure was repeated for the fractions to obtain their solubility values.
Photomicrograph of grewia gum fractions
A drop of 0.62% w/v suspension of the gum fractions was smeared on a microscope slide and viewed on the Nikon eclipse microscope (Model ME 600, Nikon, Melville, NY, USA) interfaced with Spot Basic software of Linksystem for Windows version 2.41 (Linkam Scientific Instrument Ltd, England, UK). The image was captured on the computer LCD and measurements were obtained directly from the captured image on the screen.
Determination of particle size and size distribution
High-performance particle sizer (Zeta nano®, Malvern Instruments Ltd, Worcestershire, UK) was used to estimate the particle size and particle size distribution of grewia colloid. A 1 mg/ml solution was made in Eppendorf® vials with phosphate buffer pH 7.2 as the solvent. With the help of a micropipette, the sample was transferred to the cuvette and the readings were taken on the Zeta nano dynamic light scattering instrument. The decay plots were made after 14-50 readings and the results were expressed as particle mean volume or particle mean intensity.
Determination of molecular weights of grewia gum fractions
One milligram of the sample was weighed on a laboratory analytical balance (Model AG245, Mettler Toledo, Beaumont Leys Leicester, UK) and dissolved in 1 ml of phosphate buffer solution of pH 7.4. The sample was stirred on a vortex mixer at 100 rpm for 5 min to allow complete dissolution. The solution was sonicated in a VWR sonicator (VWR Scientific Products, Radnor, PA, USA). The sample was filtered through a filter membrane fitted to a microsyringe. A 200-μl sample of the filtrate was injected into Superose 6® 10/300 GL (GE Healthcare, Hertfordshire, UK), avoiding air bubbles. The detector used was Waters 410 differential refractometer (Millipore Corporation, Bedford, MA, USA). Elution peaks were obtained for the sample and reference standard, blue dextran. The peaks were copied to Window Power Point software (Microsoft Redmond, WA, USA). From the main menu of the size exclusion chromatography program, the sample image was zoomed and hatched. The data were exported and inputted to the inbuilt calibration sheet to obtain molecular weight average by weight and by number as well as the polydispersity of the sample. Prior to the molecular weight determination, a standard curve was plotted using globular proteins according to specifications in the instrument manual for Superpose 6 10/300 GL (GE Healthcare, Hertfordshire, UK).
Determination of thermal characteristics of grewia gum fractions
To understand the thermal characteristics of grewia gum, differential scanning calorimetry (DSC), modulated DSC, and thermal gravimetric (TGA) analyses were carried out using vented and unvented pans that were sealed either hermetically or non-hermetically on TA instrument's pan sealer (TA Instrument, New Castle, DE, USA). Briefly, 1-20 mg of the sample was accurately weighed on Mettler balance (ABS10 4-S, Schwerzenbach, Switzerland) and transferred to the DSC pan of known weight. The pan containing the sample was covered with a lid of known weight and the pan was sealed. In the case of vented pan, the pan was vented after the sealing. The heating rate was 20°C/min and the ramping was from –20°C to 250°C on DSC (Model 2920, TA Instrument, New Castle, DE, USA) connected to the refrigerated cooling system (RCS) and the purge gas was ultrapure nitrogen at 50 ml/sec. The data on the thermal behavior of sample were generated and analyzed by the TA Universal Advantage and Analysis software (TA Instrument). The result is the average of 10 determinations.
Determination of rheological properties of grewia gum fractions
Calibration of the rheometer
The accuracy of the rheometer (Model DV-III+ rheometer, Brookfield Engineering, Middleboro, MA, USA) was verified using viscosity standard fluids provided by the instrument manufacturer. These standard viscosity fluids are Newtonian and were not affected by the shear rate in the experiments. The cone/plate was set up by verifying the gap between the plate and the cone before measurements. This was done by moving the plate which was built into the sample cup up toward the cone until the pin in the center of the cone touched the surface of the plate, and then by separating (lowering) the plate 0.0005 inch (0.013 mm). The programmable features in the rheometer were used to set this gap by employing the toggle switch, sliding reference marker, and micrometer adjustment ring, as specified in the Brookfield operation manual.
Rheological properties of grewia gum fractions
With the guard leg of the rheometer in position, a 600 ml sample of 0.62% w/v was transferred to the Brookfield beaker provided, and the spindle which was previously zeroed was lowered into the sample until the marker on the spindle was completely immersed in the sample. To study the viscosity of the sample at different shear rates, eight variable speeds (25, 50, 75, 100, 125, 150, 200, and 250 rpm) were selected from 0 to 250 rpm and programmed into the system at ramping intervals of 0.5, 1.0, or 4 min. The spindle speed was ramped up and down with the interval maintained. The viscosities and torques of the samples were determined at 25°C. Five determinations were made for each sample and the results are the average of these determinations.
Hot stage microscopic investigations of grewia gum fractions
Effect of change in temperature on grewia gum powder was monitored on the hot stage microscopy. A 25-50 mg sample enclosed in microscope slides was placed on the Linsystem® (Linkam Ltd, Tadworth, Surrey, UK) device mounted on Nikon eclipse microscope (Nikon Eclipse, ME 600, Nikon, Japan). The microscope was fitted with camera and the heating device, THMSE 600 Linksystem for windows version 2.42 (Linkam Scientific Instrument Limited, England, UK). The heating rate was 10°C/min over a temperature range of 24-300°C. Image visualization and photomicrograph were by means of Spot Basic software (Linkam Ltd, UK).
1H nuclear magnetic resonance of grewia gum samples
Grewia gum sample (5-15 mg/ml) in deuterium water was prepared. The sample was centrifuged at 5000 rpm for 10 min. About 2 ml of the supernatant was withdrawn and transferred to NMR tube. The measurement was made on 500 MHz NMR spectrometer (Inova NMR AS 500, Oxford Instruments PLC, Oxfordshire, UK). The previous sample in the instrument was ejected. The sample to be measured together with the spinner was placed in the sample holder. It was ensured that the sample fitted well by waiting to hear the click twice. The system was then locked unto the deuterium frequency. The lock phase was used to improve the setting to a higher lock level. The spectra were acquired and 16-500 repetitions were made. The experiments were run at 25°C (298.1 K). The acquired spectra were printed for analysis.
Near infrared spectroscopy of grewia gum fraction
Near infrared (NIR) spectral information on the samples was obtained on VISION® software (FOSS NIR System, Laurel, MD, USA). The instrument lamp was warmed up for about 40 min and the vision was opened in the Data Acquisition Mode. Performance test was carried out on the instrument and the reference spectra were generated and stored. About 2 g of the sample was transferred to a clean plain glass vial and the vial was placed in the sample holder of the instrument and the spectra were obtained. Replicate spectra were obtained by repositioning the sample. The spectral data were exported to Microsoft Excel (Microsoft Inc., USA) for analysis. Second derivative of the spectra, where necessary, was also obtained for the samples with the help of the Vision® software.
Results and Discussion
Some physicochemical properties of grewia gum fractions
General description
Grewia gum was obtained as a brown to white powder depending on the sample, as shown in Figure 1. The refined grewia gum samples (G0, G1, G2, and BN001) were white or near white, while sample G19 (sample obtained from traditional extraction method using ethanol 96%) was typically brownish. The crude gum yield from the inner stem bark was 35.4% w/w. On refining, it gave 70% w/w gum (G0, 6.1; G1, 45.56; G2, 0.1; and FR2, 5.3%) and 30% w/w marc.
Figure 1.
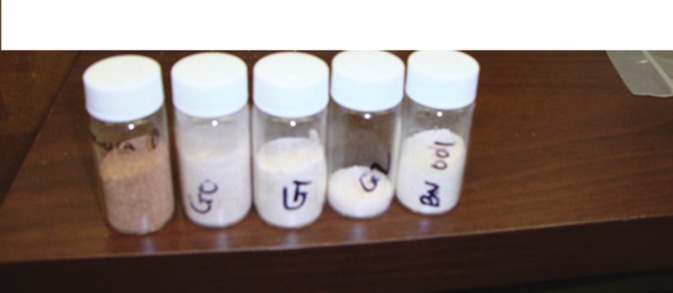
Photograph of samples of powdered grewia gum
Polysaccharide precipitation from plants has been achieved traditionally by addition of an organic solvent to the aqueous mucilage on removal of plant fibers without further treatment.[1,18,19] Treatment of polysaccharide by centrifugation or heating at 100°C in the presence of calcium hydroxide before precipitation with organic solvent has been reported.[20,21] These efforts are necessary in obtaining gum with better characteristics that would meet the exact requirements of today's pharmaceutical excipients. The purification process employed in this study improved the aqueous solubility of grewia gum by about fourfold. Solubility in a suitable solvent is critical in the characterization and application of pharmaceutical excipients, as some analytical procedures would require some level of solubility. For example, for the purpose of aqueous film coating operations, aqueous solubility of grewia gum would affect the amount of solid deposit and coating efficiency.
Figure 2 shows the photomicrographs of powdered grewia. The particles are irregularly shaped. The pH of 2% w/v samples ranged from 5.25 to 7.2. Loss on drying of grewia gum samples was between 1.3% and 6.0%. Sample G19 had the highest percent loss on drying, while GN had the lowest loss on drying. Loss on drying generally increased in the order: GN > G1 > G2 > GR > BN > FR2 > G0 > G19. High water content of powders can pose stability challenges during storage, as this would encourage microbial growth and deterioration. In addition, pharmaceutical materials with high water content would increase the cost of transportation and, eventually, of production.
Figure 2.
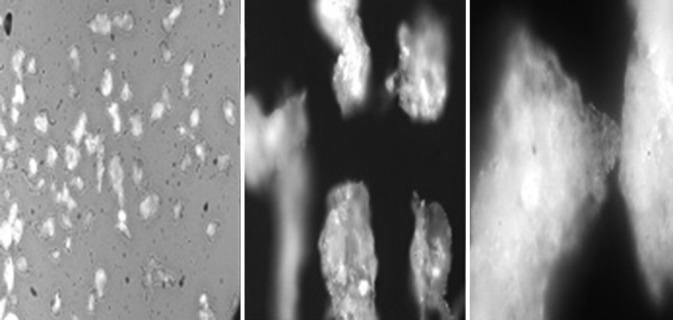
Photomicrographs of powdered grewia gum
Solubility of grewia gum samples
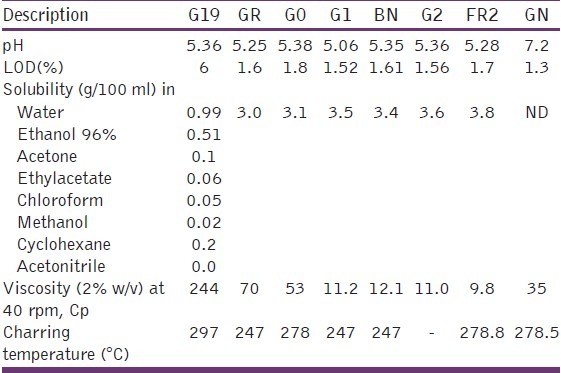
Table 1 shows the solubility profile of grewia gum samples. Grewia gum was more soluble in aqueous medium than in organic medium. The gum was practically insoluble in acetonitrite. The gum had the lowest solubility in methanol among the selected solvents: Ethanol 96%, acetone, ethylacetate, chloroform, methanol, cyclohexane, and acetonitrite. Water solubility of sample G19 was 0.99 g/100 ml, whereas the refined and fractionated samples of grewia gum with aqueous solubility up to 3.8 g/ml (about four times that of the unmodified sample, G19) were obtained. This was probably due to the removal of the insoluble component as marc and reduction in the molecular weight of the fraction.
Table 1.
Some physicochemical properties of grewia gum powders
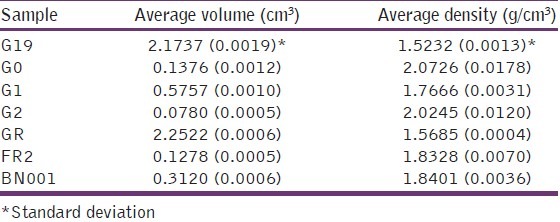
Densities of grewia gum samples
Table 2 shows the effect of processing on the density of grewia gum samples. The density ranged from 1.52 to 2.07 g cm-3 depending on the sample with the G19 having the lowest average density. The density of a pharmaceutical excipient would influence its packaging and transport in addition to its applicability.
Table 2.
True densities of grewia gum samples
Viscosity of grewia gum samples
At 40 rpm, the viscosity of sample G19 was 244 cP while that of sample GR was 70 cP, as shown in Table 1. The corresponding viscosities of G0, G1, BN001, and G2 were 53, 11.2, 12.1, and 11.0 cP, respectively, while that of FR2 was 9.8 cP. Generally the viscosity decreased in the order of G19 > GR > G0 > BN > G1 > G2 > FR2. This is similar to their decreasing molecular weight average by weight and by number, suggesting a relationship. It has been suggested that rheology is the most sensitive method for material characterization because the flow behavior is responsive to properties such as molecular weight and molecular weight distribution.[22] The most important property of natural polymers is their ability to form viscous solutions in water.[23,24] It is, therefore, of considerable practical importance to be able to characterize a polymer sample with regard to its ability to form viscous solutions. Rheological evaluation of gums and mucilage is important because much useful behavioral and predictive information can be obtained.[23,25–27] Pumping and transfer of a potential pharmaceutical excipient such as grewia gum in aqueous preparations or film coatings would greatly be affected by its viscosity. Highly viscous sample would be difficult to pump through pipes or be transferred from one container to the other, while materials with low viscosity would be easier to pump or transfer.
Particle size and particle size distribution
Particle size distribution of grewia samples obtained on zeta nano is shown in Table 3. The z-average values of G0, G1, and G2 were 4427.8, 1571.1, and 1837.4 nm, respectively, while the corresponding value for BN001 was 846.8 nm. The table also shows the z-average for some samples of semi-synthetic polymer, hydroxypropyl methylcellulose (HPMC), and synthetic polymer, polyvinylpyrrolidone (PVP), for comparison. PVP K-30, PVP-CL, and PVP-XL had z-average of 23.8, 2680.7, and 1536.1 nm, respectively. The corresponding z-average values for HPMC-K100M and HPMC-E5 premium were 1643.6 and 82.6 nm, respectively. Sample G1 had z-average similar to that of PVP-CL and HPMC-K100M. The polydispersity index (PDI) of the samples was between 0.3 and 0.5. Particle size and particle size distribution of an excipient may influence several characteristics of the final product due to interfacial phenomena and surface science.
Table 3.
Particle size distribution of grewia gum samples

Thermal characteristics of grewia gum samples
Figure 3 shows the effect of heat on the appearance of grewia gum powder. The powder began to change color at about 160°C and charred completely and irreversibly at 297°C. DSC thermograms of grewia gum samples were similar with a domed shape near 100°C, indicating probably the presence of bound water. The conventional modulated scanning calorimetry (MDSC) of sample GR, for example was similar to the DSC thermograms of the samples with no thermal events between 0°C and 300°C. This is an indication of thermal stability of grewia gum fractions. Most unit operations in pharmaceutical manufacturing processes are usually operated at conditions that are well below 297°C where the gum completely charred, making grewia gum a suitable pharmaceutical excipient that can be processed alone or together with other materials in a unit operation without adversely affecting the quality of the final product.
Figure 3.
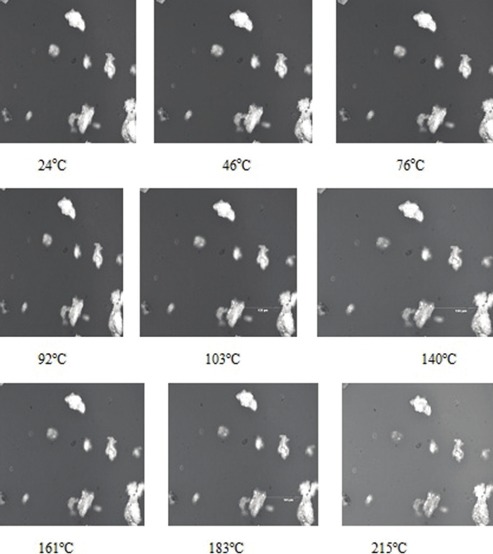
Hotstage microscopy of grewia gum sample
Molecular weight and molecular weight average of grewia gum powder
The molecular weights of grewia gum fractions by weight and by number are shown in Table 4. Molecular weight average of samples GR and G0 were 235008.18 and 235642.1, respectively. The corresponding values for samples G1, G2, FR2, and BN001 were 234539, 233820.55, 233135.71, and 235216.9, respectively. The PDI, which is the ratio of molecular weight average to molecular weight by number, was between 1.02 and 1.04. The effect of the molecular weight differences in these fractions was observed in the viscosities of the samples. The molecular weight average by weight and by number varied with the sample. This is an indication that the extraction process and treatment affected the chemical composition of the samples. Successive centrifugation led to decreasing molecular weight. The PDI of the samples, which is the ratio of the molecular weight average by weight to molecular weight average by number, were similar. The PDI has a value equal to or greater than 1, but as the polymer chains approach uniform chain length, the PDI approaches unity.[1] For some natural polymers, PDI is almost taken as unity. The PDI from polymerization is often denoted as:
Table 4.
Molecular weight average of fractions of refined grewia gum and fractions

PDI = Mω/Mn
Mn is more sensitive to molecules of low molecular mass, while Mw is more sensitive to molecules of high molecular mass. The PDI of grewia gum was about 1.02. Molecular weight of pharmaceutical excipients can have profound effects on the physicochemical properties and applications of the excipients. New properties and hence the application of some excipients have been made possible by modifying the molecular weight of such excipients.
Nuclear magnetic resonance spectra of grewia gum
1H NMR spectra of some grewia gum samples were generally broad. The spectra showed chemical shift between 5.235 and 1.083 ppm. This is indicative of the presence of –OH, –CH3, and –CH2OOH groups. The spectra of the samples were not sharp and distinct, which is characteristic of high molecular weight compounds with high branching. Broad spectra of grewia gum samples were obtained probably due to the high molecular weight of the samples. It is suggestive of a polysaccharide that has heavy attachment of branched chains. The spectra agreed well with those of NIR in the presence of hydroxyl and methyl groups.
Near infrared spectroscopy of grewia gum fractions
Figure 4 shows the NIR raw spectra of grewia gum fractions. At 1454 nm, the absorbance of grewia sample G19 was 0.197138, while those of GR, G0, and G1 were –0.083729, –0.140462, and –0.117634, respectively. The corresponding values for G2, FR2, and BN001 were –0.088810, –0.147737, and –0.158888, respectively. At 1932 nm, the absorbance of G19, GR, G0, and G1 were 0.517725, 0.99769, –0.053426, and 0.011299, respectively, while those of samples G2, FR2, and BN001 at the same wavelength were 0.060502, 0.083803, and –0.063735, respectively. The figure shows that sample G19 had the highest absorbance at 1400 and 1900 nm (first overtone region). The figure also shows the second derivative spectra of the grewia gum fractions. The peaks of sample G19 were distinct from those of the other fractions at 1300-1400 nm and 1900 nm. Figure 4 also shows the spectra of three batches of GR powder overlapping as a measure of reproducibility, making library development for GR possible.
Figure 4.
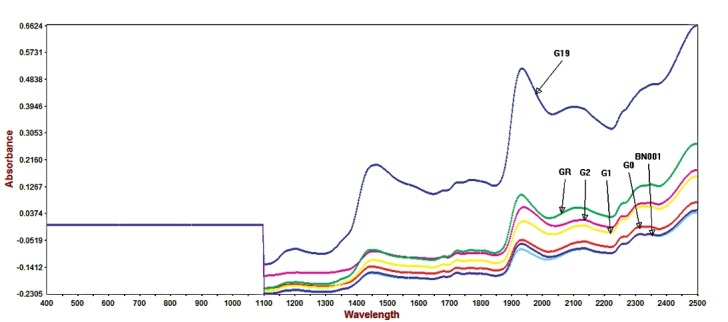
Near infrared spectral of grewia samples
The most prominent absorption bands occurring in the NIR region are related to the overtone and combination bands of the fundamental molecular vibrations of –CH, –NH, and –OH functional groups observed in the mid IR spectral region. NIR absorption bands of grewia gum occurring at longer wavelength are stronger, sharper, and better resolved than their corresponding higher overtone bands, which occur at shorter wavelength, as shown in Figure 4. The functional group present in the sample as revealed by the NIR is –OH. This information correlates well with the data obtained from the DSC, which show a big dome around 100°C, characteristic of water or –OH groups that may be highly branched on the polysaccharide backbone. A combination of these pieces of information with that of 1H NMR is confirmatory of the abundance of –OH groups as the predominant functional group in grewia gum.
In addition to containing information about the chemical composition of grewia, it was possible to obtain information relating to each sample. Particle size differences produced a baseline offset, which was highest with G19. At the same time, G19 had the greatest absorbance because of greater penetration of light, probably due to coarser particles.
NIR is also useful in development of library matching or pattern recognition algorithm to answer the question “Is the material similar to an acceptable material that was previously analyzed?” It was possible to develop library for GR. NIR has found application in the pharmaceutical research in identification of tablet formulations inside blister packages.[28]
In conclusion, refined grewia gum fractions were obtained from the whole gum and some of the physicochemical properties of the fractions were determined. The profiles of fractions of grewia gum such as appearance, aqueous solubility, and molecular information were better than those of the whole gum.
Conclusion
Some physicochemical properties of grewia gum fractions have been investigated using various analytical techniques. The refined grewia gum fractions showed better appearance, improved solubility, and some physicochemical properties compared to the sample obtained by the conventional extraction process.
Acknowledgments
We are grateful to all the graduate students in Dr. Hoag's laboratory (Hanpin Lim, Harris Howard, Ting Wang, and Ravi Kona) for their assistance. We are also grateful to Dr. Ramesh Dandu for his useful suggestions. We are also grateful to Drs. Kellie Hom and Michael Shappiro who respectively ran the experiment with us and interpreted the NMR spectra. Dr. Anjan Nan allowed the use of the nanosizer in his laboratory and we are indebted to him. This work was facilitated by the Fulbright Junior Scholar Development Research Fellowship (ID: 15094004 administered by IIE) sponsored by the United States Government in the 2009/2010 academic session and we are grateful to the US government and the people.
Footnotes
Source of Support: University of Jos, Nigeria for granting the study leave and the United States Government, who, provided the Fulbright Fellowship (ID: 15094004, 2009/2010 session)
Conflict of Interest: None declared.
References
- 1.Emeje M, Isimi C, Kunle O. Effect of grewia gum on the mechanical properties of Paracetamol tablet formulations. Afr J Pharm Pharmacol. 2008;2:1–6. [Google Scholar]
- 2.Muazu J, Musa H, Musa KY. Compression, mechanical and release properties of paracetamol tablets containing acid treated Grewia gum. J Pharm Sci Technol. 2009;1:74. [Google Scholar]
- 3.Okafor IS, Chukwu A. The binding property of grewia gum in sodium salicylate tablets. West Afr J Biol Sci. 2003;14:9–21. [Google Scholar]
- 4.Okafor IS, Danat IM. The influence of granulating solvents on drug release from tablets containing grewia gum. J Pharm Bioresour. 2004;1:76–83. [Google Scholar]
- 5.Nep EI, Okafor IS. Evaluation of the bioadhesive property of Grewia gum in indomethacin tablet formulation in pig gastric mucus. J Pharm Bioresour. 2006;3:62–9. [Google Scholar]
- 6.Ogaji I, Hoag SW. Effect of grewia gum as a suspending agent on ibuprofen paediatric formulation. AAPS Pharm Sci Tech. 2011;12:507–13. doi: 10.1208/s12249-011-9606-1. [DOI] [PMC free article] [PubMed] [Google Scholar]
- 7.Ogaji I, Okafor IS. The film coating potential of grewia gum: Some physicochemical properties of paziquantel tablets. Int J Pharm Res. 2011;3:16–9. [Google Scholar]
- 8.Okafor IS, Chukwu A. Water vapor permeability of aqueous-based grewia gum film. Nigeria J Polym Sci Technol. 2003;3:178–85. [Google Scholar]
- 9.Okafor IS, Chukwu A, Udeala OK. Some physicochemical properties of grewia gum. Nigeria J Polym Sci Technol. 2001;2:161–8. [Google Scholar]
- 10.Nep EI, Conway BR. Characterization of grewia gum, a potential pharmaceutical excipient. J Excip Food Chem. 2010;1:30–40. [Google Scholar]
- 11.Emeje M, Omoyeme I, Isimi C, Ofoefule SI, Kunle O. Isolation, characterization and compaction properties of Afzelia africana gum exudate in hydrochlorothiazide tablet formulations. Afr J Pharm Pharmacol. 2009;3:265–72. [Google Scholar]
- 12.Song D, Song X, Jiang T, Lu Y, Jiang D. Study of rheological characterization of fenugreek gum with modified Maxwell model. Chin J Chem Eng. 2000;8:85–8. [Google Scholar]
- 13.Carvajal-Miller E, Rascon-Chu A, Marquez-Escalante JA, Micard V, Ponce de Leon N, Gardea A. Maize bran gum: Extraction, characterization and functional properties. Carbohydr Polym. 2007;69:280–5. [Google Scholar]
- 14.Bamiro OO, Sinha VR, Kumar R, Odeku OA. Characterization and evaluation of Terminalia randi as abinder in carvedilol tablet formulation. Acta Pharma Sci. 2010;52:254–62. [Google Scholar]
- 15.Services USD fhah. Washington DC: FDA, CDER; 2006. ICH. ICH, Guidelines for industry Q8 pharmaceutical development. [Google Scholar]
- 16.Moreton C. Functionality and performance of excipients in quality by design world part 4: Obtaining information on excipient variability for formulation design space. [Downloaded in May 2011];American Pharmacy Review. 2009 12:28–32. Available from: http://www.phexcom.cn/en/admin/UploadFiles/Technol . [Google Scholar]
- 17.Fu S, Thacker A, Sperger MD, Boni LR, Velankar S, Munson JE, et al. Rheological evaluation of inter-grade and inter-batch variability of sodium alginate. AAPS Pharm Sci Tech. 2010;11:1662–74. doi: 10.1208/s12249-010-9547-0. [DOI] [PMC free article] [PubMed] [Google Scholar]
- 18.Claus EP, Tyler VE. Pharmacognosy. New York: Lea and Febiger; 1965. [Google Scholar]
- 19.Odeku OA, Patani OB. Evaluation of dika nut mucilage (Irvingia gabonensis) as binding agent in metronidazole tablet formulations. Pharm Dev Technol. 2005;10:439–46. doi: 10.1081/pdt-54477. [DOI] [PubMed] [Google Scholar]
- 20.Nasipuri RN, Igwilo CI, Brown SA, Kunle OO. Mucilage from Abelmuschus esculentus (okra) fruits- a potential pharmaceutical raw material; part 1; physicochemical properties. J Pharm Res Dev. 1996;1:22–8. [Google Scholar]
- 21.Uzomah A, Ahiligwo RN. Studies on the rheological properties and functional potentials of achi (Brachystegea eurycoma and ogbono (Irvingia gabonensis) seed gums. Food Chem. 1998;67:217–22. [Google Scholar]
- 22.More solutions to sticky problems- a guide to getting more from your Brookfield viscometer. MA, USA: Brookfield Engineering labs Inc; 2009. Brookfield; p. 79. [Google Scholar]
- 23.Haug A, Smidsrod O. Determination of intrisic viscosity of alginates. Acta Chem Scand. 1962;16:1569–78. [Google Scholar]
- 24.Van Der Reijden WA, Verman EC, Nieuw Amerongen AV. Rheological properties of commercially available polysaccharides with potential use in saliva substitutes. Biorheology. 1994;31:631–42. doi: 10.3233/bir-1994-31604. [DOI] [PubMed] [Google Scholar]
- 25.Woolfe ML, Chaplin MF, Otchere G. Studies on the mucilages extracted from okra fruits (Hibiscus esculentus L.) and baobab leaves (Adansonia digitata L.) J Sci Food Agric. 1977;28:519–29. [Google Scholar]
- 26.Xu X, Liu W, Zhang L. Rheological behavior of aeromonas gum in aqueous solutions. Food Hydrocoll. 2006;20:723–9. [Google Scholar]
- 27.Xu X, Xu J, Zhang Y, Zhang L. Rheology of triple helical Lentinan in solution: Steady shear viscosity and dynamic oscillatory behavior. Food Hydrocoll. 2008;22:735–41. [Google Scholar]
- 28.Aldridge PK, Mushinsky RF, Andino MM, Evans IC. Identification of tablet formulation inside blister packages by near-infrared Spectroscopy. Appl Spectrosc. 1994;48:1272–8. [Google Scholar]


