

Abstract
We show how a bird’s-eye view of genomic structure can be obtained at ∼1-kb resolution from long (∼2 Mb) DNA molecules extracted from whole chromosomes in a nanofluidic laboratory-on-a-chip. We use an improved single-molecule denaturation mapping approach to detect repetitive elements and known as well as unique structural variation. Following its mapping, a molecule of interest was rescued from the chip; amplified and localized to a chromosome by FISH; and interrogated down to 1-bp resolution with a commercial sequencer, thereby reconciling haplotype-phased chromosome substructure with sequence.
Despite the sequencing of thousands of genomes (1), no human genome—reference or individual—has been described to completion (2): gaps remain in the genome reference sequence and there is a discontinuity between the resolution of next-generation sequencing and the resolution of cytogenetics. This gap leaves structure in the kilobase-to-megabase range partly unmapped. The nature and extent of highly repetitive regions—the centromeres, rDNA on the short arms of acrocentric chromosomes, the long arm of the Y chromosome—remain to be fully delineated, as do the sequences embedded in these regions. Sequencing of individual genomes (3) has also revealed that chromosome-scale amounts of sequence do not align to the human reference genome (4, 5), suggesting that substantial levels of sequence insertions are specific to individuals or subpopulations. Structural variation (SV) comprising rearrangement, loss, or gain of genomic regions is increasingly linked to phenotype and disease (6, 7). In cancer genomes, SV can be extreme (8) and difficult to deconvolve.
All types and scales of SV pervade the human genome, but a single approach cannot capture them all (9). For example, though unbalanced SV can be readily ascertained by array technology, balanced SV cannot; a comprehensive analysis by paired-end sequencing is challenging and cost-prohibitive. Single-molecule optical mapping (10–13) facilitates assembly of genomes and detects SV, but haplotype phase is not preserved, because it requires construction of a consensus map from many molecules. These molecules cannot be recovered for further analysis, requiring larger amounts of sample for analysis, which may not be available, e.g., single-cell sequencing and clinical samples. An attempt to combine haplotyping and sequencing on Illumina flow cells was limited to sequencing only at the ends of short fragments (≤8 kb) (14).
Microfluidic laboratory-on-a-chip devices have been used to separate individual chromosomes and extract genomic DNA (15, 16), enabling haplotype-phased genotype and sequence to be obtained. Meanwhile, laboratory-on-a-chip systems incorporating nanofluidics have been used to stretch and map DNA (17–19), but their application to detecting SV has remained theoretical due to technical limitations of the designs used. Existing platforms either do not stretch and hold DNA well enough to consistently produce accurate maps from a single molecule (20, 21), or they use inefficient labeling chemistry (22) and consequently cannot differentiate between poor matches and actual structural variation within a single molecule. These platforms also require purified input DNA, which is typically sheared during handling steps, cannot produce maps longer than a few hundred kilobases, and cannot readily recover the mapped DNA molecules to perform conventional genomic analysis. Finally, although confinement in nanochannels can provide high stretching under extreme buffer conditions (23), it is desirable to achieve full stretching independently of buffer composition.
Here we describe a laboratory-on-a-chip design that overcomes these technical limitations and a procedure that offers an integrated view of human genome structure. By integrating a nanofluidic system with elongation flow into a laboratory-on-a-chip, (i) haplotype-phased chromosome substructures can be visualized on single megabase-scale molecules, (ii) structural variation ranging in size from a few kilobases to megabases can then be detected, (iii) our experimental maps can be compared with theoretical maps based on different genome assemblies, and variations can be detected, and (iv) interrogation of the same molecule can be zoomed out to the cytogenetic level and zoomed in to the sequence level.
Results
DNA Extraction in a Laboratory-on-a-Chip Device Enables Megabase Lengths of Chromosomal DNA to Be Mapped.
We combined DNA extraction, stretching, mapping, and recovery in a laboratory-on-a-chip design that was fabricated with conventional UV lithography and reactive ion etching (Fig. 1). Stained metaphase chromosomes isolated from human cell culture were used as carriers to deliver intact, single DNA molecule payloads of unprecedented lengths (>2 Mb) from pipette tip to the micro/nanofluidic device (Fig. 1A). DNA was extracted from chromosomes in the inlet port of the device and partially denatured before being renaturated again (Fig. 1A). Flow conditions minimized shear stress on the long DNA molecule during its transport from bulk solution at the inlet port through the microchannel to the nanoslit where it was stretched to a linear configuration and imaged.
Fig. 1.
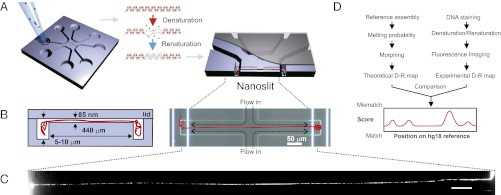
Fluidic chip design, DR mapping, and detection of SV in a single DNA molecule. (A) The chip is loaded with cell extract enriched in metaphase chromosomes. Stained DNA is partially denatured and renatured, creating a fluorescence pattern (DR map). (B) The inlet ports of the chip connect to 5- to 10-μm-deep microchannels for DNA handling, which feed into an 85-nm shallow nanoslit. This nanoslit effectively confines DNA molecules to 2D and stretches them by opposing fluid flows from a second, perpendicular nanoslit. A megabase pair-long DNA fragment is (B) flow-stretched and (C) imaged, and (D) its DR map is compared locally to the reference genome’s (hg18); chromosomal origin and structural variations are detected as good vs. poor matches.
Because the stained DNA had undergone denaturation–renaturation (DR), a DR map composed of light and dark regions could be observed over contiguous megabase-lengths of each individual molecule. Light regions had been less denatured, and hence lost less intercalating dye, due to higher CG content, whereas the reverse was true for the AT-rich dark regions.
Hydrodynamic Flow and Nanoconfinement Elongates Chromosomal DNA to Crystallographic Length.
Hydrodynamic drag stretched the molecule up to 98% of DNA’s crystallographic length of 0.34 nm/bp (SI Appendix). This stretching totally suppressed longitudinal Brownian motion of the molecule, enabling DR mapping of a single molecule with maximal resolution across large maps: because longitudinal motion blur was nonexistent, maps from overlapping fields-of-view could be merged with perfect matching in overlap regions, without any rescaling, correction for drift, or morphing (9, 20, 21) (SI Appendix, Fig. S3).
DR Map from a Single Megabase-Long Chromosome Fragment Can Be Localized to the Human Genome.
The genome of an African male (NA18507) that has been studied extensively by sequencing (24–26) was used to assess the performance of our single-molecule mapping technique. DR maps of NA18507 single molecules were compared with an in silico theoretical DR map computed from the sequence of the human reference genome version 18 (hg18) using Bubblyhelix (www.bubblyhelix.org) (27) (Materials and Methods).
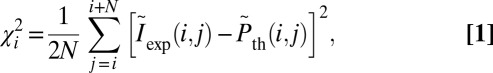
Single DNA molecules were localized to their origin in the genome with the algorithm used in Reisner et al. (20) for consensus denaturation maps from multiple molecules: briefly, a subset of Lbc consecutive pixels of the experimental DR map (a “barcode”) was compared with the theoretical map by calculating a match score—the figure-of-merit function,  —for each position along the theoretical DR map (SI Appendix, Localizing a Single DNA-Molecule Within the Genome),
 |
with  denoting normalized intensities on the experimental DR map, and
  denoting the corresponding probabilities on the theoretical map. The position in the reference genome where
  is minimal is the origin of the DR-mapped DNA molecule, when the P value for accidental alignment is vanishing small (SI Appendix, Fig. S4A).
We picked 21 molecules at random among 50+ we had DR mapped. We identified each molecule’s origin within the human genome unambiguously (SI Appendix, Table S1). For comparison, (i) Reisner et al. (20) averages over 40 denaturation maps of identical molecules for noise reduction before localizing their origin; (ii) recent mapping of Saccharomyces cerevisiae DNA succeeded in localizing 82% of individual molecules with correctly formed barcodes within a genome that is 100+ times smaller (21). Our success rate, 21/21, involves some luck, however: If one of those 21 molecules had come from an unmapped part of the human genome, we would have failed to identify its chromosomal origin. Similarly, molecules from Jurkat cells could not be identified using the barcode approach (see below), likely due to extensive structural variation.
Haplotype-Phased SV Is Detected on a Single DNA Molecule.
After a molecule has been localized within the genome, structural variations are detected by piecewise comparison of the molecule’s experimental DR map (each piece is a barcode) and the in silico maps computed from the reference genome. We call this sliding-window analysis. Here a window containing a barcode slides across the full reference DR map, and each barcode is mapped to its location in the genome. The match score  is plotted against the position in the reference genome (SI Appendix, Fig. S6). The
  signal is highly reproducible, as demonstrated in SI Appendix, Fig. S13; we use this to detect SVs and identify typical patterns in
  for various types of SVs (Fig. 2).
Fig. 2.
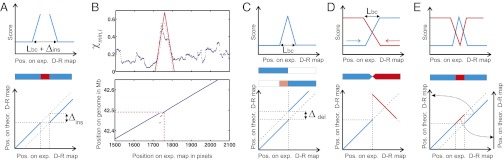
How to detect multiple types of SV with sliding-window analysis. SV is detected by a characteristic peak in the score plots (A–E, Upper), which show the best match score  as a window of a given length (Lbc) is slid along the DR map. The size and type of SV is further determined from position plots (A–E, Lower), which compare the location of the sliding window to the location in the reference genome that gives the best match; these produce a continuous 45° line when no SV is present. Characteristic signals for both plots are shown for (A) insertions, whose length (Δins) can be determined from position plot, illustrated by (B) experimental data showing a 7-kb insertion (SI Appendix, Fig. S11). (C) Deletions are similarly detected. (D) Large-scale inversions are detected by comparing the match scores of the DR map to the direct (blue) and inverted (red) reference genome, which intersect at the inversion breakpoint. (E) Large-scale translocations/insertions (Δins > Lbc) can be identified as in A (blue) and identified (E) by comparison with the reference genome at the origin of the translocated segment (red).
Detecting Large SV >0.1 Mb: Insertions, Deletions, Inversions, and Translocations.
A structural variation that covers more base pairs than the individual barcodes that revealed it can be read directly off the figure-of-merit plot. Thus, we identified the characteristic patterns of an inversion (Fig. 2D) and a translocation (Fig. 2E) in the figure-of-merit plots of two molecules from the NA18507 genome for which initial barcode matching had suggested a chromosome 16 origin (Fig. 3A) and a chromosome 19 origin (Fig. 3B), respectively. Both matches were extremely unlikely to have occurred by chance (P = 5 ⋅ 10−12 and P = 4 ⋅ 10−4, respectively).
Fig. 3.

Detection of SV in single fragments of the NA18507 genome. (A) The DNA molecule is found to originate from chr16 (blue). Comparing the DR map again to the reverse-orientation chr16 reference sequence (red) reveals an inversion larger than 0.5 Mb at position 21.4 Mb in the DNA sample. The ∼140-kb fragment at the junction can be read both ways. (B) Similarly, another molecule largely matches chr19 (blue, 61.4–62.7 Mb), but includes a ∼130-kb translocation from chr9 (red, ∼22.1–22.3 Mb).
In the molecule that matched to chromosome 16 (Fig. 3A), we saw a large genomic inversion (>0.5 Mb) with a ∼140-kb overlapping region. This inversion was previously detected by paired fosmid end sequencing of the NA18507 genome (28) and is a variant that has been frequently observed in individual genomes [e.g., the Venter genome (4) is homozygous for this inversion]. The molecule, whose map matched best to a subtelomeric region of chromosome 19, contained a central portion that belonged to chromosome 9 (Fig. 3B), according to the reference genome. This observation can be explained as a copy number polymorphism/segmental duplication or a translocation. The chromosome 9 insertion is between two genic regions on chromosome 19; there are no segmental duplications or SVs reported in the UCSC Genome Browser (http://genome.ucsc.edu/) for this region, but duplications are known to be ∼10-fold enriched within subtelomeric regions (29). We also observed several other well-delimited cases of poor matching (manifested as peaks in  ; see below) between experimental DR maps and in silico maps based on the hg18 reference; they suggest the presence of smaller SVs.
Detecting Small SV <0.1 Mb: Insertions and Deletions.
Even for SV significantly smaller than the barcode, insertions and/or deletions yield characteristic features of the figure-of-merit plot (Fig. 2 A–C). As the barcode is “slid” across the breakpoint of a structural variant, the match score  increases significantly due to local mismatching of the barcode to the reference DR map, and then decreases again as the barcode passes the SV. The slope of the increase and decrease is a function of the barcode length and therefore produces a characteristic signal (SI Appendix, Detecting Structural Variations). When plotting the position bi on the theoretical DR map vs. the origin i of each barcode on the experimental DR map, the corresponding pairs of values, (i, bi), will deviate from the (almost) straight line: they will follow it before the SV is encountered, and they will follow another, but parallel, straight line after passing the SV. An insertion (Fig. 2 A and B) in the experimental map relative to the theoretical map will shift the (i, bi) line downward, whereas a deletion will shift the line upwards (Fig. 2C). The size of this shift reveals the size of the variation. We therefore can identify the location of the SV from the peak in
  and the size of the SV from the shift of the (i, bi) line.
We successfully used this method to detect small SVs. For example, in a molecule that mapped to chromosome 7 from 41.6 to 42.8 Mb, the  plot indicated that SV was present at 42,491 kb, as observed in Fig. 2B (see Fig. 5B). The shifts observed in the (i, bi) line indicated the SVs as an insertion of 7 kb. Previous studies of NA18507 (25) and of NA19129 (28) observed deletions in this region. The structural variation we observe, however, is not a simple, isolated insertion: the width of the peak indicated by the red lines in Fig. 2B marks a 15-kb region, which clearly matches better than the 7-kb region marked by the dashed gray lines; this difference suggests a collection of several different variations adding up to a ∼7-kb insertion over a 15-kb interval.
Fig. 5.

Comparison of SV in genomic assemblies. DR maps of two different chromosomes, 17 (A) and 7 (B), are compared with assemblies by Li et al. (24) (blue) and the hg18 reference (red) using the sliding-window method, as shown in i. The locations of the SV between hg18 and that reported by Li et al. (24) (blue), McKernan et al. (25) (pink), and Kidd et al. (28) (green boxes, width indicates uncertainty), are shown in ii. Quantitative comparison between genome assemblies using the DR maps, shown in iii, shows that regions where the hg18 assembly was a better fit 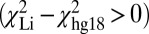 corresponded to areas where the Li et al. (24) assembly incorrectly identified large SV (>1 kb), whereas regions where the assembly was a better fit
  were found in locations where the authors identified a collection of smaller structural variants.
Mapped DNA Molecules Can Be Recovered to Provide Complementary Genomic Analysis.
The DR map of a single molecule bridges the gap between the bird’s-eye view of cytogenetics and the worm’s-eye view of current-generation DNA sequencing. We expanded our analysis to a genome with known instability to explore how on-chip DR mapping could be coupled with conventional genomic analysis, such as DNA sequencing, genotyping, and FISH, and thereby reconcile genetic variation of all length scales. Metaphase chromosomes from an acute T-cell leukemia cell line (Jurkat) exhibit substantial mosaicism and genome instability at the cytogenetic level, as observed by multicolor FISH (mFISH) of cultured Jurkat cells at a typical ∼2-Mb resolution (SI Appendix, Fig. S15).
Jurkat chromosomes were loaded onto the laboratory-on-a-chip device, and DR maps were generated. The visual images of the mapped DNA are striking: long-range structure is readily apparent, with two blocks of repetitive elements clearly visible as repeating patterns along the DNA molecule, as shown in Fig. 4A. Analysis of the DR maps allowed us to determine the repeat unit lengths, 40.4 ± 0.5 kb and 6.3 ± 0.1 kb, from the periodicity. The genomic instability that we observed extended to scales below the DR mapping as well: Barcodes from the Jurkat DR maps did not map to the reference genome, suggesting that Jurkat DNA repeatedly differs from the reference assembly at sub–2-Mb level in the realm between the scales that can be captured by sequencing and FISH.
Fig. 4.

Workflow of integrated DR mapping and conventional genomics. (A) DR map of a single molecule from the Jurkat genome with two repeat features (R1, R2). A nonrepeat (NR) element is shown for comparison. Unique barcodes from the region between R1 and R2 failed to find significant match to any chromosomes in hg18, but reveals (B) that long-range repetitive elements are present. (Scale bar: 10 μm.) (C) A molecule is rescued and amplified, and sequencing and FISH analysis provides complementary information (D). (E) Sequencing reads are mapped to the reference genome to identify the origin of the rescued molecule as well as SNPs and short insertions/deletions (SI Appendix), and (F) FISH provides a bird’s-eye chromosomal view and confirmation of the origin identified by sequencing.
To analyze the DNA at the sequence level, we used our laboratory-on-a-chip device to recover a DR-mapped DNA molecule, amplified it, and then carried out next-generation DNA sequencing and FISH analysis. Comparing the sequencing reads to the reference genome (Fig. 4E; SI Appendix, Fig. S14) suggested the molecule originated from a 3-Mb region of chromosome 9, centered on ∼110 Mb. This position is colocal with the 9q31.2 chromosome band identified by FISH (Fig. 4F).
The sequence information also allowed us to assess whether our data derived from a single haplotype and to confirm that we had isolated a single DNA molecule. We compared the rates of heterozygosity in the genotype of the Jurkat genome (47/70 SNPs) to our sequencing data from the rescued molecule (0/70 SNPs), which confirmed that we had indeed isolated a single molecule and hence a single haplotype.
This rescue-and-sequence option is unique to our method of single-molecule mapping. With this option we have demonstrated how single-molecule mapping, sequencing, and cytogenetics can be combined to produce a comprehensive interrogation of a large genomic region by looking at just a single molecule.
Discussion
The comprehensive detection of SV remains challenging, particularly because the sets of SVs determined with different experimental methods overlap only partially (2). We consequently tested our technique on the NA18507 genome of a male from Yoruba in Ibaden, Nigeria, for which three previous studies had reported SVs. Kidd et al. (28) sequenced both insert ends of fosmid clones by the Sanger method. McKernan et al. (25) used mate-pair libraries and next-generation two-base color-coded SOLiD sequencing. Both approaches discovered SV by detecting reads that, in comparison with reference, differed from the expected insert size or orientation. In contrast, Li et al. (24) used de novo assembly of short reads from an Illumina Genome Analyzer to generate contigs, which were compared with the reference; instances of discordance were reported as SV. This approach could not access heterozygous SV or SV in repetitive regions, and did not analyze SVs larger than 50 kb.
We used DR maps from NA18507 to compare the genome assembly from Li et al. (24) and the reference human genome (hg18). In cases where Li et al. (24) suggested SVs larger than ∼1 kb, the experimental DR maps almost always fit better to the unmodified hg18 reference—i.e., with a lower χ2 value—than the assembly based on Li et al.’s (24) data, which fits with a larger χ2 value (Fig. 5A). Comparisons to SVs determined by mate-pair sequencing had better concordance with the SV determined by experimental DR maps, but the deletions observed by McKernan et al. (25) on NA18507 and by Kidd et al. (28) on NA19129 cannot account for the large isolated insertion (7 kb) we found at 42,491 ± 4 kb (Fig. 5B). We conclude that this is a previously uncharacterized variant detected in a variant-prone area of the genome. In the same region, however, an assembly of many small variants from the set by Li et al. (24) made the DR map fit this assembly better than it fits the hg18 reference, which indicates that de novo assembly is better suited to discovering small variants and that at longer lengths the verity of de novo assembly breaks down. Indeed, recent comparisons have shown that different de novo assembly algorithms produce large differences in assembly (30).
A wide range of SVs can be detected with our method, from a few kilobases up to the size of the fragments isolated (a few megabases). This size range lies between the detection limits of SV detection with DNA sequencing and cytogenetics. There might be variants that do not lead to a visible change in local base composition at a given temperature; these might be captured by integrating data from maps taken at multiple denaturation temperatures. Nevertheless, it was demonstrated that experimental DR maps of single molecules can be used to compare and evaluate de novo assemblies by comparing χ2 values of the DR maps to different assemblies (Fig. 5). Thus, DR maps, like other optical maps (31, 32), have the potential to guide de novo assemblies of entire genomes.
Our approach has some distinct advantages: (i) There is little chance of DNA loss, particularly if effective chip passivation is used, because DNA is extracted and interrogated on the same chip; (ii) the overall workflow (Fig. 4C) is simple; (iii) fabrication of chips used here requires no nanolithography, so low-cost injection-molded plastic chips might be used (33); and (iv) the process is amenable to automation, because analysis is done directly on unamplified genomic DNA, and the only reagent required is intercalating dye. Compared with the laboratory-on-a-chip technologies based on nanochannels, the present device gives a higher stretching independently of the buffer composition (∼98% vs. 50–90%) (20, 22, 23).
The fact that we obtain a robust map from just one molecule opens new avenues: single-molecule genomic maps from single cells could be determined, enabling, for example, characterization of cellular heterogeneity within solid tumors and examination of rare cells from blood or metagenomic samples. More specifically, the ultra-long-range, high-resolution DR maps of the genome that are obtained, will enable investigation of inversions and repetitive elements known to be sources of phenotypic variation but not easy to detect (34). Our integrated approach will enable long-range haplotype phase to be added to genome sequence and structure without resort to cloning (35), pedigree analysis, or population inference (36), with implications for many fields, including cancer genomics, plant genetic breeding, clinical genetics, and tissue-matching for transplantation.
Materials and Methods
On-Chip DNA Extraction from Chromosomes.
The nanofluidic device comprises inlet ports and microchannels at a depth of 5 μm connecting a cross-shaped nanoslit having a depth of 85 nm. The device was mounted onto a chuck that enables solution to be pipetted in and out of the inlet/outlets and to connect air hoses for creating flows into the device. BSA at 1 mg/mL was flushed through the device for 5 min using a 100-millibar pressure drop. Then 30 μL of 0.1 mg/mL Proteinase K in buffer [0.1 mg/mL BSA, 3% (vol/vol) 2-Mercaptoethanol, 0.5% Triton-X, and 0.5× degassed Tris-borate EDTA] was loaded into the inlet port; immediately after, 5 μL of stained cell extract containing 50–100 chromosomes was added. Protease digestion of the chromosomes was performed by heating the temperature of the solution inside the wells to 37–40 °C with a heating cartridge at the center of the chuck in contact with the backside of the device (16).
DR Mapping Acquisition.
After sealing the openings, the chuck with the mounted device was moved to a convection oven at 90 °C (alternatively, a water bath at 76 °C), and the heating cartridge was set to 76 °C. The temperature of the solution inside the wells of the chuck increased and stabilized at 76 °C within 30 min (shorter for the water bath). This ramp was less than 0.5 °C/min. The temperature was kept at 76 °C for a few minutes before the chuck was set on ice, which cooled the solution inside the wells to room temperature within 3 min. The same maximum annealing temperature was used in all experiments and was chosen to maximize the contrast by adjusting it to the global melting temperature of the DNA at the salt concentration used. The melting temperature is defined as the temperature where 50% of the base pairs are open/closed. The local melting temperature may vary considerably from the global one, and these local differences produce the light and dark regions that make up the DR map. The digested contents of the inlet cavity were flowed into the microchannel at a pressure drop below 20 millibars. When close to the slit entrance, the DNA was forced in by pressure applied to both inlet ports of the microchannel (SI Appendix, Fig. S1A). When free DNA ends occupied opposite microchannels (SI Appendix, Fig. S1B), the pressure drop across the slit was reduced. The DNA was manipulated in a left/right motion by manipulating the flow between microchannels. The DNA was flow-stretched (SI Appendix, Fig. S1C) by applying up to 80-millibar excess pressure simultaneously to the two inlet slit arms. The DNA was imaged through an objective (Nikon) with a 60×/1.40 N.A. (alternatively 60×/1.00 for silicon devices) plus 1.5× further magnification, giving a 90-μm field of view. The images were recorded with an electron multiplying charge-coupled device camera (Photometrics Cascade II512) using 50-ms exposure and maximum gain. Images covering the whole slit were created by overlapping neighboring fields of view.
Recovery of Mapped DNA Molecule for Conventional Analysis.
After imaging the stretched DNA in the nanoslit, the DNA fragment was flushed from the nanoslit into one of the outlet ports free of DNA before receiving the imaged molecule. Using a 200-millibar pressure drop, the contents of the microchannel were flushed to one of the wells and collected by micropipetting (typically 10 μL) using a silanized pipette tip. The sample was amplified by multiple displacement amplification (Qiagen), and its analysis is described in SI Appendix.
Bubblyhelix.
The program Bubblyhelix (www.bubblyhelix.org) (27) is an implementation of the Poland–Scheraga model for the thermodynamics of the helix–coil transition of DNA. The program takes as input measured values for the enthalpies and entropies of the 10 independent base-pair duplexes, which depend on the salt concentration. Entropic contributions from internal loops are also included (37, 38).
Supplementary Material
Acknowledgments
We thank Alexander Kanapin of the Wellcome Trust Center for Human Genetics (WTCHG) Bioinformatics core for assembling the data from Y. Li and coworkers; WTCHG Genomic Services for running Illumina sequencing; Giuseppe Scozzafava for preparing NA18507 chromosomes; Daniela Moralli for running mFISH; Samantha Knight and Elham Sadighi Akha for running Illumina genotyping; and Eivind Tostesen for his software Bubblyhelix. Funding for this research was provided by European Union’s Seventh Framework Programme FP7/2007-2013 under Grants 201418 (READNA) and 278204 (Cellomatic); Carlsbergfondet Project 2008-01-0395; Danish Council for Independent Research–Natural Sciences (J.N.P.); Danish Council for Strategic Research Grant 10-092322 (PolyNano); the UK Royal Society (K.U.M.); the University of Oxford NDM Proof of Principle Sequencing Fund; Wellcome Trust Grant 090532/Z/09/Z; and the Rhodes Trust (D.L.V.B.).
Footnotes
The authors declare no conflict of interest.
*This Direct Submission article had a prearranged editor.
This article contains supporting information online at www.pnas.org/lookup/suppl/doi:10.1073/pnas.1214570110/-/DCSupplemental.
References
- 1.Abecasis GR, et al. 1000 Genomes Project Consortium A map of human genome variation from population-scale sequencing. Nature. 2010;467(7319):1061–1073. doi: 10.1038/nature09534. [DOI] [PMC free article] [PubMed] [Google Scholar]
- 2.Alkan C, Coe BP, Eichler EE. Genome structural variation discovery and genotyping. Nat Rev Genet. 2011;12(5):363–376. doi: 10.1038/nrg2958. [DOI] [PMC free article] [PubMed] [Google Scholar]
- 3.Mir KU. Sequencing genomes: From individuals to populations. Brief Funct Genomics Proteomics. 2009;8(5):367–378. doi: 10.1093/bfgp/elp040. [DOI] [PubMed] [Google Scholar]
- 4.Levy S, et al. The diploid genome sequence of an individual human. PLoS Biol. 2007;5(10):e254. doi: 10.1371/journal.pbio.0050254. [DOI] [PMC free article] [PubMed] [Google Scholar]
- 5.Ahn SM, et al. The first Korean genome sequence and analysis: Full genome sequencing for a socio-ethnic group. Genome Res. 2009;19(9):1622–1629. doi: 10.1101/gr.092197.109. [DOI] [PMC free article] [PubMed] [Google Scholar]
- 6.Hurles ME, Dermitzakis ET, Tyler-Smith C. The functional impact of structural variation in humans. Trends Genet. 2008;24(5):238–245. doi: 10.1016/j.tig.2008.03.001. [DOI] [PMC free article] [PubMed] [Google Scholar]
- 7.Stankiewicz P, Lupski JR. Structural variation in the human genome and its role in disease. Annu Rev Med. 2010;61:437–455. doi: 10.1146/annurev-med-100708-204735. [DOI] [PubMed] [Google Scholar]
- 8.Stephens PJ, et al. Massive genomic rearrangement acquired in a single catastrophic event during cancer development. Cell. 2011;144(1):27–40. doi: 10.1016/j.cell.2010.11.055. [DOI] [PMC free article] [PubMed] [Google Scholar]
- 9.Teague B, et al. High-resolution human genome structure by single-molecule analysis. Proc Natl Acad Sci USA. 2010;107(24):10848–10853. doi: 10.1073/pnas.0914638107. [DOI] [PMC free article] [PubMed] [Google Scholar]
- 10.Schwartz DC, et al. Ordered restriction maps of Saccharomyces cerevisiae chromosomes constructed by optical mapping. Science. 1993;262(5130):110–114. doi: 10.1126/science.8211116. [DOI] [PubMed] [Google Scholar]
- 11.Xiao M, et al. Rapid DNA mapping by fluorescent single molecule detection. Nucleic Acids Res. 2007;35(3):e16. doi: 10.1093/nar/gkl1044. [DOI] [PMC free article] [PubMed] [Google Scholar]
- 12.Neely RK, et al. DNA fluorocode: A single molecule, optical map of DNA with nanometre resolution. Chem Sci. 2010;1:453–460. [Google Scholar]
- 13.Das SK, et al. Single molecule linear analysis of DNA in nano-channel labeled with sequence specific fluorescent probes. Nucleic Acids Res. 2010;38(18):e177. doi: 10.1093/nar/gkq673. [DOI] [PMC free article] [PubMed] [Google Scholar]
- 14.Schwartz JJ, Lee C, Hiatt JB, Adey A, Shendure J. Capturing native long-range contiguity by in situ library construction and optical sequencing. Proc Natl Acad Sci USA. 2012;109(46):18749–18754. doi: 10.1073/pnas.1202680109. [DOI] [PMC free article] [PubMed] [Google Scholar]
- 15.Fan HC, Wang J, Potanina A, Quake SR. Whole-genome molecular haplotyping of single cells. Nat Biotechnol. 2011;29(1):51–57. doi: 10.1038/nbt.1739. [DOI] [PMC free article] [PubMed] [Google Scholar]
- 16.Rasmussen KH, et al. A device for extraction, manipulation and stretching of DNA from single human chromosomes. Lab Chip. 2011;11(8):1431–1433. doi: 10.1039/c0lc00603c. [DOI] [PubMed] [Google Scholar]
- 17.Tegenfeldt JO, et al. From the cover: The dynamics of genomic-length DNA molecules in 100-nm channels. Proc Natl Acad Sci USA. 2004;101(30):10979–10983. doi: 10.1073/pnas.0403849101. [DOI] [PMC free article] [PubMed] [Google Scholar]
- 18.Levy SL, Craighead HG. DNA manipulation, sorting, and mapping in nanofluidic systems. Chem Soc Rev. 2010;39(3):1133–1152. doi: 10.1039/b820266b. [DOI] [PubMed] [Google Scholar]
- 19.Napoli M, Eijkel JCT, Pennathur S. Nanofluidic technology for biomolecule applications: A critical review. Lab Chip. 2010;10(8):957–985. doi: 10.1039/b917759k. [DOI] [PubMed] [Google Scholar]
- 20.Reisner W, et al. Single-molecule denaturation mapping of DNA in nanofluidic channels. Proc Natl Acad Sci USA. 2010;107(30):13294–13299. doi: 10.1073/pnas.1007081107. [DOI] [PMC free article] [PubMed] [Google Scholar]
- 21.Welch RL, Sladek R, Dewar K, Reisner WW. Denaturation mapping of Saccharomyces cerevisiae. Lab Chip. 2012;12(18):3314–3321. doi: 10.1039/c2lc40504k. [DOI] [PubMed] [Google Scholar]
- 22.Lam ET, et al. Genome mapping on nanochannel arrays for structural variation analysis and sequence assembly. Nat Biotechnol. 2012;30(8):771–776. doi: 10.1038/nbt.2303. [DOI] [PMC free article] [PubMed] [Google Scholar]
- 23.Kim Y, et al. Nanochannel confinement: DNA stretch approaching full contour length. Lab on a Chip. 2011;11(10):1721–1729. doi: 10.1039/c0lc00680g. [DOI] [PMC free article] [PubMed] [Google Scholar]
- 24.Li Y, et al. Structural variation in two human genomes mapped at single-nucleotide resolution by whole genome de novo assembly. Nat Biotechnol. 2011;29(8):723–730. doi: 10.1038/nbt.1904. [DOI] [PubMed] [Google Scholar]
- 25.McKernan KJ, et al. Sequence and structural variation in a human genome uncovered by short-read, massively parallel ligation sequencing using two-base encoding. Genome Res. 2009;19(9):1527–1541. doi: 10.1101/gr.091868.109. [DOI] [PMC free article] [PubMed] [Google Scholar]
- 26.Bentley DR, et al. Accurate whole human genome sequencing using reversible terminator chemistry. Nature. 2008;456(7218):53–59. doi: 10.1038/nature07517. [DOI] [PMC free article] [PubMed] [Google Scholar]
- 27.Tøstesen E, Liu F, Jenssen TK, Hovig E. Speed-up of DNA melting algorithm with complete nearest neighbor properties. Biopolymers. 2003;70(3):364–376. doi: 10.1002/bip.10495. [DOI] [PubMed] [Google Scholar]
- 28.Kidd JM, et al. Mapping and sequencing of structural variation from eight human genomes. Nature. 2008;453(7191):56–64. doi: 10.1038/nature06862. [DOI] [PMC free article] [PubMed] [Google Scholar]
- 29.Bailey JA, Yavor AM, Massa HF, Trask BJ, Eichler EE. Segmental duplications: Organization and impact within the current human genome project assembly. Genome Res. 2001;11(6):1005–1017. doi: 10.1101/gr.187101. [DOI] [PMC free article] [PubMed] [Google Scholar]
- 30.Earl D, et al. Assemblathon 1: A competitive assessment of de novo short read assembly methods. Genome Res. 2011;21(12):2224–2241. doi: 10.1101/gr.126599.111. [DOI] [PMC free article] [PubMed] [Google Scholar]
- 31.Lai Z, et al. A shotgun optical map of the entire Plasmodium falciparum genome. Nat Genet. 1999;23(3):309–313. doi: 10.1038/15484. [DOI] [PubMed] [Google Scholar]
- 32.Zhou S, et al. Validation of rice genome sequence by optical mapping. BMC Genomics. 2007;8:278. doi: 10.1186/1471-2164-8-278. [DOI] [PMC free article] [PubMed] [Google Scholar]
- 33.Utko P, Persson F, Kristensen A, Larsen NB. Injection molded nanofluidic chips: Fabrication method and functional tests using single-molecule DNA experiments. Lab Chip. 2011;11(2):303–308. doi: 10.1039/c0lc00260g. [DOI] [PubMed] [Google Scholar]
- 34.Mir KU, Southern EM. Sequence variation in genes and genomic DNA: Methods for large-scale analysis. Annu Rev Genomics Hum Genet. 2000;1:329–360. doi: 10.1146/annurev.genom.1.1.329. [DOI] [PubMed] [Google Scholar]
- 35.Kitzman JO, et al. Haplotype-resolved genome sequencing of a Gujarati Indian individual. Nat Biotechnol. 2011;29(1):59–63. doi: 10.1038/nbt.1740. [DOI] [PMC free article] [PubMed] [Google Scholar]
- 36.Browning SR, Browning BL. Haplotype phasing: Existing methods and new developments. Nat Rev Genet. 2011;12(10):703–714. doi: 10.1038/nrg3054. [DOI] [PMC free article] [PubMed] [Google Scholar]
- 37.Blake RD, Delcourt SG. Thermal stability of DNA. Nucleic Acids Res. 1998;26(14):3323–3332. doi: 10.1093/nar/26.14.3323. [DOI] [PMC free article] [PubMed] [Google Scholar]
- 38.Blossey R, Carlon E. Reparametrizing the loop entropy weights: effect on DNA melting curves. Phys Rev E Stat Nonlin Soft Matter Phys. 2003;68(6 Pt 1):061911. doi: 10.1103/PhysRevE.68.061911. [DOI] [PubMed] [Google Scholar]
Associated Data
This section collects any data citations, data availability statements, or supplementary materials included in this article.