Abstract
Many recent studies on ultrasonic particle image velocimetry (Echo PIV) showed that the accuracy of two-dimensional (2-D) flow velocity measured depends largely on the concentration of ultrasound contrast agents (UCAs) during imaging. This article presents a texture-based method for identifying the optimum microbubble concentration for Echo PIV measurements in real-time. The texture features, standard deviation of gray level, and contrast, energy and homogeneity of gray level co-occurrence matrix were extracted from ultrasound contrast images of rotational and pulsatile flow (10 MHz) in vitro and in vivo mouse common carotid arterial flow (40 MHz) with UCAs at various concentrations. The results showed that, at concentration of 0.8~2 × 10³ bubbles/mL in vitro and 1~5 × 10⁵ bubbles/mL in vivo, image texture features had a peak value or trough value, and velocity vectors with high accuracy can be obtained. Otherwise, poor quality velocity vectors were obtained. When the texture features were used as a feature set, the accuracy of K-nearest neighbor classifier can reach 86.4% in vitro and 87.5% in vivo, respectively. The texture-based method is shown to be able to quickly identify the optimum microbubble concentration and improve the accuracy for Echo PIV imaging.
Keywords: Echo PIV, Flow imaging, Ultrasound contrast agents, Microbubbles, Texture analysis
INTRODUCTION
Accurate measurement of multidimensional velocity profiles in arteries is essential both as a prognostic aid and a therapeutic procedure of many cardiovascular diseases as the developments of many such diseases have been shown to have a close relationship with arterial blood flow velocity profiles (Cheng et al. 2006, 2008; Jiang et al. 2000). Ultrasonic particle image velocimetry (Echo PIV) technique is a synthesis of two existing techniques, particle image velocimetry and B-mode ultrasound contrast imaging (Kim et al. 2004b). It consists of identifying and tracking ultrasound contrast agents (UCAs) within a flow field and computing local velocity vectors using a cross-correlation algorithm. Previous studies have shown that Echo PIV could be a promising technique for noninvasive measurement of velocity profiles in arteries (Kim et al. 2004a; Niu et al. 2010; Qian et al. 2010; Zhang et al. 2011; Zheng et al. 2006). However, in Echo PIV technique, the concentration of UCAs determines the characterization of the B-mode images of the seeded flows and thereby affects the cross-correlation quality and the measurement accuracy (Kim et al. 2004b; Liu et al. 2008). Small variations in microbubble concentration can cause large variations in ultrasound image quality and subsequently the measured velocities. Thus, it is vital to identify the optimum microbubble concentration for Echo PIV. Several methods have been developed to identify the optimum concentration for UCAs or other scatters in dynamic fluids. For instance, Kim et al. 2004b have used the raw B-mode data before scan conversion and second-harmonic imaging to investigate the optimum concentration of UCAs for Echo PIV. Liu et al. 2008 have proposed the particle imaging cross-correlation index method to obtain the optimum concentration of UCAs. Tsui et al. 2004 have showed that the Nakagami parameter can be used to detect the variation of the scatterers (glass beads) concentration.
A real-time texture-based method appears as a complementary approach to identify the optimum UCAs concentration for high quality Echo PIV measurements. Texture is a fundamental feature for image analysis, classification and segmentation, and it has been widely applied in images ranging from multispectral remote-sensed aerial and satellite images to biomedical images. In medical image analysis, texture has successfully been applied to digital x-ray images (Chappard et al. 2001; McNitt-Gray et al. 1995), ultrasound images (Lefebvre et al. 2000; Sivaramakrishna et al. 2002; Tsui et al. 2010; Zhong et al. 2006), magnetic resonance images (de Alejo et al. 2003; Harrison et al. 2008; Herlidou et al. 1999; James et al. 2001; Kovalev et al. 2001) and computer tomography images (Al-Kadi et al. 2008; Chabat et al. 2003; Wang et al. 2002).
This article describes a texture-based method to identify the optimum microbubble concentration for Echo PIV imaging. First, the first-order statistics, the gray level co-occurrence matrix (GLCM) and K-nearest neighbor (KNN) classifier are described. Second, we describe the acquisition of B-mode images of both in vitro rotational and pulsatile flow and in vivo mouse common carotid arterial flow seeded with UCAs at a series of concentrations (in vitro: 1 × 10² to 1 × 10⁴ bubbles/mL; in vivo: 1 × 10⁴ to 1 × 10⁶ bubbles/mL). Then follows a description of the texture features extracted by the texture-based method and velocity profiles obtained using Echo PIV. Finally, we discuss the effects of the ultrasound system settings and characteristics as well as the selection of parameters in calculation GLCM on the texture features.
METHODS
For identifying the optimum concentration of UCAs, texture features such as the standard deviation, contrast, energy and homogeneity of the Echo PIV images are extracted from the first-order statistics and GLCM and KNN classifier is used to classify the B-mode images of flows seeded with contrast agents.
First-order statistics
The first-order statistics, also known as gray level histogram, has been proven to produce significant results in the analysis of images (Bader et al. 2002; Christodoulou et al. 2003; Zhong et al. 2006). The gray level histogram consists of the sum of frequencies of each gray level. It allows calculation of mean, median and standard deviation of gray level as well as the skewness and kurtosis. Kodym et al. 1992 have emphasized the importance of gray level histogram, especially mean and standard deviation of gray level. Standard deviation is associated with the average gray level difference between pixels and their mean and it is used as one of the texture features to identify optimum UCAs concentration for Echo PIV.
Gray level co-occurrence matrix
The GLCM is a bi-dimensional histogram L × L of elements P(i,j), defined as the number of pixel-pairs (i,j) occurrence for which a gray level i is spaced out of a gray level j by a distance d and along a direction φ (Haralick et al. 1973). The GLCM P can be expressed over an M × N image, as:
| (1) |
Before calculating the texture features, the GLCM P is normalized by the sum of the elements in GLCM.
Three texture features, contrast, energy and homogeneity, are extracted from the GLCM.
| (2) |
Contrast as a measure of the amount of local variations in an image increases as local variation of gray values increase. Energy measures textural uniformity. Larger energy values occur when the gray level distribution over the image has either a constant or a periodic form (Shokr 1991). Homogeneity measures image homogeneity. It assumes larger values for smaller gray level differences in pair elements. Contrast, energy and homogeneity of GLCM are used as three other texture features to identify optimum microbubble concentration for Echo PIV.
The statistical K-nearest neighbor (KNN) classifier
The KNN classifier, which is computationally much faster than other classifiers (Christodoulou et al. 2003), is used for the classification of the UCAs concentration for Echo PIV. The KNN classifier is a method for classifying the new input samples based on closest training samples in the feature space. A new input sample is classified by choosing the majority class among the K closest samples in the training data based on a measure that is usually the Euclidean distance. The closest samples are taken from the training data for which the correct classification is known. The general calculation procedure of the KNN classifier has been described by Goldstein 1972.
MATERIALS AND EXPERIMENTAL METHODS
Echo PIV flow tracers and contrast agents
Flow tracers applicable for Echo PIV should have three basic requirements: first, the tracers should be small enough to transverse the capillaries without causing blockage; second, the velocity of the fluid is assumed to determine the motion of tracers, thus, its density should match the density of fluid well so as to faithfully follow the fluid; and third, the tracers should be visible in the acoustically illuminated field and their locations can be recorded with time. Based on the above-mentioned practical considerations, usually ultrasound contrast microbubbles are used as flow tracers. The change in density at the surface of a microbubble represents a major impedance mismatch and, thus, the echogenicity can be enhanced by the use of microbubbles to improve Echo PIV studies.
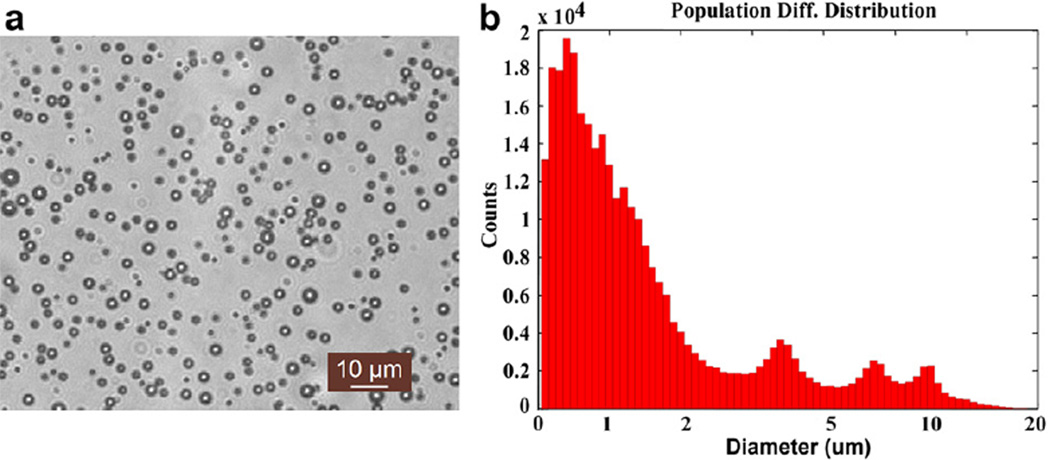
The microbubbles were fabricated and suspended in deionised water in house using the mechanical agitation method. The morphology of microbubbles was observed by an inverted fluorescence microscope (Leica DMI 3000B; Leica Microsystems, Wetzlar, Germany). As shown in Figure 1a, the microbubble had a hollow inner structure, which was similar to the available UCAs in clinic use. Quantification of microbubbles concentration using an AccuSizer (780A; Particle Sizing Systems, Santa Barbara, CA, USA) indicated 9.4 × 10⁸ microbubbles formed per milliliter of solution. A major peak was observed in the diameter distribution of microbubbles at 0.67 µm with mean and median of 1.90 µm and 0.93 µm, respectively (Fig. 1b). At low acoustic power (mechanical index < 0.1), the microbubbles were stable enough to last for about 20 min in vitro and 12 min in vivo and were eventually destroyed by dissolution of the gas core and exposure to ultrasound.
Fig. 1.
(a) The morphology of microbubbles was observed by a Leica DMI 3000B (Leica Microsystems, Wetzlar, Germany) inverted fluorescence microscope (amplified × 400); and (b) size distribution of microbubbles was measured by AccuSizer 780A (Particle Sizing Systems, Santa Barbara, CA, USA).
In vitro rotational and pulsatile flow imaging
The Echo PIV technique appears an effective means of characterizing the complex hemodynamics in the cardiovascular system. Many prior studies have utilized in vitro studies to optimize the method (Liu et al. 2008; Zheng et al. 2006). Therefore, it is significant to obtain the optimum UCAs concentration in vitro experiment. In this study, rotational and pulsatile flows are used to identify optimum UCAs concentration for the in vitro experiment because rotational flow is an interesting approach in terms of establishing a predictable flow pattern and pulsatile flow more closely simulates in vivo blood flow conditions.
The in vitro experiments were performed on an ultrasound system (Sonix RP; Ultrasonix Medical Corporation, Richmond, BC, Canada) using a linear array transducer (L14–5W/60). The manufacturers stated transmitted frequency was 10.0 MHz. The axial and lateral resolution was measured by pulse-echo technique based on phantom and found to be 135 µm and 500 µm, respectively. The system gain was 52% and the dynamic range was 80 dB.
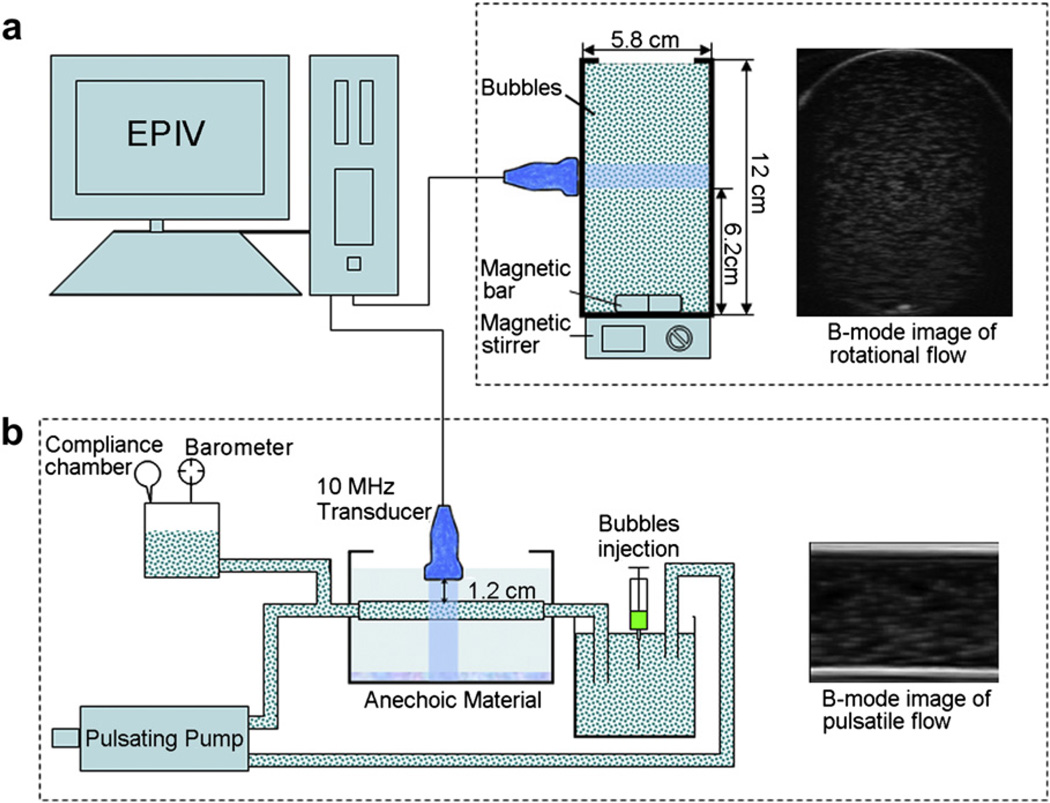
A magnetic stirring device with a rate of rotation of 125 rpm was used to create rotational flow inside a thin cylindrical polyethylene beaker (volume: 250 mL; diameter: 58 mm; height: 12 cm; thickness: 0.96 mm). The insonation plane was at the height of 6.2 cm and the standoff distance between the transducer and the beaker was about 2.6 cm as shown in Figure 2a. B-mode images were obtained at a frame rate of 63 Hz using 128 ultrasound beams with focal depth of 55 mm (in line with the centre of rotation) and field of view (FOV) of 90 mm (depth) by 46 mm (width). Pulsatile flow, which simulates the ventricular action of the heart, was generated by Harvard Apparatus® pulsatile pump (Model 55-3305; Harvard Apparatus, Holliston, MA, USA) in a thermoplastic tube (diameter: 10 mm; wall thickness: 1 mm). The pulse cycle was 2.0 s (30 beats/min) with peak and mean flow rates of 1.32 L/min and 0.45 L/min. The transducer was placed perpendicular to the flow direction as shown in Figure 2b. B-mode images were acquired at a frame rate of 168 Hz using 128 ultrasound beams with focal depth of 17 mm and FOV of 30 mm (depth) by 30 mm (width). The in vitro experiments were performed at nine different concentrations, from 1 × 10² to 1 × 10⁴ bubbles/mL. At each concentration, 10 frames of B-mode images were recorded. Four experiments of each concentration were made to obtain the mean value under the same settings and characteristics of the system.
Fig. 2.
The experimental set-up that was used to identify the optimum concentration of ultrasound contrast agents (UCAs) for ultrasonic particle image velocimetry (Echo PIV) imaging in vitro experiment: (a) rotational flow model and the B-mode image of the whole rotational flow field acquired at the insonation plane (height: 6.2 cm); and (b) pulsatile flow in a tube model and the B-mode image acquired at the insonation plane.
In vivo mouse common carotid arterial flow imaging
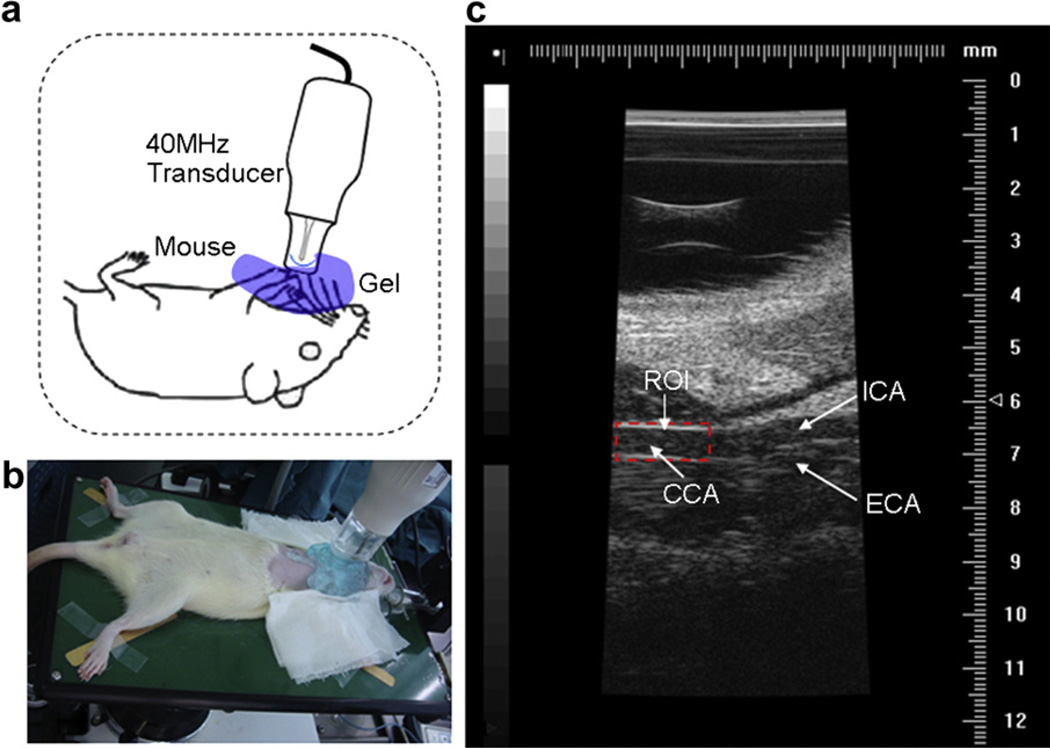
The in vivo animal studies were performed on a Vevo 770 high-frequency ultrasound imaging system (VisualSonics Inc., Toronto, Ontario, Canada). This experimental protocol was approved by the institutional animal care and use committee of our institution. Eight mice were under research and randomly divided into two groups. The mean body weight for each group of mice was 40 g and 38.4 g with standard deviations of 6.4 g and 4.5 g, respectively. The total blood volume was assumed to be 8% of body weight. Each group of mice was injected UCAs with five different concentrations via caudal vein as shown in Table 1. Each concentration was repeated four times to obtain more accurate results. Mice were anesthetized with isoflurane gas at a dose of 1% in pure oxygen at a flow rate of 1 L/min and laid on a platform in the supine position with all legs taped to electrocardiographic electrodes for heart rate monitoring (approximately 380 beats per min). Body temperature was monitored and maintained at 36~38°C by a heating platform. The neck hair of each mouse was gently removed with a depilatory cream and pre-warmed ultrasound gel was used as an acoustic coupling medium. Figure 3a shows a schematic representation of a mouse positioned with the neck facing the ultrasound transducer poised for imaging. The mouse common carotid arterial flow imaging were performed on the Vevo 770 system (VisualSonics Inc.) using a single-element crystal mechanical transducer (RMV-704; VisualSonics Inc., Toronto, Ontario, Canada) as shown in Figure 3b. The manufacturer’s stated transmitted frequency was 40.0 MHz. B-mode images were obtained at a frame rate of 80 Hz with focal depth of 6 mm and FOV of 10 mm (depth) by 5 mm (width) as shown in Figure 3c. The manufacturers stated that the axial and lateral resolution for this configuration is 40 µm and 80 µm, respectively. The optimization of the system gain and the time gain compensation setting were kept constant throughout the whole experiment. Each mouse was allowed to fully regain consciousness between each experiment and UCAs were injected into the mouse and imaged after the former UCAs were completely destroyed to make sure that each experiment was independent. Time between repeated experiments in the same mouse was about an hour.
Table 1.
Microbubble concentrations injected into the two groups of four mice
| Group 1 concentration (bubbles/mL) |
Group 2 concentration (bubbles/mL) |
|---|---|
| 1 × 10⁴ | 2 × 10⁴ |
| 5 × 10⁴ | 8 × 10⁴ |
| 1 × 10⁵ | 2 × 10⁵ |
| 5 × 10⁵ | 8 × 10⁵ |
| 1 × 10⁶ | 2 × 10⁶ |
Fig. 3.
The experimental set-up that was used to identify the optimum concentration of ultrasound contrast agents (UCAs) for ultrasonic particle image velocimetry (Echo PIV) imaging in vivo mouse common carotid artery (CCA): (a) a schematic representation of a mouse positioned with the neck facing the 40MHz (RMV-704; VisualSonics Inc., Toronto, Ontario, Canada) ultrasound transducer poised for imaging; (b) the anesthetized mouse was imaged by the ultrasound transducer; and (c) the B-mode image acquired at the insonation plane (the dotted line box marks the region-of-interest [ROI]).
RESULTS
In vitro rotational flow and pulsatile flow imaging
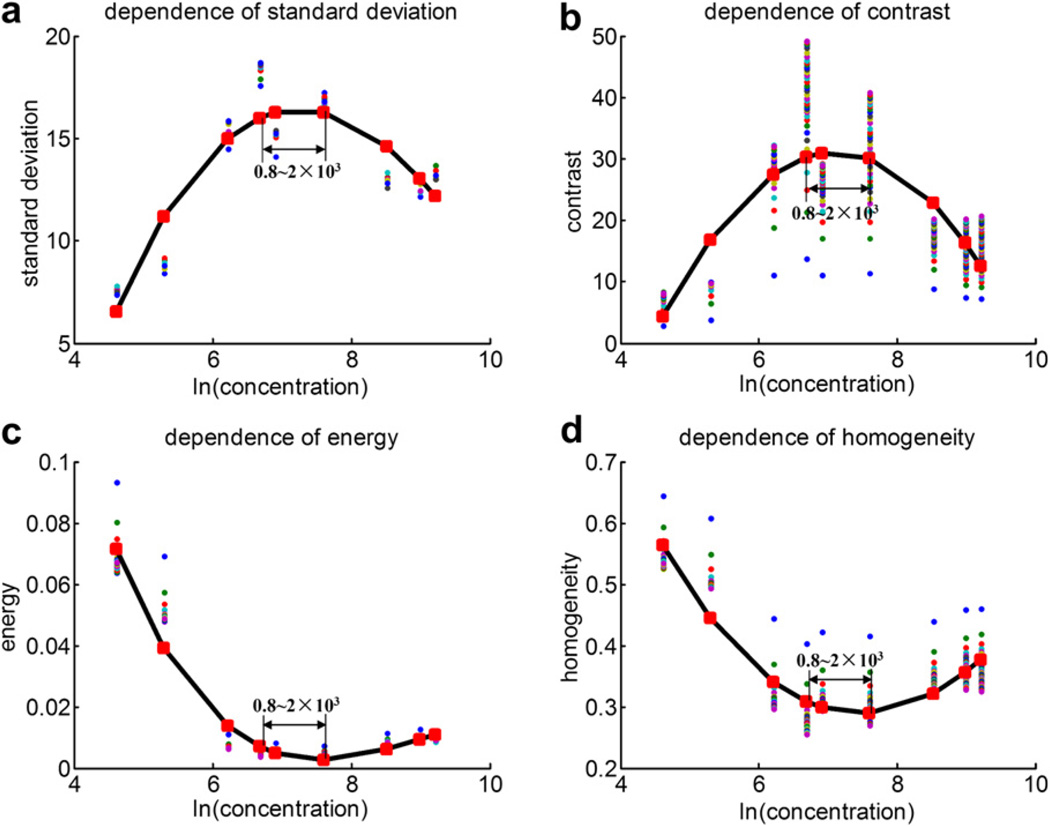
Figure 4 shows the scatter-plot of the texture features (standard deviation of gray level, and contrast, energy and homogeneity of GLCM) vs. the natural logarithm of the microbubble concentration, as well as the respective quadratic polynomial fitting curves, for the rotational flow described above. When plotted against concentration, each texture feature has a peak value or trough value corresponding to the same concentration (0.8~2 × 10³ bubbles/mL). The B-mode images of UCAs concentration around 0.8~2 × 10³ bubbles/mL have large standard deviation of gray level, high contrast, low energy and low homogeneity.
Fig. 4.
The scatter-plot of (a) the standard deviation of gray level, (b) contrast, (c) energy and (d) homogeneity vs. the natural logarithm of the microbubble concentration and the respective quadratic polynomial fitting curves in vitro rotational flow imaging.
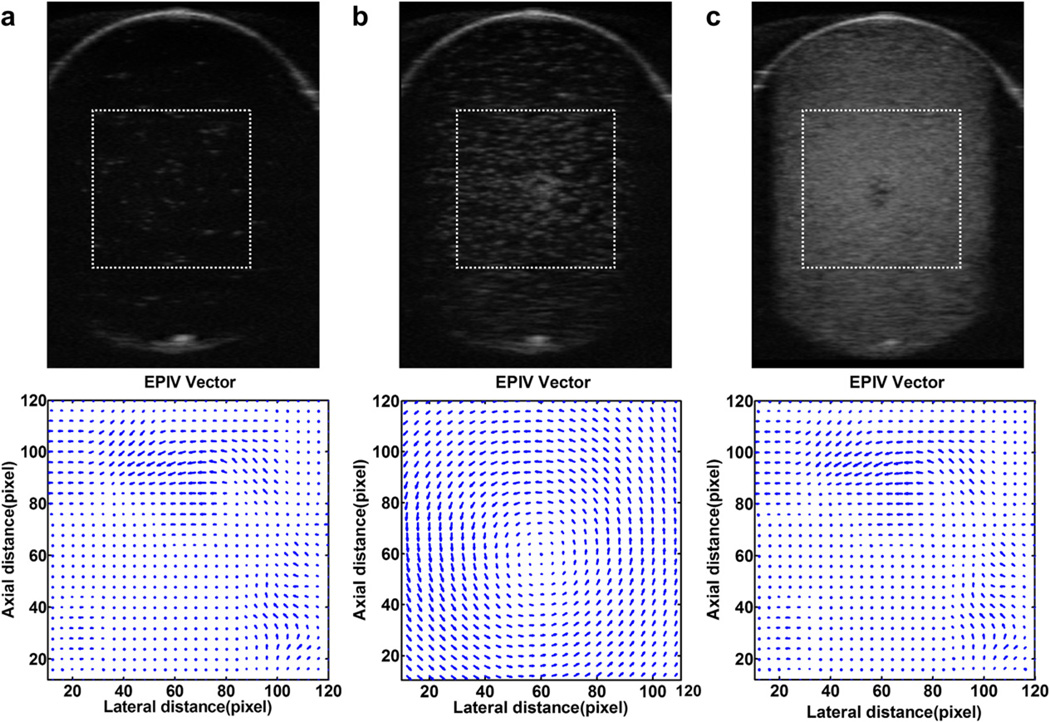
Evaluation of the optimum UCAs concentration for Echo PIV should be validated by agreeable velocity vector quality derived. Figure 5 shows B-mode images of the whole rotational flow field acquired at the insonation plane and Echo PIV velocity vectors near the center of rotation with different UCA concentrations. The B-mode image in Figure 5a was obtained with UCAs concentration of 0.2 × 10³ bubbles/mL. Two sequential B-mode images were subjected to Echo PIV analysis and the quality of resulting velocity vectors were poor. When UCAs concentration was increased to 0.8 × 10³ bubbles/mL, the velocity vectors produced by Echo PIV had good quality as shown in Figure 5b. Lastly, the UCAs concentration was further increased to 5 × 10³ bubbles/mL and the quality of resulting velocity vectors were poor (Fig. 5c). Similarly, the processing was done for B-mode images acquired at other UCA concentrations. The results of experiments indicated that the B-mode images acquired with the concentration of UCAs around the peak value or trough value (0.8~2 × 10³ bubbles/mL) can obtain accurate velocity profiles.
Fig. 5.
B-mode images of the whole rotational flow field acquired at the insonation plane and ultrasonic particle image velocimetry (Echo PIV) velocity profiles near the center of rotation (dotted-line boxes) for microbubble concentration of (a) 0.2 × 10³ bubbles/mL; (b) 0.8 × 10³ bubbles/mL; and (c) 5 × 10³ bubbles/mL.
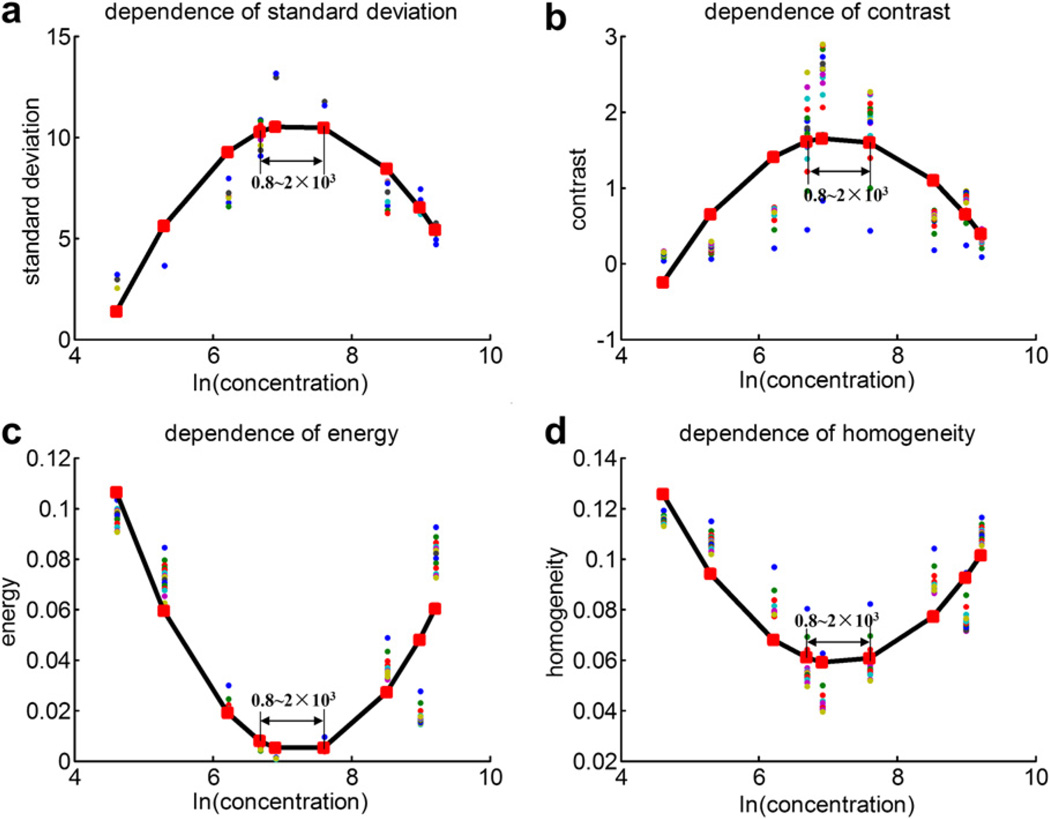
Figure 6 shows the scatter-plot of the texture features versus the natural logarithm of the microbubble concentration, as well as the respective quadratic polynomial fitting curves in vitro pulsatile flow imaging. When plotted against concentration, each texture feature has a peak value or trough value corresponding to the same concentration (0.8~2 × 10³ bubbles/mL). The B-mode images of UCAs concentration around 0.8~2 × 10³ bubbles/mL have large standard deviation of gray level, high contrast, low energy and low homogeneity.
Fig. 6.
The scatter-plot of (a) the standard deviation of gray level, (b) contrast, (c) energy and (d) homogeneity vs. the natural logarithm of the microbubble concentration and the respective quadratic polynomial fitting curves in vitro pulsatile flow imaging.
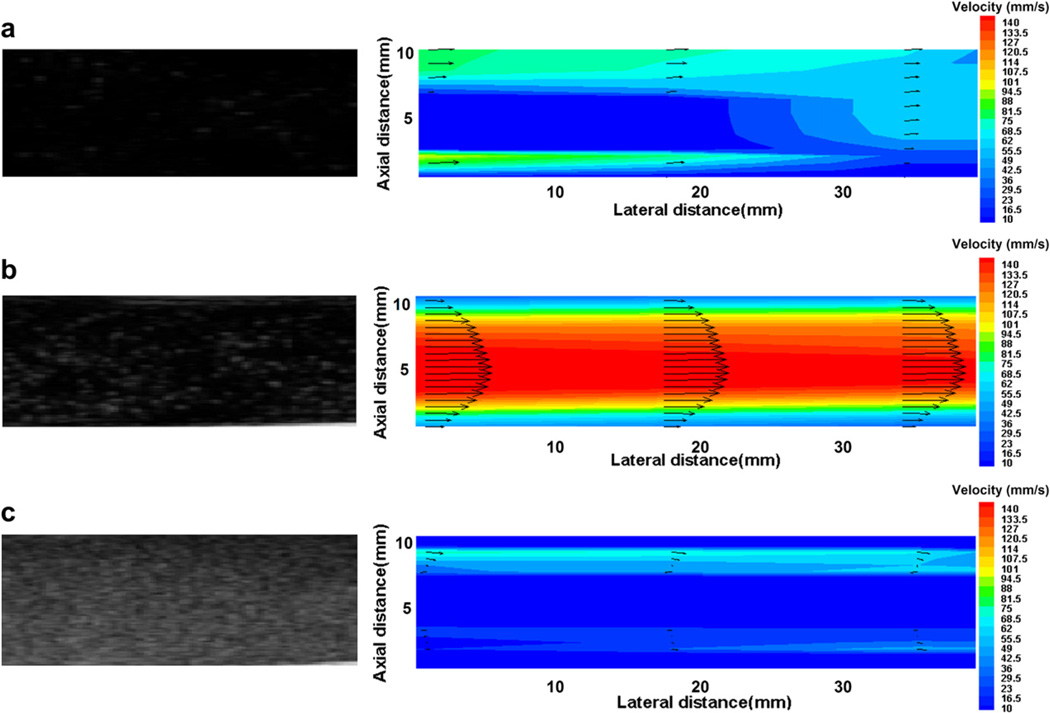
Figure 7 shows B-mode images of pulsatile flow seeded with various UCA concentrations and the corresponding velocity profiles obtained by high-speed Echo PIV technique in real time. The lumen diameter and the peak flow velocities during systole are about 10 mm and 140 mm/s, respectively. The Reynolds number is about 1400, thus, the flow during systole may be regarded as a laminar flow. Both low UCAs concentration of 0.2 × 10³ bubbles/mL (Fig. 7a) and high UCAs concentration of 5 × 10³ bubbles/mL (Fig. 7c) yielded incorrect results, while the B-mode images corresponding to the concentration of 0.8 × 10³ bubbles/mL obtained accurate velocity profiles as shown in Figure 7b. Similarly, the Echo PIV technique was used to analyse B-mode images acquired at other UCA concentrations. The results demonstrated that the B-mode images corresponding to the concentration around the peak value or trough value (0.8~2 × 10³ bubbles/mL) obtained high quality velocity profiles. Therefore, we can conclude that the optimum UCAs concentration for in vitro experimental conditions is around 0.8~2 × 10³ bubbles/mL.
Fig. 7.
B-mode images and ultrasonic particle image velocimetry (Echo PIV) velocity profiles for microbubble concentration of (a) 0.2 × 10³ bubbles/mL; (b) 0.8 × 10³ bubbles/mL; and (c) 5 × 10³ bubbles/mL in vitro pulsatile flow imaging.
The KNN classifier was evaluated using texture features as a feature set and nine various concentration images were selected at random for training and 22 various concentration images for evaluation. The accuracy of classification can reach 86.4%. The in vitro experiment showed that the accuracy and feasibility for the texture-based method were very good and truly useful for in vivo study.
In vivo mouse common carotid arterial flow imaging
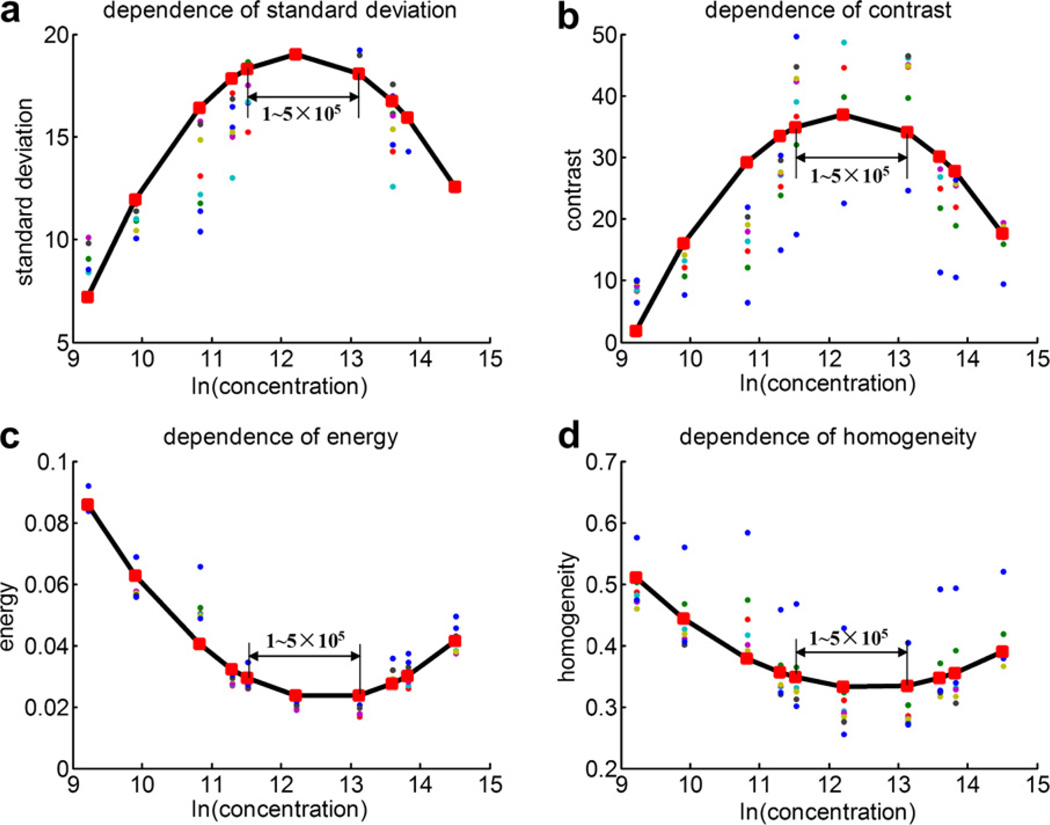
Figure 8 shows the scatter-plot of the standard deviation of gray level, contrast, energy and homogeneity vs. the natural logarithm of the UCAs concentration, as well as the respective quadratic polynomial fitting curves for in vivo mouse common carotid arterial flow. When plotted against concentration, each texture feature has a peak value or trough value corresponding to the same concentration (1~5 × 10⁵ bubbles/mL). The B-mode images of the concentration around 1~5 × 10⁵ bubbles/mL have large standard deviation of gray level, high contrast, low energy and low homogeneity.
Fig. 8.
The scatter-plot of (a) the standard deviation of gray level, (b) contrast, (c) energy and (d) homogeneity vs. the natural logarithm of the microbubble concentration, and the respective quadratic polynomial fitting curves in vivo mouse common carotid arterial flow imaging.
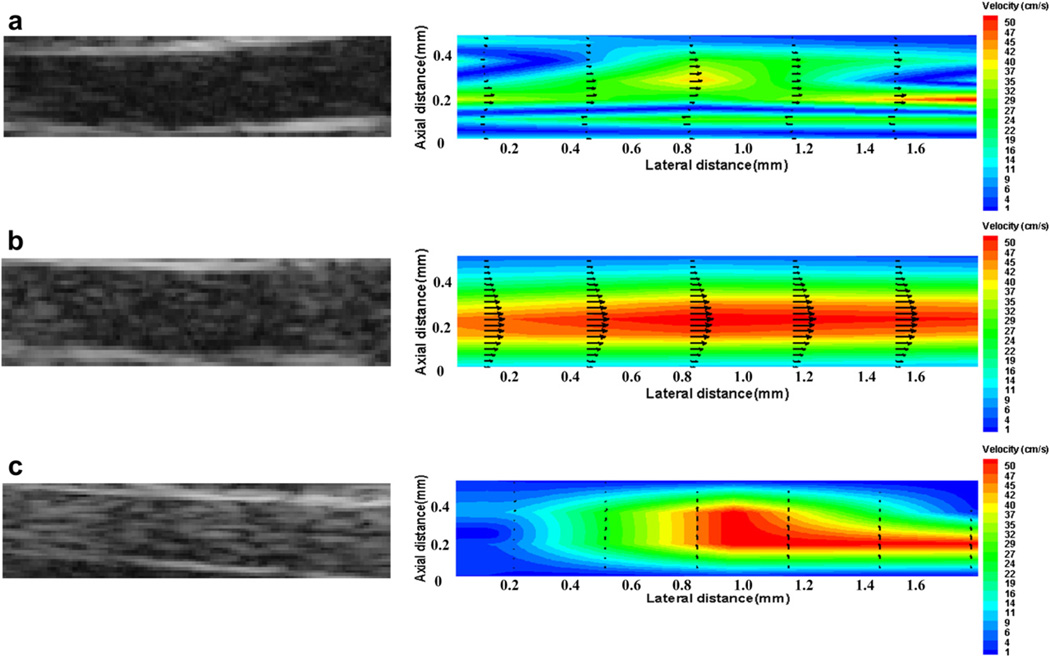
Figure 9 shows B-mode images of mouse common carotid arterial flow seeded with different UCA concentrations and the corresponding velocity profiles obtained by the Echo PIV technique. The lumen diameter and the peak flow velocities during systole is about 0.49 mm and 50 cm/s, respectively. The Reynolds number is only 70, thus, the mouse common carotid arterial flow can be considered as a laminar flow. Incorrect results at high UCAs concentration of 2 × 10⁶ bubbles/mL (Fig. 9c) were mainly because of overlapping particle images, while the increased errors with low UCAs concentration of 2 × 10⁴ bubbles/mL (Fig. 9a) indicated the loss of matching particle pairs. The B-mode images corresponding to the concentration of 2 × 10⁵ bubbles/mL around the peak value or trough value obtained accurate velocity profiles as shown in Figure 9b. Similarly, the Echo PIV technique was used to analyse B-mode images obtained at other UCA concentrations. The results showed that the B-mode images corresponding to the concentration around the peak value or trough value (1~5 × 10⁵ bubbles/mL) obtained accurate velocity profiles. Consequently, we concluded that the optimum UCAs concentration for in vivo experiment is around 1~5 × 10⁵ bubbles/mL.
Fig. 9.
B-mode images and ultrasonic particle image velocimetry (Echo PIV) velocity profiles for microbubble concentration of (a) 2 × 10⁴ bubbles/mL; (b) 2 × 10⁵ bubbles/mL; and (c) 2 × 10⁶ bubbles/mL in vivo mouse common carotid arterial flow imaging.
The KNN classifier was evaluated using texture features as a feature set and 10 different concentration images were selected at random for training and 40 various concentration images for evaluation. The accuracy of the KNN classifier can reach 87.5%.
DISCUSSION
In this article, the texture features, standard deviation, contrast, energy and homogeneity, were used to identify the optimum concentration of UCAs for Echo PIV imaging. B-mode images acquired by the optimum UCAs concentration have large local variation of gray level and dominant gray level transitions and, hence, have large standard deviation of gray level, high contrast, low energy and low homogeneity. The experimental results show that high accuracy velocity vectors can be obtained at concentration of 0.8~2 × 10³ bubbles/mL in vitro and 1~5 × 10⁵ bubbles/mL in vivo. The result of in vitro experiment is consistent with earlier reports (Kim et al. 2004b; Liu et al. 2008). The reason for the difference between in vitro and in vivo studies is that the scattering to attenuation ratio, for quantification of the effectiveness of the UCAs, decreases as the frequency increases (Bouakaz et al. 1998) and the resonant frequency of phospholipid-coated microbubbles is less than 10 MHz as estimated by Sun et al. 2005.
Theoretical and experimental analysis show that the texture-based method is computationally inexpensive and could be easily realized together with the real time Echo PIV imaging and, hence, can effectively identify the optimum concentration of UCAs in Echo PIV imaging. However, the major limitation of the texture-based method is the dependence of the calculation of GLCM on different settings and characteristics of the ultrasound system as well as the selection of analysis parameters.
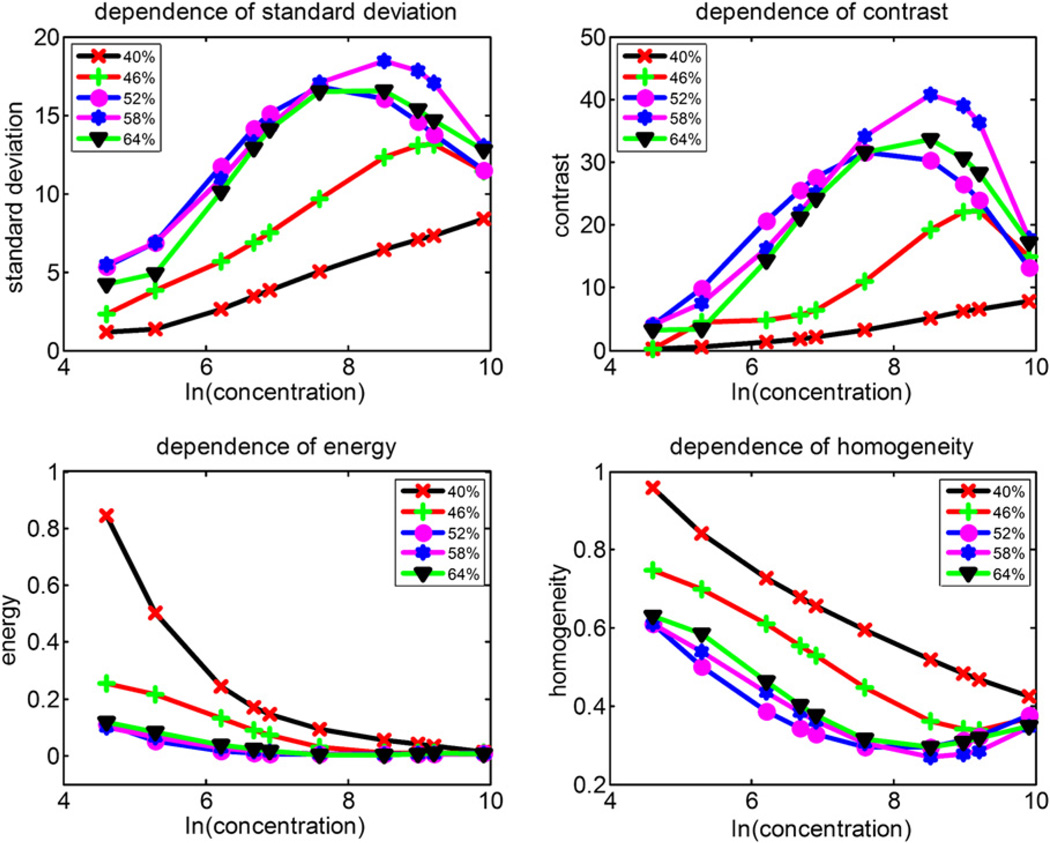
Brightness and contrast of the B-mode image strongly depend on the system gain, time gain compensation (TGC) and dynamic range (Lefebvre et al. 2000). For the same phantom examined, the B-mode images recorded by different ultrasound systems at different settings may be different. Performance of the texture-based method was tested by B-mode images of in vitro rotational flow at different system settings. B-mode images at 10 different UCA concentrations were recorded at different system settings using the experimental set-up shown in Figure 2a. Figure 10 shows texture features of various UCA concentrations under different system gains (40%, 46%, 52%, 58% and 64%) when the dynamic range was 80 dB. The variations of the system gain yield a significant difference for each texture feature (p < 0.01 for all comparisons, by student’s t-test). Moreover, the texture features do not show a linear variation. TGC and dynamic range changes produced similar effects to those produced by the adjustment of the system gain. Thus, the settings of the ultrasound system were initially optimized and maintained throughout each experiment. Meanwhile, to decrease speckle variance, both the ultrasound transducer and phantom were fixed and remained at the same position throughout the study.
Fig. 10.
Texture features of various concentrations of ultrasound contrast agents (UCAs) under different system gains (40%, 46%, 52%, 58% and 64%) when the dynamic range was 80 dB using Sonix RP system (Ultrasonix Medical Corporation, Richmond, BC, Canada) obtained rotational flow B-mode images.
From the definition of the GLCM, the gray level L, the window size M×N, the displacement d and the orientation φ determine the matrix that determines the values of contrast, energy and homogeneity. Thus, identification of the concentration of UCAs for Echo PIV using GLCM is valid only if proper parameters are selected.
Experiment data obtained for in vitro rotational flow imaging were used to investigate the effect of gray level on the texture features that affect the classification accuracy of KNN. With higher gray level L, it is expected that more information would be provided and improved classification accuracy would be achieved for each texture feature. Similarly, it is expected that a lower L would have less information and poorer classification accuracy. However, this is not always the case. For L approximately greater than 48 gray level, the classification accuracy of KNN were quite consistent with minimal variability for each texture feature (contrast, energy and homogeneity). Thus, above a certain threshold, classification using contrast, energy and homogeneity is independent of the gray level L. The threshold value of L=48 is smaller than the L=64 suggested by Soh et al. 1999 and larger than L=24 indicated by Clausi 2002; however, they agree that large L values (L = 128 or 256) are unnecessary. Thus, L=64 was used in this study.
The size of the image window is important in the computation of GLCM. If the image is too big, it may consume too much computational time. Whereas, if it is too small, it may not sufficiently extract the texture feature. Lv et al. 2009 suggested that contrast, energy and homogeneity change less when an image window was over 75 pixels. Therefore, a window size of 100 × 100 was used.
The displacement d is a key parameter for accurate feature extraction. In this work, the experiment data obtained in vitro rotational flow imaging were also used to investigate the effect of displacement on the texture features that affect the classification accuracy of KNN. The displacement d produced much more dramatic fluctuations relative to the gray level L. As pionted out by Chen et al. 1989, single-displacement features might not be sufficient to represent textures. Thus, a variety of distances from one to 40 in vitro and from one to 20 in vivo were used.
The orientation φ is relatively less important compared with other parameters in GLCM. Some authors used the average and range (Conners et al. 1984), some used certain series of orientations (Nystuen et al. 1992). Because the texture orientation of B-mode images was random in practice, the four orientations (φ=0°; 45°; 90°; 135°) were averaged out in this study.
CONCLUSION
The texture features (standard deviation of gray level, and contrast, energy and homogeneity of GLCM), derived from the first-order statistics and GLCM, were extracted from B-mode images of in vitro rotational flow and pulsatile flow as well as in vivo mouse common carotid arterial flow. Combined with the texture features vs. the microbubble concentration curves and the velocity profiles obtained by Echo PIV technique, it was found that the optimum concentration of UCAs used for Echo PIV imaging was 0.8~2 × 10³ bubbles/mL in vitro and 1~5 × 10⁵ bubbles/mL in vivo. When texture features were used as a feature set, the accuracy of KNN classifier can reach 86.4% in vitro and 87.5% in vivo, respectively. The texture-based method is found to be a useful tool for identifying the optimum concentration of flow tracering microbubbles and improving its measurement accuracy in real time Echo PIV imaging.
Acknowledgments
The work was supported by National Basic Research Program 973 (Grant Nos. 2010CB732605, 2010CB534914, 2010CB732604 and 2011CB707903) from Ministry of Science and Technology, China, National Science Foundation Grants (Grant Nos. 81027006, 61020106008, 10904094, 11002152, 10904095 and 61002001).
REFERENCES
- Al-Kadi OS, Watson D. Texture analysis of aggressive and nonaggressive lung tumor CE CT images. IEEE Trans Biomed Eng. 2008;55:1822–1830. doi: 10.1109/TBME.2008.919735. [DOI] [PubMed] [Google Scholar]
- Bader W, Bohmer S, Van Leeuwen P, Hackmann J, Westhof G, Hatzmann W. Does texture analysis improve breast ultrasound precision? Ultrasound Obst Gyn. 2002;15:311–316. doi: 10.1046/j.1469-0705.2000.00046.x. [DOI] [PubMed] [Google Scholar]
- Bouakaz A, De Jong N, Cachard C. Standard properties of ultrasound contrast agents. Ultrasound Med Biol. 1998;24:469–472. doi: 10.1016/s0301-5629(97)00290-1. [DOI] [PubMed] [Google Scholar]
- Chabat F, Yang GZ, Hansell DM. Obstructive lung diseases: Texture classification for differentiation at CT. Radiology. 2003;228:871–877. doi: 10.1148/radiol.2283020505. [DOI] [PubMed] [Google Scholar]
- Chappard D, Chennebault A, Moreau M, Legrand E, Audran M, Basle MF. Texture analysis of X-ray radiographs is a more reliable descriptor of bone loss than mineral content in a rat model of localized disuse induced by the clostridium botulinum toxin. Bone. 2001;28:72–79. doi: 10.1016/s8756-3282(00)00438-5. [DOI] [PubMed] [Google Scholar]
- Chen DW, Sengupta SK, Welch RM. Cloud field classification based upon high spatial resolution textural features 2. simplified vector approaches. J Geophys Res. 1989;94:14749–14765. [Google Scholar]
- Cheng A, Nguyen TC, Malinowski M, Daughters GT, Miller DC, Ingels NB. Heterogeneity of left ventricular wall thickening mechanisms. Circulation. 2008;118:713–721. doi: 10.1161/CIRCULATIONAHA.107.744623. [DOI] [PMC free article] [PubMed] [Google Scholar]
- Cheng C, Tempel D, van Haperen R, van der Baan A, Grosveld F, Daemen M, Krams R, de Crom R. Atherosclerotic lesion size and vulnerability are determined by patterns of fluid shear stress. Circulation. 2006;113:2744–2753. doi: 10.1161/CIRCULATIONAHA.105.590018. [DOI] [PubMed] [Google Scholar]
- Christodoulou CI, Pattichis CS, Pantziaris M, Nicolaides A. Texture-based classification of atherosclerotic carotid plaques. IEEE Trans Med Imaging. 2003;22:902–912. doi: 10.1109/TMI.2003.815066. [DOI] [PubMed] [Google Scholar]
- Clausi DA. An analysis of co-occurrence texture statistics as a function of grey level quantization. Can J Remote Sensing. 2002;28:45–62. [Google Scholar]
- Conners R, Trivedi M, Harlow C. Segmentation of a high-resolution urban scene using texture operators. Comput Vis Graph Image Process. 1984;25:273–310. [Google Scholar]
- de Alejo RP, Ruiz-Cabello J, Cortijo M, Rodriguez I, Echave I, Regadera J, Arrazola J, Aviles P, Barreiro P, Gargallo D, Grana M. Computer-assisted enhanced volumetric segmentation magnetic resonance imaging data using a mixture of artificial neural networks. Magn Reson Imaging. 2003;21:901–912. doi: 10.1016/s0730-725x(03)00193-0. [DOI] [PubMed] [Google Scholar]
- Goldstein M. kn-nearest neighbor classification. IEEE Trans Inform Theory. 1972;18:627–630. [Google Scholar]
- Haralick RM, Shanmugam K, Dinstein I. Textural features for image classification. IEEE Trans Syst Man Cybemet. 1973;3:610–621. [Google Scholar]
- Harrison L, Dastidar P, Eskola H, Jarvenpaa R, Pertovaara H, Luukkaala T, Kellokumpu-Lehtinen PL, Soimakallio S. Texture analysis on MRI images of non-Hodgkin lymphoma. Comput Biol Med. 2008;38:519–524. doi: 10.1016/j.compbiomed.2008.01.016. [DOI] [PubMed] [Google Scholar]
- Herlidou S, Rolland Y, Bansard JY, Le Rumeur E, De Certaines JD. Comparison of automated and visual texture analysis in MRI: Characterization of normal and diseased skeletal muscle. Magn Reson Imaging. 1999;17:1393–1397. doi: 10.1016/s0730-725x(99)00066-1. [DOI] [PubMed] [Google Scholar]
- James D, Clymer BD, Schmalbrock P. Texture detection of simulated microcalcification susceptibility effects in magnetic resonance imaging of breasts. J Magn Reson Imaging. 2001;13:876–881. doi: 10.1002/jmri.1125. [DOI] [PubMed] [Google Scholar]
- Jiang YN, Kohara K, Hiwada K. Association between risk factors for atherosclerosis and mechanical forces in carotid artery. Stroke. 2000;31:2319–2324. doi: 10.1161/01.str.31.10.2319. [DOI] [PubMed] [Google Scholar]
- Kim HB, Hertzberg JR, Lanning C, Shandas R. Noninvasive measurement of steady and pulsating velocity profiles and shear rates in arteries using echo PIV: In vitro validation studies. Ann Biomed Eng. 2004a;32:1067–1076. doi: 10.1114/b:abme.0000036643.45452.6d. [DOI] [PubMed] [Google Scholar]
- Kim HB, Hertzberg JR, Shandas R. Development and validation of echo PIV. Exp Fluids. 2004b;36:455–462. [Google Scholar]
- Kodym R, Seyss R. Darstellung der texturparameter von B-Mode-Sonogrammen in bildmassiger form. Ultraschall Med. 1992;13:116–118. doi: 10.1055/s-2007-1005291. [DOI] [PubMed] [Google Scholar]
- Kovalev VA, Kruggel F, Gertz HJ, Von Cramon DY. Three-dimensional texture analysis of MRI brain datasets. IEEE Trans Med Imaging. 2001;20:424–433. doi: 10.1109/42.925295. [DOI] [PubMed] [Google Scholar]
- Lefebvre F, Meunier M, Thibault F, Laugier P, Berger G. Computerized ultrasound B-scan characterization of breast nodules. Ultrasound Med Biol. 2000;26:1421–1428. doi: 10.1016/s0301-5629(00)00302-1. [DOI] [PubMed] [Google Scholar]
- Liu LL, Zheng HR, Williams L, Zhang FX, Wang R, Hertzberg JR, Shandas R. Development of a custom-designed echo particle image velocimetry system for multi-component hemodynamic measurements: System characterization and initial experimental results. Phys Med Biol. 2008;53:1397–1412. doi: 10.1088/0031-9155/53/5/015. [DOI] [PubMed] [Google Scholar]
- Lv XW, Bai CG, Qiu GB, Zhang SF, Hu ML. Relationship between texture features and mineralogy phases in iron ore sinter based on gray-level co-occurrence matrix. ISIJ Int. 2009;49:709–718. [Google Scholar]
- McNitt-Gray MF, Huang HK, Sayre JW. Feature selection in the pattern classification problem of digital chest radiograph segmentation. IEEE Trans Med Imaging. 1995;14:537–547. doi: 10.1109/42.414619. [DOI] [PubMed] [Google Scholar]
- Niu LL, Qian M, Wan K, Yu WT, Jin QF, Ling T, Gao S, Zheng HR. Ultrasonic particle image velocimetry for improved flow gradient imaging: Algorithms, methodology and validation. Phys Med Biol. 2010;55:2103–2120. doi: 10.1088/0031-9155/55/7/020. [DOI] [PubMed] [Google Scholar]
- Nystuen JA, Garcia FW. Sea ice classification using SAR backscatter statistics. IEEE Trans Geosci Remote Sensing. 1992;30:502–509. [Google Scholar]
- Qian M, Niu LL, Wang YP, Jiang B, Jin QF, Jiang CX, Zheng HR. Measurement of flow velocity fields in small vessel-mimic phantoms and vessels of small animals using micro ultrasonic particle image velocimetry (micro-EPIV) Phys Med Biol. 2010;55:6069–6088. doi: 10.1088/0031-9155/55/20/003. [DOI] [PubMed] [Google Scholar]
- Shokr ME. Evaluation of second-order texture parameters for sea ice classification from radar images. J Geophys Res. 1991;96:10625–10640. [Google Scholar]
- Sivaramakrishna R, Powell KA, Lieber ML, Chilcote WA, Shekhar R. Texture analysis of lesions in breast ultrasound images. Comput Med Imaging Graph. 2002;26:303–307. doi: 10.1016/s0895-6111(02)00027-7. [DOI] [PubMed] [Google Scholar]
- Soh LK, Tsatsoulis C. Texture analysis of SAR sea ice imagery using gray levelco-occurrence matrices. IEEE Trans Geosci Remote Sensing. 1999;37:780–795. [Google Scholar]
- Sun Y, Kruse DE, Dayton PA, Ferrara KW. High-frequency dynamics of ultrasound contrast agents. IEEE Trans Ultrason Ferrelectr Freq Control. 2005;52:1981–1991. doi: 10.1109/tuffc.2005.1561667. [DOI] [PMC free article] [PubMed] [Google Scholar]
- Tsui PH, Liao YY, Chang CC, Kuo WH, Chang KJ, Yeh CK. Classification of benign and malignant breast tumors by 2-D analysis based on contour description and scatterer characterization. IEEE Trans Med Imaging. 2010;29:513–522. doi: 10.1109/TMI.2009.2037147. [DOI] [PubMed] [Google Scholar]
- Tsui PH, Wang SH. The effect of transducer characteristics on the estimation of Nakagami paramater as a function of scatterer concentration. Ultrasound Med Biol. 2004;30:1345–1353. doi: 10.1016/j.ultrasmedbio.2004.08.009. [DOI] [PubMed] [Google Scholar]
- Wang Y, Itoh K, Taniguchi N, Toei H, Kawai F, Nakamura M, Omoto K, Yokota K, Ono T. Studies on tissue characterization by texture analysis with co-occurrence matrix method using ultrasonography and CT imaging. J Med Ultrason. 2002;29:211–223. doi: 10.1007/BF02480852. [DOI] [PubMed] [Google Scholar]
- Zhang FX, Lanning C, Mazzaro L, Barker AJ, Gates PE, Strain WD, Fulford J, Gosling OE, Shore AC, Bellenger NG, Rech B, Chen JS, Chen J, Shandas R. In vitro and preliminary in vivo validation of echo particle image velocimetry in carotid vascular imaging. Ultrasound Med Biol. 2011;37:450–464. doi: 10.1016/j.ultrasmedbio.2010.11.017. [DOI] [PMC free article] [PubMed] [Google Scholar]
- Zheng HR, Liu LL, Williams L, Hertzberg JR, Lanning C, Shandas R. Real time multicomponent echo particle image velocimetry technique for opaque flow imaging. Appl Phys Lett. 2006;88:261915. [Google Scholar]
- Zhong T, Tagare HD, Beaty JD. Evaluation of four probability distribution models for speckle in clinical cardiac ultrasound images. IEEE Trans Med Imaging. 2006;25:1483–1491. doi: 10.1109/TMI.2006.881376. [DOI] [PubMed] [Google Scholar]


