

Abstract
Aims
Exenatide has been demonstrated to improve glycaemic control in patients with type 2 diabetes, with no effect on heart rate corrected QT (QTc) at therapeutic concentrations. This randomized, placebo- and positive-controlled, crossover, thorough QT study evaluated the effects of therapeutic and supratherapeutic exenatide concentrations on QTc.
Methods
Intravenous infusion was employed to achieve steady-state supratherapeutic concentrations in healthy subjects within a reasonable duration (i.e. days). Subjects received exenatide, placebo and moxifloxacin, with ECGs recorded pre-therapy and during treatment. Intravenous exenatide was expected to increase heart rate to a greater extent than subcutaneous twice daily or once weekly formulations. To assure proper heart rate correction, a wide range of baseline heart rates was assessed and prospectively defined methodology was applied to determine the optimal QT correction.
Results
Targeted steady-state plasma exenatide concentrations were exceeded (geometric mean ± SEM 253 ± 8.5 pg ml−1, 399 ± 11.9 pg ml−1 and 627 ± 21.2 pg ml−1). QTcP, a population-based method, was identified as the most appropriate heart rate correction and was prespecified for primary analysis. The upper bound of the two-sided 90% confidence interval for placebo-corrected, baseline-adjusted QTcP (ΔΔQTcP) was <10 ms at all time points and exenatide concentrations. The mean of three measures assessed at the highest steady-state plasma exenatide concentration of ∼500 pg ml−1 (ΔΔQTcPavg) was −1.13 [−2.11, −0.15). No correlation was observed between ΔΔQTcP and exenatide concentration. Assay sensitivity was confirmed with moxifloxacin.
Conclusions
These results demonstrated that exenatide, at supratherapeutic concentrations, does not prolong QTc and provide an example of methodology for QT assessment of drugs with an inherent heart rate effect.
Keywords: cardiac repolarization, exenatide, thorough QT/QTc study
What is Already Known about this Subject
Previous studies have demonstrated that exenatide, at therapeutic concentrations, did not prolong the QTc interval. The optimal approach to determining the QTc effects of drugs that also increase heart rate remains an important scientific question.
What this Study Adds
This study demonstrates that supratherapeutic concentrations of exenatide, administered by intravenous infusion, do not prolong the QTc interval. Importantly, methods for employing specific study procedures and prospectively determining the most appropriate heart rate correction methods for QT assessment of drugs with an inherent heart rate effect are demonstrated and should be widely applicable.
Introduction
Exenatide is a glucagon-like peptide-1 (GLP-1) receptor agonist approved for twice daily and once weekly administration in the treatment of type 2 diabetes. Exenatide has been demonstrated to exert many of the glucoregulatory actions of GLP-1, a naturally occurring incretin hormone, but with a longer duration of effect relative to GLP-1, as exenatide is not substantially degraded by dipeptidyl peptidase-4 [1]. Both exenatide twice daily and exenatide once weekly have been demonstrated to improve glycaemic control in patients with type 2 diabetes, with a favourable safety and tolerability profile [2–6].
Confirming the absence of drug-induced changes in the heart rate corrected QT (QTc) interval on the electrocardiogram (ECG) has become a necessary and important component of drug development [7, 8]. Preclinical studies of exenatide have not demonstrated a signal for QT prolongation, including no effect on the human ether-a-go-go related gene (hERG) potassium current in vitro and no ECG changes or QTc prolongation in primate studies of up to 9 months in duration (Amylin Pharmaceuticals, Inc., data on file). Surveillance of exenatide twice daily post-marketing events (>1.5 million patient-years of exposure) did not find an association between exenatide and QT prolongation or pro-arrhythmic events (Amylin Pharmaceuticals, Inc., data on file). Results from a thorough QT (TQT) study conducted in healthy subjects with a single 10 μg dose of exenatide twice daily and an evaluation of QTc changes in patients with type 2 diabetes following long term (30 week) exenatide once weekly treatment also demonstrated that exenatide had no effect on cardiac repolarization at therapeutic exenatide concentrations [9, 10]. An important limitation of these clinical studies, however, was that only therapeutic exenatide twice daily and exenatide once weekly doses were evaluated, due to tolerability concerns. Treatment with exenatide twice daily or exenatide once weekly has been shown to produce average peak (exenatide twice daily) or steady-state (exenatide once weekly) plasma concentrations ranging from ∼200 to 300 pg ml−1 [2]. Exenatide is primarily cleared by glomerular filtration [11] and plasma exenatide concentrations are typically higher in patients with renal impairment [12, 13]. Therefore it is important to evaluate QT effects at therapeutic and supratherapeutic plasma exenatide concentrations [14].
GLP-1 receptor agonists have been associated with a modest increase in heart rate with chronic dosing in patients with type 2 diabetes [3, 4, 15, 16]. In this TQT study, gradual intravenous (i.v.) exenatide infusion was used to yield sufficiently high plasma exenatide concentrations in healthy volunteers, without intolerable side effects and within a reasonable study duration (i.e. days rather than weeks). In contrast to the marketed exenatide twice daily and exenatide once weekly formulations, i.v. exenatide infusion was associated with a substantial effect on heart rate [9]. (data on file, Amylin Pharmaceuticals, Inc.). As standard QTc methods, such as Fridericia, Bazett and individualized corrections derived from resting ECGs, are frequently inappropriate for QT assessment during significant heart rate increases, a two stage procedure was implemented to determine the most appropriate heart rate correction method prior to QTc analysis [17]. ECGs were recorded from a broad range of heart rates at baseline and prospectively defined criteria were subsequently applied to select the best of five evaluated correction methodologies.
Methods
Study design
This study was a randomized, placebo- and positive-controlled, three period, crossover, TQT study, employing a double-blind continuous i.v. infusion paradigm. Healthy male and non-menstruating or post-menopausal female volunteers, 18 to 65 years of age, with fasting serum glucose <110 mg dl−1 and BMI of 25 to 35 kg m−2 at screening were eligible to participate. Subjects with clinically significant abnormal physical examination or ECG findings, a history of cardiovascular disease or unexplained syncope, abnormal renal function or a personal or family history of sudden death or long QT syndrome were excluded from participation.
Eligible subjects were randomized to one of six treatment sequences following a Williams design [18] and participated in three inpatient ECG assessment periods: i.v. exenatide infusion, i.v. placebo infusion and positive oral moxifloxacin control with i.v. placebo infusion. The i.v. infusion paradigm delivered gradually increasing plasma exenatide concentrations to achieve therapeutic steady-state plasma exenatide concentrations of ∼200 pg ml−1 on day 1 and ∼300 pg ml−1 on day 2 and the supratherapeutic concentration of ∼500 pg ml−1 on day 3 (total of 67 h infusion). Placebo was infused at the same rate as exenatide. A single, 400 mg oral dose of moxifloxacin was administered on the second infusion day during the positive control ECG assessment period. There was a minimum of 5 days washout between periods.
Blood samples for pharmacokinetic assessments were collected coincident with ECG sampling during i.v. infusion periods. Subjects received meals prior to (06.00 h) and immediately following (15.00h) the primary ECG assessment time periods and at 20.00 h.
The study was conducted in accordance with the principles described in the Declaration of Helsinki (1946) up to and including the Seoul revision (2008) [19]. A common clinical protocol was approved for each site by the appropriate Institutional Review Board and all subjects provided written informed consent prior to participation.
ECG assessments
Continuous ECG monitoring was performed throughout each inpatient ECG assessment period. ECGs were extracted (four replicates) at seven time-matched hourly time points, pre-therapy and on each infusion day, after subjects were resting quietly in the supine position for 20 min prior to and 5 min following each time point. Additional pre-therapy ECGs were extracted (four replicates) while subjects were unrestricted in physical activity at six time points on the day before dosing, and at one time point 2 days before dosing when subjects were instructed to rest in the supine position for 10 min and then stand up for 15 min. These additional ECG extractions allowed collection of a broad range of pre-therapy heart rates, including periods of physical activity and inherent diurnal variation.
The double-blind i.v. infusion procedure ensured that the sponsor, subjects and investigators were blinded to exenatide and placebo treatment. Moxifloxacin was administered open label. The cardiologists at the central ECG laboratory (Cardio Analytics, Plymouth, UK) who interpreted all ECG measurements were blinded to all study treatments/sequences. Measurement of QT was performed on superimposed median waveforms from all 12 ECG leads, using a semi-automated approach.
Laboratory values
Plasma concentrations of exenatide (Tandem Labs, San Diego, CA, USA) were measured using a validated enzyme-linked immunosorbent assay [20]. Interassay coefficient of variation was ≤6%.
Statistical analysis
A sample size of 60 evaluable subjects was predicted to provide >95% power to ensure the upper bound of the two-sided 90% CI for the largest time-matched baseline-adjusted mean difference between exenatide and placebo (ΔΔQTc) would be <10 ms (assuming 5 ms as the largest expected difference and 10 ms as the SD of within subject difference) [9]. All QT-related analyses were conducted for the intention to treat (ITT) population and the evaluable population, defined as subjects who completed all three ECG assessment periods without confounding adverse events coincident with prespecified ECG extraction time points in the primary ECG assessment window. The primary analysis was based on the evaluable population. Missing ECG data were not imputed. Safety analyses were performed for the ITT population.
QT correction methods
Five heart rate correction methods were applied to calculate the corrected QT interval, including Fridericia's correction (QTcF = QT/RR1/3) [21] and two individual QT correction methods:
where α and β are the subject specific correction factors (estimated slopes) from log linear and linear regression models fitted to each subject's pre-therapy QT and RR measurements, respectively. In addition, two study population QT correction methods were applied:
where α and β are the population correction factors (estimated slopes) from log-linear and linear regression models fitted to all pre-therapy QT and RR measurements for all subjects, respectively.
A total of 168 pre-therapy ECG measurements for each subject (four replicates at 14 time points in three periods) were used to derive correction factors for QTcI, QTcIL, QTcP and QTcPL. The QT-RR patterns during pre-therapy, exenatide and placebo treatments were compared visually to assess extent of overlap.
To evaluate each heart rate correction method, the QTc/RR pairs were plotted for each subject and the slope of the linear regression line was calculated for exenatide and placebo treatments separately by subject. The square of the linear regression slope was calculated separately for each subject for exenatide and placebo treatments. The average squared individual QTc-RR slopes were then calculated for each correction method for exenatide and placebo separately [17]. Prospectively defined rules were applied for selection of the most appropriate correction method prior to formal statistical analysis. The QT correction method that generated the average squared individual slopes closest to zero for placebo and with similar slope of QTc and RR relationship for both placebo and exenatide was then identified as the most appropriate correction method and was therefore selected for use in the primary analysis.
QT analysis
The average of the four replicates was used as the value from each time point. The primary inferential analysis was based on the ΔQTcavg, defined as the change from within treatment period baseline (baseline-adjusted) in QTc averaged across three prespecified primary ECG assessment time points (13.00 h, 14.00 h, 15.00 h) on day 1, day 2 and day 3. These time points were prospectively selected based on a pilot study that demonstrated that pharmacodynamic variables, including heart rate and insulin and glucose concentrations, had stabilized at this time following the morning meal (data on file, Amylin Pharmaceuticals, Inc.]). The baseline value for this analysis was defined as the mean QTc across the same pre-therapy time points for each ECG assessment period for each subject.
For the most appropriate QTc, a mixed effects model was employed with the ΔQTc as the dependent variable, and treatment (exenatide/placebo), day, time, period, sequence, and day-by-time-by-treatment interaction as fixed effects. A random intercept for subject was included in the model. A treatment-day-time-specific variance was assumed. If the fixed effects for period and/or sequence were non-significant (P > 0.1), these effects were removed from the final model. Data collected at all 21 prespecified ECG assessment time points within the ECG assessment window (09.00 h to 15.00 h for 3 days) from exenatide and placebo treatment periods were included in the model fitting. The time-matched LS mean difference in ΔQTc (ΔΔQTc) and averaged ΔQTc (ΔΔQTcavg or the mean of ΔQTc over the three primary ECG assessment time points) between exenatide and placebo and associated two-sided 90% CI was produced for each day. A negative TQT study was to be concluded if, based on the most appropriate QTc method, the upper bound of the two-sided 90% CI for the ΔΔQTcavg was <10 ms at all exenatide concentrations. Secondary QTc analyses were repeated for other correction methods for all time points for the evaluable and ITT populations.
The time-matched LS mean (SEM) difference between moxifloxacin and placebo and the associated two-sided 90% CI were computed. To adjust for multiplicity, a resampling-based multiple test was carried out [22]. Assay sensitivity was to be established if the lower bound of the two-sided adjusted 90% CI for the time-matched ΔΔQTc was greater than 5 ms at any of the preselected time points (1 h, 2 h or 3 h following moxifloxacin administration). The baseline for this analysis was calculated as the mean of the three pre-therapy time points corresponding to 1 h, 2 h and 3 h following moxifloxacin administration for each subject.
Frequency of QTc outlier values (QTc >450 ms and ΔQTc >30 ms) were summarized. Descriptive statistics for QT, QTc, heart rate, RR, PR and QRS intervals and changes in these parameters from baseline were summarized.
Concentration–effect (QTc) analysis
The relationship of QTc with plasma exenatide concentration was assessed using a linear mixed effects model with ΔΔQTc from the most appropriate correction method as the dependent variable, the time-matched on-treatment exenatide plasma concentration as a covariate, and subject intercept and slope as random effects, with an assumption of unstructured covariance matrix. To identify the optimal model, 10 models were evaluated to assess assumptions of linearity or log linearity, the intercept effect, the subject random effect on slope and intercept and the correlation between them. The goodness-of-fit of each model was evaluated based on the AIC, the total coefficient of determination ( ), the number of model parameters and the assessment of diagnostic plots [23].
Safety analyses
Treatment emergent adverse events were defined as those that occurred or worsened after initiation of study medication infusion. Events were assigned to the treatment received at the onset of the event.
Results
Patient disposition and baseline characteristics
Of 86 randomized subjects who received an i.v. infusion of study medication (ITT population), 11 subjects withdrew for reasons including subject decision (n = 5), adverse event (n = 3), physician decision (n = 2) and protocol violation (n = 1). No subjects were withdrawn due to changes in ECG or QT interval, resulting in minimal bias from subject discontinuations. Seventy-five (87%) subjects completed three ECG assessment periods; one subject experienced vomiting within 5 min of an ECG extraction time point and was excluded from the evaluable population, resulting in 74 evaluable subjects. The evaluable population was predominantly male (91%) and Caucasian (73%), with a mean ± SD age of 42 ± 12 years and body mass index (BMI) of 28.4 ± 2.3 kg m−2 at baseline.
Plasma exenatide concentration
Continuous i.v. infusion of exenatide resulted in stable mean plasma concentrations within the primary ECG assessment window on each day (Figure 1). The three targeted plasma exenatide concentrations (∼200 pg ml−1, ∼300 pg ml−1 and ∼500 pg ml−1) were exceeded, with geometric mean ± SEM steady-state plasma exenatide concentrations of 253 ± 8.5 pg ml−1 on day 1, 399 ± 11.9 pg ml−1 on day 2 and 627 ± 21.2 pg ml−1 on day 3.
Figure 1.
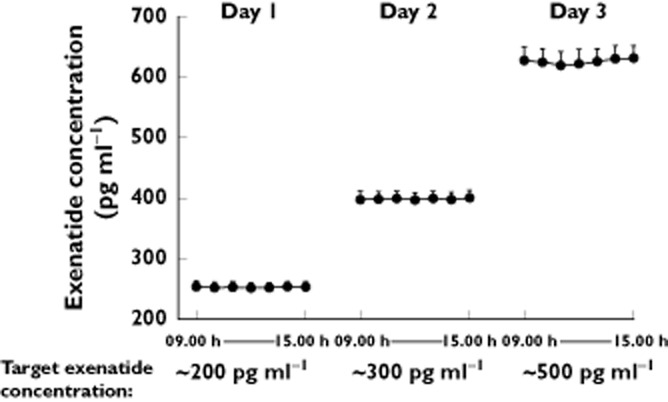
Geometric mean (SEM) plasma exenatide concentrations achieved with continuous intravenous infusion. Targeted plasma concentrations were exceeded and remained stable during the ECG assessment period
Selection of heart rate correction method
Acute exenatide infusion was associated with an increase in heart rate in this healthy population, with a mean increase from baseline in heart rate of up to +16.8 beats min−1 compared with a smaller increase with placebo (up to +5.5 beats min−1). Importantly, sufficient overlap existed between heart rates observed pre-therapy and on-treatment (Figure 2), ensuring that pre-therapy data were adequate to derive individualized and population-based correction factors. The average sum of squared individual QTc-RR slopes was lowest on placebo with the two population derived correction methods (QTcP and QTcPL, Table 1); QTcP was chosen as the QTc parameter in the primary analysis, as it resulted in a similar slope of the QTc and RR relationship for both placebo and exenatide, thus demonstrating a lack of an effect on the QT/RR relationship.
Figure 2.
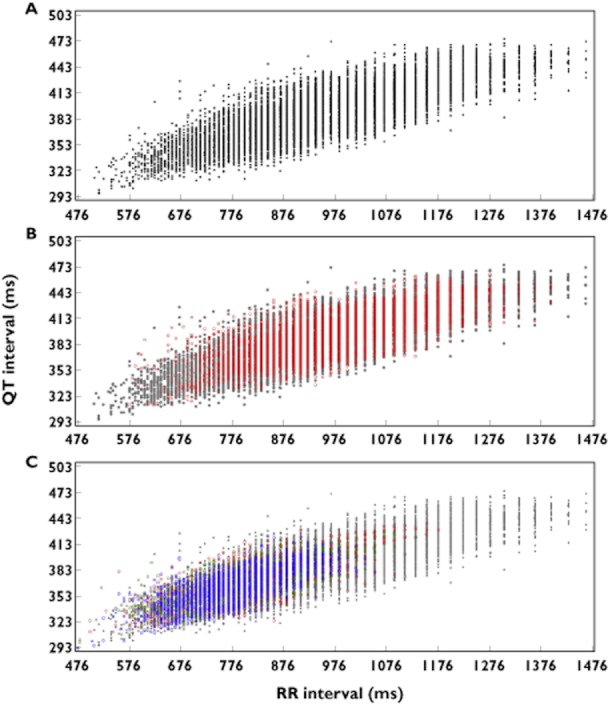
Range of heart rate observations during the pre-therapy period and placebo and exenatide treatment. The range of observed heart rates at pre-therapy (A) and on placebo (B) treatment overlapped with the range observed on exenatide (C).  , pre-therapy (Day −1);
  , placebo;
  , 200 pg ml−1 target exenatide concentration (Day 1);
  , 300 pg ml−1 target exenatide concentration (Day 2);
  , 500 pg ml−1 target exenatide concentration (Day 3)
Table 1.
Slope estimates for QT correction factors
| Slope estimates: mean of squared individual QTc-RR slopes* | |||||
|---|---|---|---|---|---|
| Treatment | QTcP | QTcF | QTcI | QTcPL | QTcIL |
| Placebo (n = 74) | 0.0027 | 0.0028 | 0.0032 | 0.0027 | 0.0032 |
| Exenatide (n = 74) | 0.0030 | 0.0031 | 0.0041 | 0.0016 | 0.0026 |
A regression line was fitted to each subject QTc/RR pairs of four replicates at 21 pre-specified ECG assessment time points (09.00 h to 15.00 h on day 1, day 2 and day 3) by treatment (exenatide or placebo) and the mean of squared individual QTc-RR slope was calculated. QTcF, Fridericia QT correction; QTcI, individual QT correction-log linear; QTcIL, individual QT correction-linear QTcP, population QT correction-log linear; QTcPL, population QT correction-linear.
Analysis of QTc with exenatide and placebo infusion
Exenatide at mean supratherapeutic plasma concentrations up to and greater than 600 pg ml−1 did not prolong the QTc interval. An effect of exenatide on QTc interval exceeding 10 ms could confidently be excluded, as the upper limit of the two-sided 90% confidence interval (CI) for least squares (LS) mean ΔΔQTcPavg (the mean of placebo-corrected, baseline-adjusted QTc over the three primary ECG assessment time points) was below 10 ms for all exenatide concentrations (Table 2).
Table 2.
LS mean changes from baseline in QTcP for exenatide and placebo
| Time (h) | LS mean (SEM) change in QTcP* from baseline† (ΔQTcP) (ms) | LS mean difference in change from baseline in QTcP (ΔΔQTcP) (two-sided 90% CI) exenatide – placebo (ms) | |
|---|---|---|---|
| Exenatide (n = 74) | Placebo (n = 74) | ||
| ∼200 pg ml−1 (Day 1) | |||
| ΔQTcPavg‡ | −2.25 (0.636) | −0.89 (0.599) | −1.36 (−2.21, −0.50) |
| 09.00 h | −2.84 (0.987) | −8.42 (0.904) | 5.58 (3.69, 7.46) |
| 10.00 h | −2.99 (0.958) | −7.20 (0.922) | 4.21 (2.34, 6.08) |
| 11.00 h | −2.54 (0.878) | −3.06 (0.939) | 0.52 (−1.26, 2.30) |
| 12.00 h | −1.97 (0.847) | −1.13 (0.885) | −0.83 (−2.49, 0.83) |
| 13.00 h | −1.91 (0.792) | 0.12 (0.728) | −2.03 (−3.38, −0.68) |
| 14.00 h | −2.27 (0.887) | −0.54 (0.806) | −1.73 (−3.34, −0.12) |
| 15.00 h | −2.57 (0.860) | −2.25 (0.752) | −0.32 (−1.81, 1.18) |
| ∼300 pg ml−1 (Day 2) | |||
| ΔQTcPavg‡ | −2.58 (0.640) | −0.56 (0.596) | −2.02 (−2.88, −1.16) |
| 09.00 h | −4.19 (0.953) | −8.05 (0.949) | 3.86 (1.96, 5.76) |
| 10.00 h | −3.85 (0.899) | −6.64 (0.956) | 2.79 (0.95, 4.63) |
| 11.00 h | −3.27 (0.905) | −4.03 (0.944) | 0.76 (−1.07, 2.59) |
| 12.00 h | −2.59 (0.865) | −1.66 (0.837) | −0.93 (−2.55, 0.69) |
| 13.00 h | −2.45 (0.844) | −0.20 (0.756) | −2.26 (−3.73, −0.78) |
| 14.00 h | −2.46 (0.872) | −0.38 (0.775) | −2.08 (−3.62, −0.54) |
| 15.00 h | −2.81 (0.859) | −1.09 (0.735) | −1.72 (−3.19, −0.25) |
| ∼500 pg ml−1 (Day 3) | |||
| ΔQTcPavg‡ | −3.54 (0.675) | −2.41 (0.623) | −1.13 (−2.11, −0.15) |
| 09.00 h | −5.22 (0.933) | −8.35 (0.924) | 3.13 (1.29, 4.97) |
| 10.00 h | −4.12 (0.966) | −7.62 (0.887) | 3.50 (1.67, 5.33) |
| 11.00 h | −4.14 (0.937) | −6.09 (0.847) | 1.94 (0.20, 3.68) |
| 12.00 h | −4.01 (0.874) | −2.16 (0.822) | −1.85 (−3.47, −0.24) |
| 13.00 h | −2.40 (0.931) | −2.07 (0.783) | −0.33 (−1.97, 1.31) |
| 14.00 h | −3.78 (0.935) | −2.38 (0.835) | −1.39 (−3.11, 0.33) |
| 15.00 h | −4.44 (0.936) | −2.78 (0.841) | −1.67 (−3.40, 0.06) |
Repeated measures linear mixed effects model.
Mean of three measures at 13.00 h, 14.00 h and 15.00 h on pre-therapy day of the corresponding treatment period.
Mean of three measures at 13.00 h, 14.00 h and 15.00 h on day 1, 2 or 3 of the corresponding treatment period. CI, confidence interval; LS, least squares; n, number of subjects studied; QTcP, population QT correction-log linear.
The time-matched LS mean ΔQTcP over time for exenatide and placebo was below zero for all concentrations and time points (Figure 3A and Table 2). The upper limit of the two-sided 90% CI for LS mean ΔΔQTcP was below 10 ms for all individual time points within the assessment window (09.00 h to 15.00 h, Figure 3B). Further support for the absence of a QTc effect was provided by analyses using the additional correction methods, for which the LS mean ΔΔQTcavg and two-sided 90% CI at all plasma exenatide concentrations were <10 ms (at ∼500 pg ml−1 plasma exenatide concentration: ΔΔQTcFavg, −1.00 [1.98, −0.02], ΔΔQTcIavg, 1.78 [−2.74, −0.82], ΔΔQTcILavg, −2.55 [−3.45, −1.64], and ΔΔQTcPLavg, −2.16 [−3.10, −1.23]).
Figure 3.

ΔQTcP (LS mean (SEM)) (A); ΔΔQTcP (LS mean (upper bound of two-sided 90% CI) (B) and ΔHR (mean (SEM)) over time (C).  , exenatide;
  , placebo
For subjects who discontinued study participation, ECG data were available at baseline and through the time of withdrawal. The results of an analysis of ΔΔQTc for the ITT population (n = 86), which included non-completers, were consistent with the results from the evaluable population (n = 74).
A linear mixed effects model with exenatide concentration as a covariate, fixed intercept of zero and unknown correlation between subject random intercept and random slope was found most appropriate to assess the relationship between ΔΔQTcP and plasma exenatide concentration, based on comparison of Akaike Information Criterion (AIC),  , the number of model parameters and assessment of diagnostic plots for models evaluated. There was no relationship observed between ΔΔQTcP and plasma exenatide concentration (Figure 4). Using this model, an LS mean ΔΔQTcP of 0.51 ms, with a two-sided 90% CI of −1.08 ms, 2.09 ms was estimated at the maximum observed steady-state plasma exenatide concentration (627 pg ml−1).
Figure 4.
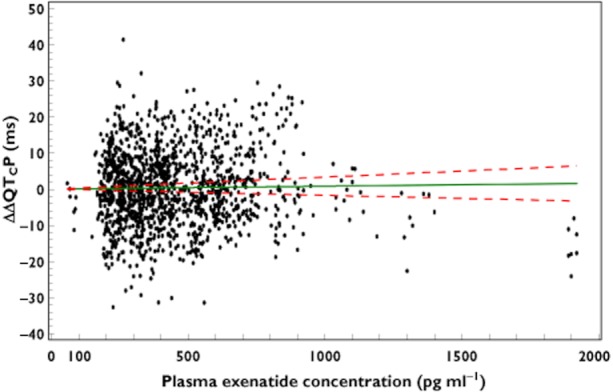
ΔΔQTcP vs. plasma exenatide concentration; Slope (90% CI) = 0.0008 (−0.0017, 0.0033); P = 0.5962; based on a linear mixed effects model with exenatide concentration as covariate, fixed intercept of zero and unknown correlation between subject random intercept and random slope
No subjects experienced a QTcP >450 ms or a change from baseline in QTcP >30 ms with exenatide or placebo. No clinically relevant effects on the PR or QRS intervals were observed with exenatide. At the highest plasma exenatide concentration, the largest mean ± SEM changes from baseline were +2.5 ± 1.5 ms (PR) and −2.4 ± 0.5 ms (QRS). No events of atrial-ventricular (AV) block were reported.
Assay sensitivity
Consistent with the known QTc prolongation effects of moxifloxacin, the lower bound of the two-sided 90% adjusted CI of ΔΔQTcP for moxifloxacin was >5 ms at two of the three prespecified time points, confirming assay sensitivity. The LS mean ΔΔQTcP (two-sided 90% CI) was 5.47 (2.82, 8.12) ms, 10.56 (8.46, 12.67) ms and 10.93 (8.71, 13.13) at 1 h, 2 h and 3 h, respectively, following moxifloxacin administration. The peak effect and time course of ΔΔQTcP for moxifloxacin over 25 h were consistent with that observed in other TQT studies (data not shown) [24].
Safety and tolerability
A total of 77 (90%) of the 86 ITT subjects participating in at least one ECG assessment period experienced adverse events during the study, with 89% of subjects experiencing adverse events with exenatide compared with 25% with placebo and 23% with moxifloxacin. The majority of adverse events were assessed as mild in intensity. There were no events of hypoglycaemia reported. As expected, given the supratherapeutic dosing, nausea, vomiting and symptoms of gastroesophageal reflux disease were most commonly associated with exenatide and were observed less frequently with placebo or moxifloxacin. Three subjects withdrew from study participation due to adverse events, including events of nausea and vomiting associated with exenatide and one serious adverse event of elevation of creatinine phosphokinase observed after washout of exenatide and prior to placebo infusion in the subsequent treatment period. No other serious adverse events were reported. Overall, the low number of withdrawals due to gastrointestinal adverse events indicated that exenatide was generally well tolerated in this healthy subject population using this titration regimen, even when exenatide was administered at very high doses.
Discussion
This exenatide TQT study employed i.v. infusion of exenatide to achieve therapeutic and supratherapeutic plasma exenatide concentrations in healthy volunteers without intolerable gastrointestinal adverse events and within a time frame feasible for such a study (i.e. days rather than weeks). Applying a randomized, double-blind, three-period, crossover design, this study demonstrated that exenatide does not prolong the QTc interval. A ΔΔQTc effect >10 ms could clearly be excluded and the study therefore met the criteria described by ICH E14 guidance as a negative TQT study [7, 8]. The upper limit of the two-sided 90% CI for the LS mean ΔΔQTcP, the most appropriate heart rate correction method based on predefined selection criteria, was below the 10 ms threshold of clinical and regulatory concern across the range of exenatide concentrations evaluated, including target mean concentrations up to 1.5- to 2.5-fold higher than those typically achieved in patients with exenatide twice daily or exenatide once weekly. There were no individual outliers, as no subject had an absolute QTc >450 ms or an increase from baseline in QTc >30 ms with exenatide. Assay sensitivity was demonstrated with a moxifloxacin positive control. Concentration−effect modelling demonstrated the lack of a meaningful relationship between ΔΔQTcP and plasma exenatide concentration, including concentrations exceeding those observed in patients with renal impairment. No effects on AV conduction (as evaluated by PR interval) or intra-ventricular conduction (as evaluated by QRS interval) were observed. These results are consistent with previous findings of no clinically meaningful changes in QTc with the GLP-1 receptor agonists exenatide and liraglutide at therapeutic concentrations [9, 10, 25].
In a previous TQT study that assessed the effect on cardiac repolarization of a single subcutaneous 10 μg dose of exenatide twice daily, an effect on ΔΔQTcF and ΔΔQTcI exceeding 10 ms could be excluded, but peak plasma exenatide concentrations (mean [%CV] 208 [9] pg ml−1) were substantially lower than in the current study. Furthermore, a positive slope of the relationship between ΔΔQTcF and plasma exenatide concentration was observed, which could potentially be extrapolated and interpreted as suggesting a potential QTc effect at plasma concentrations above those actually observed in the study [9]. However, a post hoc analysis using the evaluation method for selecting the most appropriate correction method, as in the current study, demonstrated that QTcI more appropriately removed the heart rate dependence, and no correlation between plasma exenatide concentrations and ΔΔQTcI was observed. The results from the two studies are therefore consistent and are now also expanded to include substantially higher plasma exenatide concentrations.
The design of this TQT study included novel features with potential utility for future investigations, including application of a prospectively-defined methodology to select an appropriate heart rate correction method and implementation of i.v. infusion to achieve and maintain steady-state drug concentrations.
A 2 to 4 beats min−1 increase in heart rate is observed in patients with type 2 diabetes with long-term exenatide therapy [3, 4, 26]. However, during i.v. exenatide infusion in the current investigation, an increase of heart rate up to approximately 17 beats min−1 was observed in healthy volunteers. This observation required application of appropriate design features that are relevant to future studies of drugs that significantly increase heart rate. A wide range of heart rates was collected pre-therapy to allow derivation of an appropriate heart rate correction algorithm [27, 28]. This range of heart rates was achieved by extracting ECGs at several time points at which subjects were more freely moving and from a time point at which subjects performed a protocol-prescribed supine-to-standing manoeuvre. As a result, substantial overlap of pre-therapy and on-treatment heart rates was achieved (Figure 2). As it is impossible to predict the optimal heart rate correction method for a specific dataset in advance, five different heart rate correction methods were prospectively applied to the data and the ability of each to correct for heart rate changes was evaluated using the methodology proposed by members of the FDA's Interdisciplinary Review Team for QT studies [17]. It was concluded that QTcP, QTcPL and QTcF removed the heart rate dependence better than individualized correction methods on placebo data, with the mean of squared individual slopes of 0.0027-0.0028 compared with 0.0032 for QTcI and QTcIL (Table 1).
The optimal way of achieving a sufficiently broad range of heart rates at baseline to construct an individualized QTcI is yet to be defined and it should be recognized that the QT/RR relationship during light activity and postural procedures may not be the same as during drug-induced heart rate increases. It is therefore important to assess the appropriateness of employed QT correction methods on both drug free (placebo) and on drug conditions and to also include ‘study independent’ correction methods, e.g. QTcF. In the current study, different correction methods generally corrected for heart rate changes the same way with placebo and drug, with the exception of the linear population-based method, QTcPL, which more effectively removed the heart rate dependence on exenatide than on placebo (Table 1). It is also noteworthy that QTcF, which uses a fixed correction factor, was comparable with methods derived from the study data (QTcI and QTcP) and that a QTc effect exceeding 10 ms could be excluded with all correction methods.
A continuous i.v. infusion paradigm was implemented to achieve and maintain both therapeutic and supratherapeutic steady-state plasma exenatide concentrations. By design, the gradual rise in exenatide exposure improved gastrointestinal tolerability in healthy subjects compared with acute dosing and allowed evaluation of higher plasma concentrations than would have otherwise been tolerated. Minimization of gastrointestinal adverse events such as nausea and vomiting is important in QT studies, as these events may have significant direct effects on the QTc interval. In addition, the i.v. infusion paradigm also maintained steady-state plasma exenatide concentrations over a 6 h ECG assessment period, allowing selection of time points for QT assessment at which pharmacodynamic variables were stable. It is important to note that the sole purpose of the i.v. infusion approach was to achieve and maintain sufficiently high plasma exenatide concentrations in this specific study to assess effects on cardiac repolarization; the efficacy and the overall safety profile of exenatide in patients with diabetes has been demonstrated using the subcutaneous formulations [1–6].
Evaluation of ΔQTcP across all time points (Figure 3) during placebo infusion demonstrated a large fluctuation between early time points in the ECG assessment window, likely reflecting instability of variables such as insulin and glucose concentrations post-prandially and consistent with demonstrations of an effect of food consumption on QTc [29] (data on file, Amylin Pharmaceuticals, Inc.). This fluctuation across early time points was lower during exenatide infusion, likely due to the antihyperglycaemic effect of exenatide to blunt post-prandial rises in glucose concentrations in healthy subjects. Similar effects were observed in QT analyses for the GLP-1 receptor agonist, liraglutide [25]. As steady-state exenatide concentrations were maintained over time, the primary analysis could focus on the time period of greatest stability in pharmacodynamic variables, which was confirmed by stable serum glucose concentrations over the primary ECG assessment window. Mean serum glucose concentrations with i.v. exenatide infusion were approximately 5 mmol l−1 from 09.00 h to 15.00 h. With i.v. placebo infusion, mean serum glucose concentrations were approximately 6 mmol l−1 at the 09.00 h time point and approximately 5 mmol l−1 at the remaining time points in the ECG assessment period. Further investigation of the effects of glucose on QT and the potential impact of antihyperglycaemic medications on that relationship is warranted.
Given the incidence of renal impairment in patients with type 2 diabetes [14] and a potential for higher plasma exenatide concentrations in those with mildly or moderately impaired renal function [12, 13], it is important to establish the safety of exenatide with regard to the QT interval at higher plasma exenatide concentrations. In patients with mild and moderate renal impairment, increases in exenatide exposure of 33% and 62%, respectively, compared with patients with normal renal function, were predicted based on population pharmacokinetic analysis [30]. In patients treated with exenatide once weekly with normal renal function compared to those with mild or moderate renal impairment, geometric mean steady-state plasma exenatide concentrations were approximately 210 pg ml−1, 290 pg ml−1 and 340 pg ml−1, respectively (data on file, Amylin Pharmaceuticals, Inc.). These plasma exenatide concentrations were clearly exceeded in the current study and the results therefore demonstrate that the observation of no QTc effect can be expanded to plasma exenatide concentrations above those observed in patients with diabetes, including the subpopulation with impaired renal function.
The novel selection procedure for determining the appropriate QT correction methodology and the utilization of a slowly increasing i.v. exenatide infusion to permit attainment of higher plasma concentrations than could have been achieved with other dosing techniques have potential applications for future TQT studies.
In summary, this TQT study in healthy volunteers supports the safe use of exenatide in regard to pro-arrhythmic risk associated with delayed cardiac repolarization or alterations in AV or intra-ventricular conduction in patients with diabetes, including those with impaired renal function.
Acknowledgments
The authors thank the exenatide BCB112 clinical team for their assistance in the conduct, reporting, and quality control of the studies, the BCB112 study site investigators, Drs Ronald Kimberlin, H. Frank Farmer, Jr and David C. Subich and their staff for conducting the study and the study patients for their participation. The authors gratefully acknowledge additional statistical analysis and consultation by Drs Kevin Shan, Cory Heilmann and Alan Chiang. The study was supported by Amylin Pharmaceuticals, Inc. and Eli Lilly and Co.
Competing Interests
All authors have completed the Unified Competing Interest form (available on request from the corresponding author) and declare that BD is a consultant to Eli Lilly and Co., PS is a consultant to Amylin Pharmaceuticals, Inc., LM, BC, JH, WH, JM, CS, LS and LP are employees and stockholders of Amylin Pharmaceuticals, Inc. and MM is an employee and stockholder of Eli Lilly and Co.
References
- 1.Kendall DM, Kim D, Maggs D. Incretin mimetics and dipeptidyl peptidase-IV inhibitors: a review of emerging therapies for type 2 diabetes. Diabetes Technol Ther. 2006;8:385–396. doi: 10.1089/dia.2006.8.385. [DOI] [PubMed] [Google Scholar]
- 2.Drucker DJ, Buse JB, Taylor K, Kendall DM, Trautmann M, Zhuang D, Porter L. Exenatide once weekly versus twice daily for the treatment of type 2 diabetes: a randomised, open-label, non-inferiority study. Lancet. 2008;372:1240–1250. doi: 10.1016/S0140-6736(08)61206-4. [DOI] [PubMed] [Google Scholar]
- 3.Blevins T, Pullman J, Malloy J, Yan P, Taylor K, Schulteis C, Trautmann M, Porter L. DURATION-5: exenatide once weekly resulted in greater improvements in glycemic control compared with exenatide twice daily in patients with type 2 diabetes. J Clin Endocrinol Metab. 2011;96:1301–1310. doi: 10.1210/jc.2010-2081. [DOI] [PubMed] [Google Scholar]
- 4.Diamant M, Van Gaal L, Stranks S, Northup J, Cao D, Taylor K, Trautmann M. Once weekly exenatide compared with insulin glargine titrated to target in patients with type 2 diabetes (DURATION-3): an open-label randomised trial. Lancet. 2010;375:2234–2243. doi: 10.1016/S0140-6736(10)60406-0. [DOI] [PubMed] [Google Scholar]
- 5.Bergenstal RM, Wysham C, Macconell L, Malloy J, Walsh B, Yan P, Wilhelm K, Malone J, Porter LE. Efficacy and safety of exenatide once weekly versus sitagliptin or pioglitazone as an adjunct to metformin for treatment of type 2 diabetes (DURATION-2): a randomised trial. Lancet. 2010;376:431–439. doi: 10.1016/S0140-6736(10)60590-9. [DOI] [PubMed] [Google Scholar]
- 6.Klonoff DC, Buse JB, Nielsen LL, Guan X, Bowlus CL, Holcombe JH, Wintle ME, Maggs DG. Exenatide effects on diabetes, obesity, cardiovascular risk factors and hepatic biomarkers in patients with type 2 diabetes treated for at least 3 years. Curr Med Res Opin. 2008;24:275–286. doi: 10.1185/030079908x253870. [DOI] [PubMed] [Google Scholar]
- 7.Darpö B. The thorough QT/QTc study 4 years after the implementation of the ICH E14 guidance. Br J Pharmacol. 2010;159:49–57. doi: 10.1111/j.1476-5381.2009.00487.x. [DOI] [PMC free article] [PubMed] [Google Scholar]
- 8.Food and Drug Administration. Guidance for Industry: E14 Clinical Evaluation of QT/Qtc Interval Prolongation and Proarrhythmic Potential for Non-Antiarrhythmic Drugs. [FDA Guidance] Rockville, MD: U.S. Department of Health and Human Services, Food and Drug Administration; 2005. [Google Scholar]
- 9.Linnebjerg H, Seger M, Kothare PA, Hunt T, Wolka AM, Mitchell MI. A thorough QT study to evaluate the effects of single dose exenatide 10 μg on cardiac repolarization in healthy subjects. Int J Clin Pharmacol Ther. 2011;49:594–604. doi: 10.5414/cp201462. [DOI] [PubMed] [Google Scholar]
- 10.Sager P, Darpö B, Han J, Kothare P, Linneberg H, Mitchell M, Porter L. Exenatide once weekly did not affect corrected QT interval in patients with type 2 diabetes. Diabetes. 2011;60:A294. [Google Scholar]
- 11.Amylin Pharmaceuticals Inc. BYETTA® Exenatide Injection. [Prescribing Information] San Diego, CA: Amylin Pharmaceuticals, Inc; 2010. [Google Scholar]
- 12.Linnebjerg H, Kothare PA, Seger M, Wolka AM, Mitchell MI. Exenatide – pharmacokinetics, pharmacodynamics, safety and tolerability in patients ≥75 years of age with type 2 diabetes. Int J Clin Pharmacol Ther. 2011;49:99–108. doi: 10.5414/cp201361. [DOI] [PubMed] [Google Scholar]
- 13.Linnebjerg H, Kothare PA, Park S, Mace K, Reddy S, Mitchell M, Lins R. Effect of renal impairment on the pharmacokinetics of exenatide. Br J Clin Pharmacol. 2007;64:317–327. doi: 10.1111/j.1365-2125.2007.02890.x. [DOI] [PMC free article] [PubMed] [Google Scholar]
- 14.Adler AI, Stevens RJ, Manley SE, Bilous RW, Cull CA, Holman RR. Development and progression of nephropathy in type 2 diabetes: the United Kingdom Prospective Diabetes Study (UKPDS 64) Kidney Int. 2003;63:225–232. doi: 10.1046/j.1523-1755.2003.00712.x. [DOI] [PubMed] [Google Scholar]
- 15.Nauck M, Frid A, Hermansen K, Shah NS, Tankova T, Mitha IH, Zdravkovic M, During M, Matthews DR LEAD-2 Study Group. Efficacy and safety comparison of liraglutide, glimepiride, and placebo, all in combination with metformin, in type 2 diabetes: the LEAD (liraglutide effect and action in diabetes)-2 study. Diabetes Care. 2009;32:84–90. doi: 10.2337/dc08-1355. [DOI] [PMC free article] [PubMed] [Google Scholar]
- 16.Okerson T, Chilton RJ. The cardiovascular effects of GLP-1 receptor agonists. Cardiovasc Ther. 2010;30:e146–155. doi: 10.1111/j.1755-5922.2010.00256.x. [DOI] [PMC free article] [PubMed] [Google Scholar]
- 17.Tornøe CW, Garnett CE, Wang Y, Florian J, Li M, Gobburu JV. Creation of a knowledge management system for QT analyses. J Clin Pharmacol. 2011;51:1035–1042. doi: 10.1177/0091270010378408. [DOI] [PubMed] [Google Scholar]
- 18.Williams EJ. Experimental designs balanced for the estimation of residual effects of treatments. Aust J Sci Res. 1949;2:149–168. [Google Scholar]
- 19.World Medical Association Declaration of Helsinki. Recommendations guiding physicians in biomedical research involving human subjects. JAMA. 1997;277:925–926. [PubMed] [Google Scholar]
- 20.Fineman MS, Bicsak TA, Shen LZ, Taylor K, Gaines E, Varns A, Kim D, Baron AD. Effect on glycemic control of exenatide (synthetic exendin-4) additive to existing metformin and/or sulfonylurea treatment in patients with type 2 diabetes. Diabetes Care. 2003;26:2370–2377. doi: 10.2337/diacare.26.8.2370. [DOI] [PubMed] [Google Scholar]
- 21.Fridericia LS. The duration of systole in an electrocardiogram in normal humans and in patients with heart disease. Ann Noninvasive Electrocardiol. 2003;8:343–351. doi: 10.1046/j.1542-474X.2003.08413.x. [DOI] [PMC free article] [PubMed] [Google Scholar]
- 22.Tobias RD, Rom D, Wolfinger RD, Hochberg Y. Westfall PH, editor. Multiple comparisons among treatment means in the general linear model. 1999. Multiple comparisons and multiple tests using the SAS system.
- 23.Liu H, Zheng Y, Shen J. Goodness-of-fit measures of R2 for repeated measures mixed effect models. J Appl Stat. 2008;35:1081–1092. [Google Scholar]
- 24.Florian JA, Tornoe CW, Brundage R, Parekh A, Garnett CE. Population pharmacokinetic and concentration-QTc models for moxifloxacin: pooled analysis of 20 thorough QT studies. J Clin Pharmacol. 2011;51:1152–1162. doi: 10.1177/0091270010381498. [DOI] [PubMed] [Google Scholar]
- 25.Chatterjee DJ, Khutoryansky N, Zdravkovic M, Sprenger CR, Litwin JS. Absence of QTc prolongation in a thorough QT study with subcutaneous liraglutide, a once-daily human GLP-1 analog for treatment of type 2 diabetes. J Clin Pharmacol. 2009;49:1353–1362. doi: 10.1177/0091270009339189. [DOI] [PubMed] [Google Scholar]
- 26.Gill A, Hoogwerf BJ, Burger J, Bruce S, Macconell L, Yan P, Braun D, Giaconia J, Malone J. Effect of exenatide on heart rate and blood pressure in subjects with type 2 diabetes mellitus: a double-blind, placebo-controlled, randomized pilot study. Cardiovasc Diabetol. 2010;9:6. doi: 10.1186/1475-2840-9-6. [DOI] [PMC free article] [PubMed] [Google Scholar]
- 27.Malik M, Garnett CE, Zhang J. Thorough QT studies: questions and quandaries. Drug Saf. 2010;33:1–14. doi: 10.2165/11319160-000000000-00000. [DOI] [PubMed] [Google Scholar]
- 28.Garnett CE, Zhu H, Malik M, Fossa AA, Zhang J, Badilini F, Li J, Darpö B, Sager P, Rodriguez I. Methodologies to characterize the QT/corrected QT interval in the presence of drug-induced heart rate changes or other autonomic effects. Am Heart J. 2012;163:912–930. doi: 10.1016/j.ahj.2012.02.023. [DOI] [PubMed] [Google Scholar]
- 29.Taubel J, Wong AH, Naseem A, Ferber G, Camm AJ. Shortening of the QT interval after food can be used to demonstrate assay sensitivity in thorough QT studies. J Clin Pharmacol. 2011 doi: 10.1177/0091270011419851. doi: 10.1177/0091270011419851. [Epub ahead of print] [DOI] [PubMed] [Google Scholar]
- 30.Amylin Pharmaceuticals Inc. BYDUREON® (Exenatide Extended-Release for Injectable Suspension). [Prescribing Information] San Diego, CA: Amylin Pharmaceuticals Inc; 2012. [Google Scholar]