

Abstract
Objectives
The aim of the study was to evaluate the characteristics, risk factors and outcome of recent stroke patients in Kyoto, Japan.
Design
We analysed stroke patients in the registry with regard to their characteristics, risk factors and mortality. Cox proportional hazards regressions were used to calculate adjusted HRs for death.
Settings
The Kyoto prefecture of Japan has established a registry to enrol new stroke patients in cooperation with the Kyoto Medical Association and its affiliated hospitals
Participants
The registry now has data on 14 268 patients enrolled from 1 January 1999 to 31 December 2009. Of these, 12 774(89.5%) underwent CT, 9232 (64.7%) MRI, 2504 (17.5%) angiography and 342 (2.4%) scintigraphy. Excluding 480 (3.3%) unclassified patients, 13 788 (96.6%) patients formed the basis of further analyses which were divided into three subtypes: cerebral infarction (CI), cerebral haemorrhage (CH) and subarachnoid haemorrhage (SAH).
Results
A total of 13 788 confirmed stroke patients in the study cohort comprised 9011 (86.3%) CI, 3549 (25.7%) CH and 1197 (8.7%) SAH cases. The mean age ±SD was 73.3±11.8, 69.1±13.6 and 62.7±13.5 in the CI, CH and SAH cases, respectively. Men were predominant in the CI and CH cases, whereas women were predominant in the SAH cases. The frequencies of risk factors were different among the subtypes. Mortality was worst in SAH, followed by CH, and least in CI. HRs for death adjusted for age, sex, histories of hypertension, arrhythmia, diabetes mellitus and hyperlipaemia and use of tobacco and/or alcohol showed a significant (p<0.001) difference among CI (as reference), CH (3.71; 3.11 to 4.43) and SAH (8.94; 7.21 to 11.11).
Conclusions
The characteristics, risk factors and mortality were evaluated in a quantitative manner in a large Japanese study cohort to shed light on the present status of stroke medicine.
Article summary.
Article focus
We examined the characteristics, risk factors and outcome of contemporary stroke patients based on the Kyoto Stroke Registry during the past 11 years. The study cohort has 12 774 cerebral infarction (CI), 9232 cerebral haemorrhage (CH) and 2540 subarachnoid haemorrhage (SAH) patients.
Key messages
About two-thirds of the patients have a history of hypertension, whereas only about one-fifth have histories of arrhythmia, diabetes mellitus or hyperlipaemia. The prevalence of risk factors was different among stroke subtypes.
Mortality within 30 days after the onset was 5.2% in CI, 15.2% in CH and 28.4% in SAH.
HRs for death adjusted for age, sex, histories of hypertension, arrhythmia, diabetes mellitus and hyperlipaemia and use of tobacco and/or alcohol showed a significant (p<0.001) difference among CI (as reference), CH (3.71; 3.11 to 4.43) and SAH (8.95; 7.21 to 11.11).
Strengths and limitations of this study
This study provided quantitative data on the fundamentals of contemporary stroke in a very large cohort in the Kyoto Prefecture, Japan.
Detailed information on the size and localisation of the stroke and on treatment and complications was not available in this population-based study.
Introduction
Stroke, the third major cause of death, is the largest cause of acquired disability in Japan.1 According to a report of the Ministry of Health, Labor and Welfare, about 123 400 people died from stroke in 2010. About 10.3% of all national deaths resulted from stroke. Stroke is regarded as one of the diseases developed by long-lasting exposure to risk factors associated with lifestyle. The incidence, as well as mortality, should be greatly affected by society, regions and times.2 3 Updated detailed information on stroke events is required. A long-term surveillance of stroke, comparing characteristics, risk factors and mortality, based on the entire population in a prefecture as large as Kyoto, which has about 2 630 000 residents, should provide a fundamental database for stroke. Stroke consists of three major distinct subtypes, namely, cerebral infarction (CI), cerebral haemorrhage (CH) and subarachnoid haemorrhage (SAH). Although these subtypes have many things in common, distinct characteristics prevail. Quantitative measurement of these differences in the same large cohort should help characterise the three stroke subtypes.4 The strength of comparing these three stroke subtypes in the same large cohort is that, by doing so, we can evaluate the relative influence of the risk factors on each subtype. These data may also help to elucidate HRs for death among major stroke subtypes.
The Kyoto prefecture of Japan has established a registry to enrol all new stroke patients in cooperation with the Kyoto Medical Association and its affiliated hospitals, with help from the data collecting agency known as the Kyoto Stroke Registry (KSR).5 We studied all patients registered during the past 11 years in the prefecture of Kyoto to document the characteristics, risk factors and HRs in the three major stroke subtypes.
Methods
We analysed all stroke patients identified from January 1999 to December 2009 in the entire Kyoto prefecture and registered in the KSR run by the local government of Kyoto prefecture. The Kyoto Medical Association distributed the registration forms to the affiliated medical institutions and collected the data. A total of 151 hospitals have registered patients.
We supply a summary of the KSR Program in online supplementary table S1A. This summary has been distributed to all hospitals affiliated with the Kyoto Medical Association and to public health centres in the Kyoto Prefecture. It is also attached to the annual reports published by the Kyoto Prefecture.
The diagnosis of stroke was confirmed by local neurologists and/or neurosurgeons based on the WHO definition.6 Stroke patients who lived in the Kyoto prefecture were registered regardless of their age and sex. Conditions such as shock, Adam-Strokes syndrome or hypertensive encephalopathy are excluded, as they are not caused directly by cerebrovascular events. Transient ischaemic attack is also excluded as the symptoms cease within 24 h after onset. Differential diagnoses were made by the attending physicians, based on CT/MRI and other clinical examinations. Inclusion and exclusion criteria for the KSR are shown in online supplementary table S1B.
We classified the patients into CI (International Classification of Diseases (ICD)-9 code 433 and 434, ICD-10 code I63), CH (ICD-9 code 431, ICD-10 code I61), SAH (ICD-9 code 430, ICD-10 code I60)7 8 and others by neurological examination and the findings of CT scans, MRI scans, angiographies and scintigraphies. In order to clarify trends over time, we also divided the study cohort into two groups, groups A and B, according to the date of onset of the event. Group A comprises patients who developed strokes between January 1999 and June 2004, and group B comprises patients who developed strokes between July 2004 and December 2009. We showed differences between the two groups and, using multivariate analyses, calculated HRs for death comparing the two groups.
Each registry recorded age, sex, date of stroke onset, blood pressure and arrhythmia on arrival, history of hypertension, arrhythmia, diabetes mellitus and hyperlipaemia, tobacco and alcohol use, type of paresis, consciousness levels and clinical outcome 30 days after the onset.
For the purpose of this entry, we used the following definitions:
Systolic and diastolic hypertension: blood pressure is 140 and 90 mm Hg or higher;
Arrhythmia: any types of irregularity;
Diabetes mellitus: fasting plasma glucose is 126 mg/dl or higher, and/or plasma glucose 2 h after 75 g glucose load is 200 mg/dl or higher;9
Hyperlipaemia: serum cholesterol level is 220 mg/dl or higher and/or triglyceride is 150 mg/dl or higher;
Smoking was divided into four categories: non-smokers, former smokers for more than a year, light smokers with 20 or less cigarettes a day and heavy smokers with more than 20 cigarettes a day;
Alcohol consumption was divided into three categories: non-drinkers, occasional drinkers (less than three times a week) and daily drinkers (more than four times a week);
Paresis: any distribution, including unilateral or bilateral effects on the limb or face;
Statistical analysis
Statistical analyses used included Fisher's exact tests for frequencies of listed characteristics among the three stroke types, Student t test for numerical variables such as age and systolic-blood and diastolic-blood pressures, and the log-rank test for Kaplan-Meier curves of estimated survival. The Mantel-Haenszel method and a logistic regression model were used to estimate univariate and multivariate ORs. Cox proportional hazards regressions were used to calculate age, sex, histories of hypertension, arrhythmia, diabetes mellitus and hyperlipaemia, and use of tobacco and/or alcohol-adjusted HRs and their 95% confidence intervals for the risk of death. Analyses were performed using SPSS V.19 and statistical significance was set at p<0.05. All reported p values are two-sided.
Ethics statement
This research was performed in accordance with the ethical principles for medical research involving human subjects outlined in the Declaration of Helsinki. This research was approved by the Board of Directors, the Kyoto Medical Association, the Department of Health and Welfare, Kyoto Prefecture and Ethics Committee of the National Hospital Organization, Minami Kyoto Hospital. Since all identifying personal information was stripped from the secondary files before analysis, the boards waived the requirement for written informed consent from the patients involved.
Results
We reviewed 14 268 stroke patients newly identified in the Kyoto prefecture from January 1999 to December 2009. Of these, 12 774 (89.5%) underwent a CT, 9232 (64.7%) an MRI scan, 2504 (17.5%) an angiography and 342 (2.4%) a scintigraphy for blood flow. Excluding 480 (3.3%) unclassified patients, the study cohort had 13 788 patients divided into 9011 (65.4%) CI, 3549 (25.7%) CH and 1197 (8.7%) SAH cases. A small number of patients had a combination of stroke types as follows: 12 with CI and CH, 4 with CI and SAH and 15 with CH and SAH. They were omitted. Table 1 summarises the characteristics, risk factors, symptoms and death rate.
Table 1.
Characteristics of stroke patients (n=13 788)
| Overall | Cerebral infarction n=9011 (65.4%) | Cerebral haemorrhage n=3549 (25.7%) | Subarachnoid haemorrhage n=1197 (8.7%) | |
|---|---|---|---|---|
| Age (mean±SD) | 71.3 (12.9) | 73.3 (11.8)*† | 69.1 (13.6)*‡ | 62.7 (13.5)†‡ |
| Sex (% female) (n=female : male) | 45.2 (6233 : 7555) | 42.3*†(3815 : 5196) | 45.9*‡(1630 : 1919) | 64.6†‡ (773 : 424) |
| Systolic blood pressure (mean±SD) (mm Hg) | 161.3 (35.5) | 157.5 (28.3)* | 172.1 (34.8)*‡ | 157.9 (37.0)‡ |
| Diastolic blood pressure (mean±SD) (mm Hg) | 87.6 (18.63) | 85.6 (17.0) *† | 93.1 (21.1)*‡ | 86.8 (21.8)†‡ |
| Hypertension history (%) (n=with : without) | 62.6 (8005 : 4780) | 62.0*†(5285 : 3242) | 68.5*‡(2183 : 1006) | 49.9†‡ (520 : 522) |
| Arrhythmia (%) (n=with : without) | 14.5 (1932 : 11352) | 18.9*†(1647 : 7064) | 5.9*‡ (200 : 3209) | 7.2†‡ (82 : 1052) |
| Arrhythmia history (%) (n=with : without) | 18.5(2357 : 10415) | 24.3*†(2060 : 6432) | 7.5*‡ (240 : 2971) | 5.3†‡(55 : 985) |
| Diabetes mellitus history (%) (n=with : without) | 20.9 (2689 : 10198) | 24.8*†(2138 : 6475) | 14.8*‡ (474 : 2738) | 6.9†‡(71 : 963) |
| Hyperlipaemia history (%) (n=with : without) | 19.2 (2419 : 10 198) | 23.1*†(1951 : 6503) | 11.9*‡ (371 : 2755) | 9.2†‡(93 : 918) |
| Tobacco use (%) (n=with : without) | 32.4 (3665 : 7642) | 32.6*1†(2455 : 5077) | 30.1*‡(843 : 1956) | 37.1†‡ (354 : 599) |
| Non-smoker (%) (n) | 67.6 (7642) | 67.4 (5077)† | 69.9 (1956)‡ | 62.9 (599)†‡ |
| Former smoker (%) (n) | 5.4 (615) | 5.8 (435)† | 5.7 (159)‡ | 2.1 (20)†‡ |
| Light smoker (%) (n) | 17.0 (1918) | 17.0 (1281) *† | 14.6 (409)*‡ | 23.3 (222)†‡ |
| Heavy smoker (%) (n) | 10.0 (1132) | 9.8 (739) | 9.8 (275) | 11.8 (112) |
| Alcohol use (%) (n=with : without) | 38.0 (4202/6851) | 36.3*†(2654 : 4655) | 40.5*‡(1124 : 1650) | 43.6†‡ (412 : 533) |
| Non-drinker (%) (n) | 62.0 (6851) | 63.7 (4655) *† | 59.5 (1650) * | 56.4 (533)† |
| Occasional drinker (%) (n) | 15.3 (1692) | 15.5 (1131) *† | 13.5 (374)*‡ | 18.9 (179)†‡ |
| Everyday drinker (%) (n) | 22.7 (2510) | 20.8 (1523) *† | 27.0 (750) * | 24.7 (233)† |
| Paresis (%) (n=with : without) | 73.3 (9670 : 3525) | 76.8*†(6750 : 2041) | 78.5*‡(2624 : 717) | 26.8†‡ (277 : 756) |
| Consciousness disturbance (%) (n=with : without) | 43.5 (5914: 7676) | 31.8*†(2815: 8863) | 65.7* (2305: 1201) | 65.1†(775: 415) |
| JCS 0 (%) (n) | 55.7 (7676) | 67.1*†(6048) | 33.8*‡ (1201) | 35.6†‡ (415) |
| JSC 1-digit code (%) (n) | 19.0 (2619) | 16.7* (1508) | 26.0*‡ (921) | 15.9‡ (185) |
| JSC 2-digit code (%) (n) | 11.6 (1602) | 8.6*†(774) | 17.5* (622) | 16.7† (200) |
| JSC 3-digit code (%) (n) | 10.9 (1509) | 4.7*†(421) | 20.2*‡(716) | 30.5†‡(365) |
| JSC undetermined (%) (n) | 1.3 (184) | 1.2†(112) | 1.3‡ (46) | 2.1†‡ (25) |
| Delay time (mean±SD) | 3.91±4.82 | 4.20±5.21 | 3.50±4.13 | 3.13±3.77 |
| CT (%) (n) | 89.7 (12365) | 85.1 (7668) *† | 98.2 (3485) * | 98.8 (1183)† |
| MRI (%) (n) | 64.5 (8891) | 79.8 (7148) *† | 40.3 (1429)*‡ | 25.1 (300) *† |
| Surgery (%) (n=with : without) | 16.0 (2171 : 11399) | 4.2 (374 : 8495) *† | 26.1 (915 : 2588) *‡ | 74.6 (871 : 297) *† |
| Mortality (%) (n=dead : alive) | 9.8 (1344 : 12391) | 5.2*†(467 : 8981) | 15.2*‡ (536 : 2997) | 28.4†‡ (338 : 853) |
When the numbers entered in the table above are significantly different between different types of strokes, they are marked as follows:
*Significant difference between cerebral infarction and cerebral haemorrhage.
†Significant difference between subarachnoid haemorrhage and cerebral infarction.
‡Significant difference between cerebral haemorrhage and subarachnoid haemorrhage.JCS, Japan Coma Scale.
Temporal trends of characteristics of stroke patients, comparing groups A and B, are summarised in table 2 and HRs for death, comparing the two groups, are summarised in table 3. The characteristics of stroke patients in groups A and B are summarised in online supplementary table S3.
Table 2.
Temporal trends of characteristics of stroke patients, comparing groups A and B
| Group A | Group B | p Value | Difference/OR | |
|---|---|---|---|---|
| Age (mean±SD) | 70.5±12.7 | 72.3±13.0 | <0.001 | –1.85 (–2.28 to –1.41) * |
| Sex (% female) (n=female:male) | 44.8 (3531:4349) | 45.7 (2702:3206) | 0.505 | 1.02 (0.96 to 1.09) † |
| Systolic blood pressure (mean±SD) (mm Hg) | 161.5±31.6 | 161±31.5 | 0.449 | 0.41 (–0.66 to 1.49) * |
| Diastolic blood pressure (mean±SD) (mm Hg) | 87.3±18.7 | 88.0±19.0 | 0.036 | –0.69 (–1.33 to –0.05)* |
| Hypertension history (%) (n=with:without) | 60.2 (4379:2900) | 65.9 (3626:1880) | <0.001 | 1.27 (1.19 to 1.38) † |
| Arrhythmia (%) (n=with:without) | 14.9 (1132:6446) | 14.0 (800:4906) | 0.079 | 0.92 (0.83 to 1.01) † |
| Arrhythmia history (%) (n=with:without) | 19.0 (74.7) | 17.7 (974:4531) | 0.059 | 0.92 (0.84 to 1.00) † |
| Diabetes mellitus history (%) (n=with:without) | 20.5 (1500:5827) | 21.4 (1189:4371) | 0.327 | 1.04 (0.96 to 1.14) † |
| Hyperlipaemia history (%) (n=with:without) | 17.5 (1250:5910) | 21.4 (1169:4288) | <0.001 | 1.27 (1.16 to 1.39) † |
| Tobacco use (%) (n=with:without) | 33.6 (2152:4259) | 30.9 (1513:3383) | 0.001 | 0.88 (0.81 to 0.95) † |
| Alcohol use (%) (n=with:without) | 39.5 (2478:3797) | 36.1 (1724) | 0.002 | 0.89 (0.82 to 0.96) † |
| Paresis (%) (n=with:without) | 73.7 (5581:1987) | 72.7 (4087:1534) | 0.116 | 0.94 (0.87 to 1.02) † |
| Consciousness disturbance (%) (n=with:without) | 42.4 (3290:4463) | 45.0 (2624:3207) | 0.055 | 1.07 (1.00 to 1.14) † |
| Delay time (mean±SD) | 4.15±5.03 | 3.60±4.54 | <0.001 | −0.55 (−0.73 to −0.38)* |
| CT (%) (n) | 92.4 (7285) | 86.1 (5080) | <0.001 | 0.51 (0.45 to 0.57) † |
| MRI (%) (n) | 59.4 (4682) | 71.3 (4209) | <0.001 | 1.68 (1.56 to 1.80) † |
| Surgery (%) (n=with:without) | 17.6 (1356:6339) | 13.9 (815:5060) | <0.001 | 0.76 (0.69 to 0.83) † |
| Mortality (%) (n=dead:alive) | 9.5 (745:7097) | 10.2 (599:5294) | 0.771 | 1.02 (0.91 to 1.14) † |
*Mean difference (group A–group-B) with 95% confidence interval of the difference.
†Mantel-Haenszel common OR (group B/group A) with 95% confidence interval.
Table 3.
HRs for death, comparing groups A and B
| HR (group B/group A) | 95% Confidence interval |
p Value | ||
|---|---|---|---|---|
| Lower | Upper | |||
| Overall | 1.33 | 1.15 | 1.55 | <0.001 |
| Cerebral infarction | 1.33 | 1.04 | 1.70 | 0.021 |
| Cerebral haemorrhage | 1.06 | 0.83 | 1.34 | 0.650 |
| Subarachnoid haemorrhage | 1.25 | 0.92 | 1.70 | 0.147 |
Adjusted for age, sex, histories of hypertension, arrhythmia, diabetes mellitus and hyperlipaemia, and use of tobacco and/or alcohol.
ORs for the prevalence of risk factors among stroke subtypes, adjusted for age and sex, were calculated using a logistic regression model and are summarised in table 4.
Table 4.
ORs for the prevalence of risk factors among stroke subtypes, adjusted for age and sex
| OR | 95% Confidence interval |
p Value | ||
|---|---|---|---|---|
| Lower | Upper | |||
| History of hypertension | ||||
| CI | Reference | |||
| CH | 1.36 | 1.25 | 1.49 | <0.001 |
| SAH | 0.65 | 0.57 | 0.74 | <0.001 |
| History of arrhythmia | ||||
| CI | Reference | |||
| CH | 0.28 | 0.24 | 0.33 | <0.001 |
| SAH | 0.26 | 0.19 | 0.34 | <0.001 |
| History of diabetes mellitus | ||||
| CI | Reference | |||
| CH | 0.49 | 0.44 | 0.55 | <0.001 |
| SAH | 0.20 | 0.16 | 0.26 | <0.001 |
| History of hyperlipaemia | ||||
| CI | Reference | |||
| CH | 0.40 | 0.35 | 0.45 | <0.001 |
| SAH | 0.24 | 0.19 | 0.30 | <0.001 |
CH, cerebral haemorrhage; CI, Cerebral infarction; SAH, subarachnoid haemorrhage.
Table 1 also shows a history of hypertension in 12 785 (92.7%) patients, arrhythmia in 12 772 (92.6%), diabetes mellitus in 12 887 (93.5%), hyperlipaemia in 12 617 (91.5%), tobacco use in 11 307 (82%), alcohol use in 11 053 (80.2%) and paresis in 13 195 (96.7%). We were able to classify 13 406 (97.2%) patients into four consciousness levels, excluding 184 (1.3%) patients with uncategorised stroke and 580 (4.2%) patients with no reliable information on consciousness levels. Calculation of the mean delay time excluded 4964 (36%) patients with unknown onset. Patients received primary medical care within 3 h of onset in 54.3% of CI, 68.5% of CH and 76.4% of SAH.
Of 13 788 patients, 13 735(99.6%) had a confirmed record of survival or death 30 days after stroke onset. A total of 1344 (9.8%) patients died within this time period.
Figure 1 shows Kaplan-Meier Survival curves, comparing stroke subtypes, and reveals a significant difference (p<0.001) between any two subtypes by the log-rank test.
Figure 1.
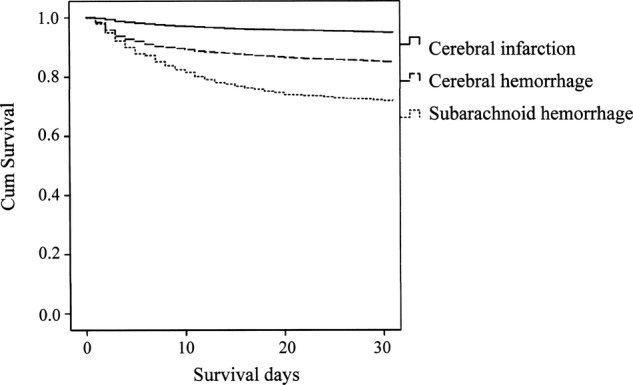
Kaplan-Meier survival curves of stroke patients.
Compared with CI, CH and SAH HRs for death were 3.66 (3.07 to 4.37, p<0.001) and 8.91 (7.18 to 11.06, p<0.001), when adjusted for age, sex, histories of hypertension, arrhythmia, diabetes mellitus and hyperlipaemia and use of tobacco and/or alcohol (table 5).
Table 5.
HRs for death, comparing stroke subtypes
| HR | 95% CI |
p Value | ||
|---|---|---|---|---|
| Lower | Upper | |||
| Cerebral infarction | Reference | |||
| Cerebral haemorrhage | 3.71 | 3.11 | 4.43 | <0.001 |
| Subarachnoid haemorrhage | 8.95 | 7.21 | 11.11 | <0.001 |
Adjusted for age, sex, histories of hypertension, arrhythmia, diabetes mellitus and hyperlipaemia and use of tobacco and/or alcohol
HRs for death, comparing stroke subtypes, in groups A and B are summarised in online supplementary table S4A,B.
Discussion
The study summarised the stroke registry covering the entire prefecture for 11 years. Hospitals affiliated to the Kyoto Medical Association registered new stroke patients based on inclusion and exclusion criteria in accordance with the Kyoto municipal ordinance, avoiding area or hospital preferences.
One of the major purposes of these prefectural stroke registries is to clarify the current situation concerning stroke events in order to maintain and improve healthcare. In Japan, healthcare systems largely depend on the prefectural governments, and information on each prefecture is therefore important. Japan has 47 prefectures. There are five stroke registries based on populations in the entire prefecture: the Akita Stroke Registry (ASR),12–15 the Iwate Stroke Registry (ISR),16 the Tochigi Stroke Registry (TSR),17 18 the Miyazaki Stroke Registry (MSR)19 and the KSR. Although each prefectural registry reports the result annually to the local government, to healthcare centres, and to the public, most are not available in the scientific English literature. We summarise incidence information based on the KSR in online supplementary tables S2A–C. The ASR has published age-adjusted, gender-specific incidence. Although we could not find age-adjusted, gender-specific incidence among the other prefectural stroke registries, the TSR and MSR have reported data on the numbers of patients they registered. We calculated age-adjusted, gender-specific incidence in the TSR and MSR based on their annual reports and summarise them in online supplementary tables S2D–I. The ISR says that their reports will soon be ready.20 All the prefectural registries ask as many hospitals and facilities as possible to register all stroke events. Registration, however, is not mandatory but depends on the voluntary contributions of the hospitals. Therefore, registries for more restricted areas may be better suited to clarify stroke incidence in a community. Takashima and Hisayama are two such areas. The incidence rates of stroke reported from the Takashima Stroke Registry21–24 and the Hisayama Study25–27 are higher than those from the prefectural stroke registries. The Hisayama study is reported to cover about 80% of the residents (aged 40 or over) of the area, which has a population of about 8400.28 Age-standardized incidence rate (per 10000 person-years) of stroke is 529 in men and 388 in women in the third cohort (1988-2000) of the Hisayama Study.25 The incidence ratios for men : women for the subtypes of stroke are 357 : 77 for CI, 130 : 21 for CH and 42 : 13 for SAH.25
The average annual mortality from CH is 3.9/1000 person-years of experience, whereas that from CI is 6.5 in the Hisayama population aged 40 and over.12 Some prefectural stroke registries report death rates. In the TSR, they were 10%, 16% and 29% in CI, CH and SAH, respectively.17 According to the ASR, the survival rates were 94%, 92%, 83%, 84%, 70% and 70% in CI-men, CI-women, CH-men, CH-women, SAH-men and SAH-women, respectively.14 15 These figures generally agree with the results for the KSR. The present study added age, sex, histories of hypertension, arrhythmia, diabetes, hyperlipaemia and use of tobacco and/or alcohol as adjusted HRs for death in each stroke subtype.
In the KSR, voluntary contributions have built up a registry of 14 268 stroke patients over a period of 11 years. Compared with the other prefectural registries, one of the outstanding strengths of the KSR is that it has information on survival up to 30 days after the onset in 13 735 patients out of the 13 788 patients in this cohort (99.6%). These data make it possible to analyse relationships between various factors and early mortality. The strength of the stroke registry in Japan is that it includes a large amount of CT and MRI data. Japan has the most MRI units (40 U/million population) and CT scanners (93 U/million population) among the developed countries.29 In the study cohort, 12 365 patients (89.7%) had a CT examination and 8891 patients (64.5%) had an MRI examination. The study added information on recent trends on the usage of these examinations. As expected, the usage of CT declined while the usage of MRI increased with time over the study period of 11 years.
In agreement with previous reports, CI had the highest incidence, followed by CH and SAH.26 The data add the information that SAH constitutes about a fourth of haemorrhagic strokes. The age distribution also confirms the result of previous reports, the oldest mean age being in CH and the youngest in SAH.30 The elderly patients showed a greater proportional difference in stroke subtypes. For example, in patients who were 71 years or older, the proportions were 73.1% CI (n=5616), 22.3% CH (n=1709) and 4.6% SAH (n=353), as compared with the younger group which showed 55.8% (n=3395), 30.3% (n=1840) and 13.9% (n=844).
Most of the other characteristics also showed significant differences among the three stroke subtypes. The overall registry had more male patients than female, except that almost two-thirds of the SAH cases were female. The initial medical examination revealed higher systolic and diastolic blood pressures in CH than in CI, possibly reflecting an intracranial mass effect on brain oedema.31 32
Patients with a disturbed consciousness had a higher (p<0.001) systolic/diastolic blood pressure (mean±SD 164.0±35.2/88.6±20.9) than the remainder (159.3±28.2/87.0±17.1), implying a possible association between stroke severity and the degree of hypertension.
The risk factors for stroke include hypertension,33 arrhythmia,34 diabetes mellitus,35 36 hyperlipaemia,37 alcohol use38 39 and tobacco use. Except for tobacco and alcohol use, these factors were noted most often in CI, followed by CH, and least in SAH. Hypertension probably plays the most important role since it was found in more than 60% of all stroke patients. A history of arrhythmia and diabetes mellitus, relatively high in CI and lower in CH, was rarely found in SAH. These data suggest a limited association between these three factors and haemorrhagic strokes. The Ministry of Health, Labour and Welfare of Japan has estimated the death rates of hypertension, diabetes mellitus and hyperlipaemia among Japanese aged from 40 to 74 at 49.9%, 11.4% and 17.7%, respectively. In our series, a history of hypertension exceeded this estimate in CI and CH. A history of diabetes mellitus was higher in CI and CH, but lower in SAH, suggesting that this may not be a risk factor in SAH. A history of hyperlipaemia was also lower in SAH than the death rate, also suggesting that this may not be a risk factor in SAH. These data may not add sufficient information on the effect of risk factors on stroke occurrence. The registry data are not meant to correlate factors with the risk of stroke. The registry data, however, are appropriate to determine the prevalence of different risk factors among stroke patients. The higher prevalence of any factor in a certain group may indicate a higher association between that factor and that group. This study added information on the prevalence of various risk factors among stroke patients and clarified differences among stroke subtypes. We also added multivariate analyses. Using a logistic regression model, we estimated ORs and 95% confidence intervals for the prevalence of these risk factors comparing each stroke subtype after adjusting for age and sex.
Alcohol and tobacco use showed a higher correlation with SAH than with the other types of stroke in a surveillance conducted under the same conditions for the three subtypes of stroke. Alcohol and tobacco use may therefore increase the risk of SAH more than the risk of CI or CH. The proportion of heavy smokers was not different among stroke subtypes, whereas the proportion of everyday drinkers was higher in haemorrhagic strokes than in ischaemic stroke. Paresis developed more often in CI and CH than in SAH. Haemorrhagic stroke caused more consciousness disturbance than ischaemic stroke did.
The characteristics significantly different between groups A and B were age, diastolic blood pressure, histories of hypertension and hyperlipaemia, tobacco and alcohol use, delay time and surgery. The HR for death in CI was significantly higher in group B than in group A after adjustment for age, sex, histories of risk factors and use of tobacco and alcohol. Although delay time is shorter in group B than in group A, there is no significant improvement in mortality.
We calculated mortality based on the information up to 30 days after stroke onset, excluding those who died later. Early mortality suggests stroke effects, whereas long-term mortality reflects the after-effects and complications. Thus, early mortality serves to evaluate the severity of the three major stroke subtypes. Death in the first month after a stroke mainly results from neurological causes such as brain oedema,40 followed by complications of immobility including pneumonia.41
The death rate of an ischaemic stroke and risk characteristics must vary by subtypes, such as an embolic stroke and a lacunar stroke. However, sufficient information to classify ischaemic stroke into more detailed categories was not available in this study. There are some resemblance and differences among prefectural stroke registries in various ways, such as age and sex distribution of strokes and annual monitoring rates of subtype in stroke. Although it is difficult to explain the differences sufficiently, factors which possibly influence the registries and stroke incidence include regional medical services, socioepidemiological factors, including industries and climates, prevalence of risk factors and constitution of societies. Prefectural stroke registries continue efforts to register as many stroke events as possible, which, however, is often difficult to accomplish. Nevertheless, since stroke incidence and characteristics may differ from area to area and from period to period, it is important to continue the registries in order to elucidate the current situation of the stroke and subsequently improve stroke care in each prefecture.
Limitations
First, there may be missing data for stroke patients; for example, patients who died before arriving in hospitals and patients who went to hospitals outside of the prefecture. Patients with mild symptoms may not have visited hospitals, and patients with atypical symptoms may not have been diagnosed as such, and consequently may not have been registered.5
Second, the study did not include the types of therapeutic interventions, which must have an effect on mortality. It is virtually impossible to adjust for all the treatments in a very large population-based study. Treatments should be studied in randomised controlled studies. The causes of death in the study cohort were also not investigated.
A possible bias exists in the assessment of variables, such as in the history of habits, which largely depends on the patients’ self-reports or information from their families. The problem, however, applied equally to all three subtypes. The study did show the overall characteristics and mortality in stroke and in major subtypes, which should shed light on the differences.
Lastly, the outcome assessment limited to 30 days after onset leaves the majority of patients (n=11 869, 86.1%) who survived the first month out of consideration. However, early mortality should reflect a cause of death directly associated with stroke and therefore correlate with severity in a direct way.
Conclusion
We have presented population-based data accrued over 11 years in the Kyoto prefecture in Japan. As for the major stroke subtypes, the HR for death was highest in SAH, followed by CH, and lowest in CI.
Supplementary Material
Acknowledgments
We acknowledge the contribution of participating institutions and their staff who provided the data in the Kyoto Stroke Registry. We would like to express special thanks to Dr Edith G. McGeer and Dr Jun Kimura for their help on our manuscript. We are grateful to Dr Satoru Fukinbara for statistical advice.
Footnotes
Contributors: All authors contributed equally in the data collection and analysis. KS wrote the manuscript. All authors read and approved the final manuscript.
Funding: This research received no specific grant from any funding agency in the public, commercial or not-for-profit sectors.
Competing interests: None.
Ethics approval: The Board of Directors, the Kyoto Medical Association, the Department of Health and Welfare, Kyoto Prefecture and Ethics Committee of the National Hospital Organization, Minami Kyoto Hospital.
Provenance and peer review: Not commissioned; externally peer reviewed.
Data sharing statement: There are no additional data available.
References
- 1.Turin TC, Kokubo Y, Murakami Y, et al. Lifetime risk of acute myocardial infarction in Japan. Circulation 2010;3:701–3 [DOI] [PubMed] [Google Scholar]
- 2.Scarborough P, Morgan RD, Webster P, et al. Differences in coronary heart disease, stroke and cancer mortality rates between England, Wales, Scotland and Northern Ireland: the role of diet and nutrition. BMJ Open 2011;1:e000263. [DOI] [PMC free article] [PubMed] [Google Scholar]
- 3.Lee S, Shafe AC, Cowie MR. UK stroke incidence, mortality and cardiovascular risk management 1999–2008: time-trend analysis from the General Practice Research Database. BMJ Open 2011;1:e000269. [DOI] [PMC free article] [PubMed] [Google Scholar]
- 4.Anderson GL, Whisnant JP. A comparison of trends in mortality from stroke in the United States and Rochester, Minnesota. Stroke 1982;13:804–9 [DOI] [PubMed] [Google Scholar]
- 5.Shigematsu K, Shimamura O, Nakano H, et al. Vomiting should be a prompt predictor of stroke outcome. Emerg Med Journal 2012. Published Online First 27 Sep 2012. doi: 10.1136/emermed-2012-201586 [DOI] [PubMed] [Google Scholar]
- 6.Hatano S. Experience from a multicentre stroke register: a preliminary report. Bull World Health Organ 1976;54:541–53 [PMC free article] [PubMed] [Google Scholar]
- 7. World Health Organization. Manual of the International Statistical Classification of Diseases, Injuries, and Causes of Death. Vol I. 9th revision. Geneva, Switzerland: World Health Organization; 1977. [Google Scholar]
- 8.Steindel SJ. International classification of diseases, 10th edition, clinical modification and procedure coding system: descriptive overview of the next generation HIPAA code sets. J Am Med Inform Assoc 2010;17:274–82 [DOI] [PMC free article] [PubMed] [Google Scholar]
- 9.Kuzuya T. [Outline of revision of classification and diagnostic criteria of diabetes mellitus in Japan]. Nihon rinsho 1999;57:561–6 [PubMed] [Google Scholar]
- 10.Ohta T, Waga S, Handa W, et al. [New grading of level of disordered consiousness (author's transl)]. No shinkei geka. Neurol Surg 1974;2:623–7 [PubMed] [Google Scholar]
- 11.Ohta T, Kikuchi H, Hashi K, et al. Nizofenone administration in the acute stage following subarachnoid hemorrhage. Results of a multi-center controlled double-blind clinical study. J Neurosurg 1986;64:420–6 [DOI] [PubMed] [Google Scholar]
- 12.Ueda K, Omae T, Hirota Y, et al. Decreasing trend in incidence and mortality from stroke in Hisayama residents, Japan. Stroke 1981;12:154–60 [DOI] [PubMed] [Google Scholar]
- 13.The Akita Stroke Registry. Secondary Akita Stroke Registry. http://www.msuisin.jp/blog/21nousochu.pdf (accessed 28 Feb 2013).
- 14.Suzuki K. Stroke recurrence. Treatment 2009;9:5–10 [Google Scholar]
- 15.Suzuki K. Epidemiology on recurrent stroke. Prev Atherosclerosis 2010;91:2560–4 [Google Scholar]
- 16.The Iwate Cancer and Stroke Registry. Secondary Iwate Cancer and Stroke Registry. http://www.iwate.med.or.jp/gan_nou/index.html (accessed 28 Feb 2013).
- 17.The Tochigi Stroke Registry. Secondary Tochigi Stroke Registry. http://www.pref.tochigi.lg.jp/e04/welfare/kenkoudukuri/kenkoudukuri/1173225926699.html (accessed 28 Feb 2013).
- 18.Welcome to the official homepage of Tochigi Prefecture, Japan. Secondary Welcome to the official homepage of Tochigi Prefecture, Japan. http://www.pref.tochigi.lg.jp/english/foreignlanguage.html#english (accessed 28 Feb 2013).
- 19.The Miyazaki Stroke Registry. Secondary Miyazaki Stroke Registry. 2010. http://www.msuisin.jp/blog/21nousochu.pdf (accessed 28 Feb 2013).
- 20.The Iwate Stroke Registry. Secondary Iwate Stroke Registry. http://www.pref.iwate.jp/~hp1353/hoken/toukei/nousottyu/index.html (accessed 28 Feb 2013). [Google Scholar]
- 21.Turin TC, Kita Y, Murakami Y, et al. Higher stroke incidence in the spring season regardless of conventional risk factors: Takashima Stroke Registry, Japan, 1988–2001. Stroke 2008;39:745–52 [DOI] [PubMed] [Google Scholar]
- 22.Turin TC, Kita Y, Murakami Y, et al. Increase of stroke incidence after weekend regardless of traditional risk factors: Takashima Stroke Registry, Japan; 1988–2003. Cerebrovasc Dis 2007;24:328–37 [DOI] [PubMed] [Google Scholar]
- 23.Kita Y, Turin TC, Rumana N, et al. Surveillance and measuring trends of stroke in Japan: the Takashima Stroke Registry (1988—present). Int J Stroke 2007;2:129–32 [DOI] [PubMed] [Google Scholar]
- 24.Turin TC, Kita Y, Rumana N, et al. Registration and surveillance of acute myocardial infarction in Japan: monitoring an entire community by the Takashima AMI Registry: system and design. Circ J 2007;71:1617–21 [DOI] [PubMed] [Google Scholar]
- 25.Kubo M, Kiyohara Y, Kato I, et al. Trends in the incidence, mortality, and survival rate of cardiovascular disease in a Japanese community: the Hisayama study. Stroke 2003;34:2349–54 [DOI] [PubMed] [Google Scholar]
- 26.Kiyohara Y, Kubo M, Kato I, et al. Ten-year prognosis of stroke and risk factors for death in a Japanese community: the Hisayama study. Stroke 2003;34:2343–7 [DOI] [PubMed] [Google Scholar]
- 27.Hata J, Tanizaki Y, Kiyohara Y, et al. Ten year recurrence after first ever stroke in a Japanese community: the Hisayama study. J Neurol, Neurosurg Psychiatry 2005;76:368–72 [DOI] [PMC free article] [PubMed] [Google Scholar]
- 28.Department of Environmental Medicine GSoMS, Kyushu University. About the Hisayama study. Secondary About the Hisayama study. http://www.med.kyushu-u.ac.jp/envmed/about/index.html (accessed 28 Feb 2013).
- 29.Turin TC, Kita Y, Rumana N, et al. Ischemic stroke subtypes in a Japanese population: Takashima Stroke Registry, 1988–2004. Stroke 2010;41:1871–6 [DOI] [PubMed] [Google Scholar]
- 30.Tanaka H, Ueda Y, Hayashi M, et al. Risk factors for cerebral hemorrhage and cerebral infarction in a Japanese rural community. Stroke 1982;13:62–73 [DOI] [PubMed] [Google Scholar]
- 31.Hacke W, Schwab S, Horn M, et al. ‘Malignant’ middle cerebral artery territory infarction: clinical course and prognostic signs. Arch Neurol 1996;53:309–15 [DOI] [PubMed] [Google Scholar]
- 32.Klatzo I. Brain oedema following brain ischaemia and the influence of therapy. Br J Anaesth 1985;57:18–22 [DOI] [PubMed] [Google Scholar]
- 33.Collins R, Peto R, MacMahon S, et al. Blood pressure, stroke, and coronary heart disease. Part 2, Short-term reductions in blood pressure: overview of randomised drug trials in their epidemiological context. Lancet 1990;335:827–38 [DOI] [PubMed] [Google Scholar]
- 34.Wolf PA, Abbott RD, Kannel WB. Atrial fibrillation as an independent risk factor for stroke: the Framingham Study. Stroke 1991;22:983–8 [DOI] [PubMed] [Google Scholar]
- 35.Abbott RD, Donahue RP, MacMahon SW, et al. Diabetes and the risk of stroke. The Honolulu Heart Program. JAMA 1987;257: 949–52 [PubMed] [Google Scholar]
- 36.Wolf PA, D'Agostino RB, Belanger AJ, et al. Probability of stroke: a risk profile from the Framingham Study. Stroke 1991;22:312–18 [DOI] [PubMed] [Google Scholar]
- 37.Iso H, Jacobs DR, Jr, Wentworth D, et al. Serum cholesterol levels and six-year mortality from stroke in 350,977 men screened for the multiple risk factor intervention trial. N Engl J Med 1989;320:904–10 [DOI] [PubMed] [Google Scholar]
- 38.Bazzano LA, Gu D, Reynolds K, et al. Alcohol consumption and risk for stroke among Chinese men. Ann Neurol 2007;62:569–78 [DOI] [PubMed] [Google Scholar]
- 39.Djousse L, Ellison RC, Beiser A, et al. Alcohol consumption and risk of ischemic stroke: the Framingham Study. Stroke 2002;33:907–12 [DOI] [PubMed] [Google Scholar]
- 40.Balami JS, Chen RL, Grunwald IQ, et al. Neurological complications of acute ischaemic stroke. Lancet Neurol 2011;10:357–71 [DOI] [PubMed] [Google Scholar]
- 41.Lavados PM, Sacks C, Prina L, et al. Incidence, 30-day case-fatality rate, and prognosis of stroke in Iquique, Chile: a 2-year community-based prospective study (PISCIS project). Lancet 2005;365:2206–15 [DOI] [PubMed] [Google Scholar]
Associated Data
This section collects any data citations, data availability statements, or supplementary materials included in this article.