Summary
Background
Evolution depends on mutations: rare errors in the transmission of genetic information. Experimentally, mutations have been found by detecting altered phenotypes or sequencing complete genomes, but most mutations do not have overt phenotypes, and sequencing is expensive and has limited time resolution. The major source of mutations is DNA replication errors. Nearly all mistakes in DNA replication are detected and repaired by the mismatch repair machinery.
Results
We use a functional, fluorescently labeled derivative of one of the key mismatch repair proteins (MutL) to see and count the small fraction of errors in Escherichia coli that does not get repaired and is converted into stable mutations by the next round of DNA replication. Over a 300-fold range, there is a linear relationship between the frequency of fluorescent foci and the genetically measured mutation frequency, and the mean frequency of fluorescent foci agrees well with estimates of the global mutation rate.
Conclusion
We describe a method for detecting the majority of genomic mutations emerging in living cells, independently of their potential phenotype. The distribution of emerging mutations per cell is roughly Poisson distributed, suggesting that all the cells in the population have roughly the same mutation rate.
Introduction
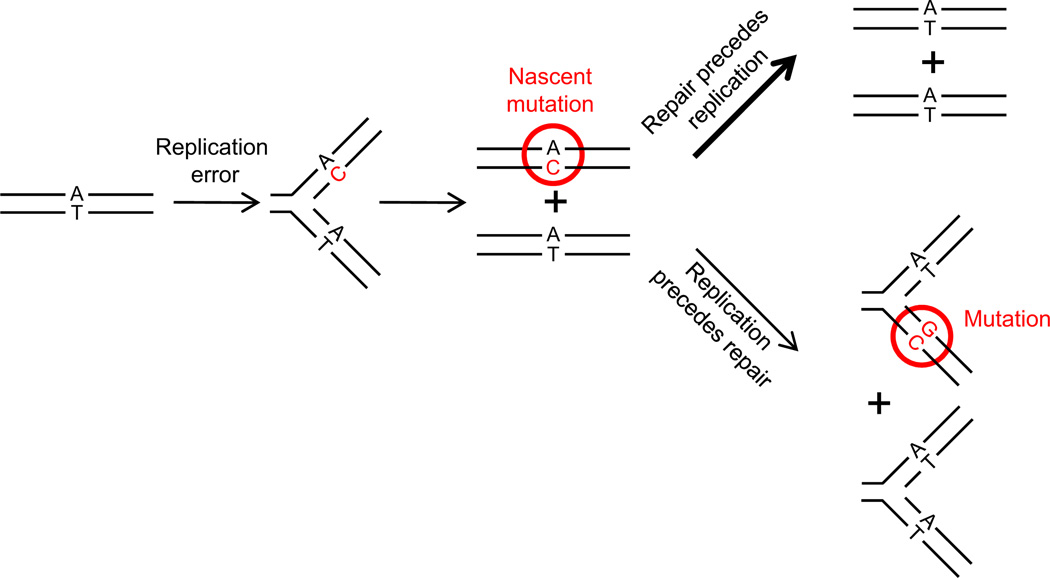
Mutations are the raw material of evolution and play important roles in cancer, AIDS, and other human diseases. Because mutations are rare, they are hard to detect, particularly as they emerge. For most of the history of genetics, mutations were inferred by comparing the phenotypes of different individuals, and determining how fast, and when, mutations occurred depended on the sort of statistical analysis pioneered by Luria and Delbruck [1]. More recently, genome sequencing has made it possible to discover all the mutations that separate two lineages [2, 3], but this approach is expensive and has limited ability to resolve when mutations occur. Here we exploit the cell’s own machinery for correcting mistakes in DNA replication to directly see the small fraction of mistakes that is not repaired and is converted into mutations by the next round of DNA synthesis (Figure 1). This method detects genomic mutations as they emerge in living cells independently of their potential phenotype.
Figure 1. Diagram Showing the Outcome of Repair or a Failure of Repair of DNA Replication Errors.
Parallel lines represent DNA strands. Replication error is C (in red) mispaired with A. Nascent mutation and fixed mutation are encircled in red.
The mismatch repair machinery is a strongly conserved group of proteins that detects and corrects errors in DNA replication [4, 5]. In all organisms endowed with mismatch repair, MutS binds to the sites of mistakes and recruits MutL. In enterobacteria, the MutL bound to mismatch-MutS complex recruits MutH, an endonuclease that cleaves the newly replicated DNA strand, triggering the removal of a segment of single-stranded DNA that contains the errant base. MutH can distinguish the two DNA strands because it recognizes the unmethylated adenine in the palindromic sequence GATC: the old strand is methylated, and the new strand remains unmethylated for several minutes after its synthesis. After the newly synthesized strand is methylated, MutH is unable to cleave either strand, and mistakes can no longer be corrected. Eukaryotes use homologs of MutS and MutL to correct errors in DNA replication, but they lack a homolog of MutH and do not use methylation to distinguish old and new DNA strands [4, 5].
How uniform is the mutation rate within a population of genetically identical cells [6]? This question has important implications for evolution and medicine but is beyond the reach of previous methods for measuring mutation rates, which used populations rather than individual cells [7]. We have removed this limitation by studying the localization of functional, fluorescently labeled derivatives of mismatch repair proteins. In wild-type cells, a small fraction of the cells contains fluorescent focus formed by the accumulation of MutL, and the number of cells with focus, as well as the number of foci per cell, rises dramatically as mismatch repair is compromised, with the number of foci corresponding to the mutation rates of the different strains. In strains with high mutation rates, the number of foci per cell is a close match to the Poisson distribution that we would expect if most of the cells in the population had the same mutation rate. We discuss how our method can be extended to measure mutation rates in eukaryotes.
Results
MutL Foci Represent Nascent Mutations
Three processes could recruit mismatch repair proteins to a region of the E. coli chromosome: (1) association with a replication error that was destined to be repaired, (2) association with an error that will not be repaired, and (3) other processes that are unrelated to errors in DNA synthesis, such as homologous recombination between nonidentical DNA sequences. These possibilities can be distinguished by fluorescently labeling components of the mismatch repair machinery, looking at cells that have different mutation rates, and correlating the number of foci of labeled proteins with the frequency of mutant colonies in different strains. If foci persist for the same time on mistakes that will and will not be repaired, the number of foci will depend only on the rate at which DNA polymerase makes mistakes and will be independent of the fraction of these errors that is corrected. If mistakes that are repaired never recruit enough mismatch repair protein or last long enough to be detected as discrete foci, the only visible mistakes will be those that are not corrected, and thus the number of foci will depend both on the fraction of mistakes that is corrected and the rate at which DNA polymerase makes errors. Finally, if the mismatch repair proteins are being recruited to other DNA configurations, e.g., recombination intermediates, the number of foci should be uncorrelated with either the accuracy of DNA polymerase or the efficiency of repair.
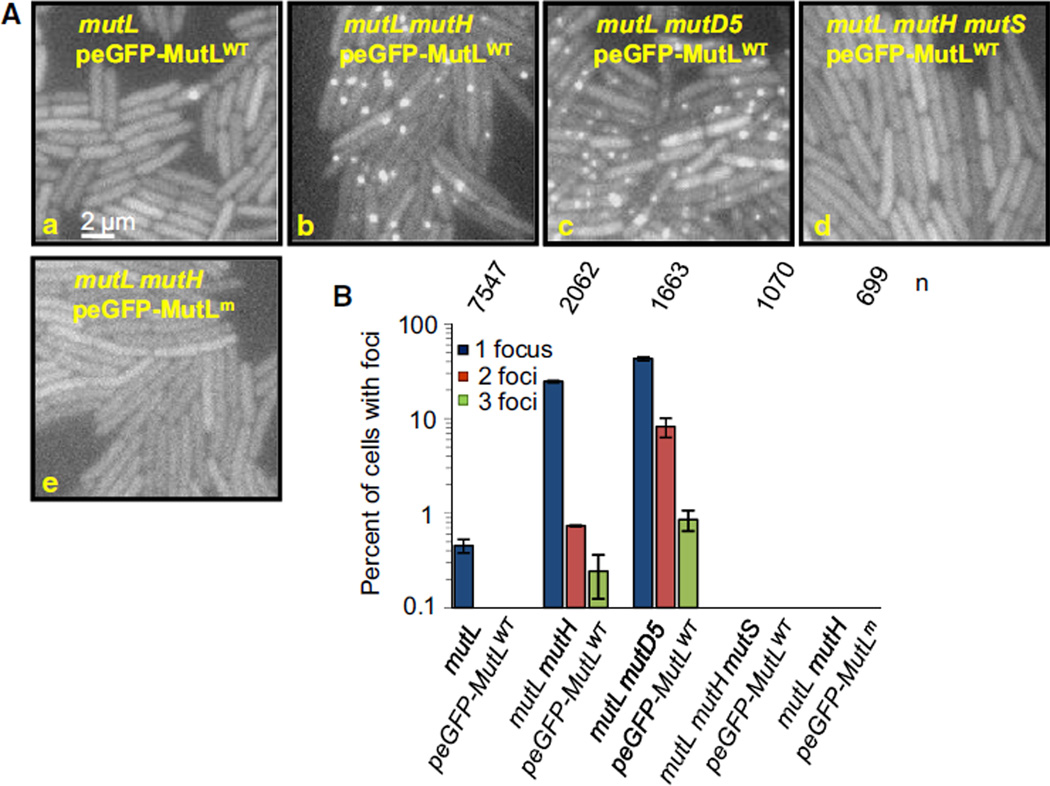
To distinguish these hypotheses, we produced fluorescently labeled mismatch repair proteins. Our eGFP-labeled versions of MutL and MutS retain their normal function, as judged by measuring the frequency of rifampicin-resistant mutants in the strains that carried only the labeled derivatives (see Table S1 available online). Biochemical and in vivo experiments suggest that a single mismatch may lead to the recruitment of many copies of the MutL and MutS, thus allowing us to detect the presence of a single mismatch in a cell by fluorescent microscopy [8, 9]. We found that fluorescent MutS and MutL form foci in a subset of cells. Although MutS shows some mismatch-independent foci (detected with mismatch binding-defective MutSF36A mutant [10]; data not shown), two lines of evidence suggest that all MutL foci are at mismatch sites: all eGFP-MutL foci are abolished by (1) eliminating MutS and (2) replacing wild-type MutL with MutL-K159E, a mutant deficient for DNA binding and ATP hydrolysis [10] (Figures 2Ad, 2Ae, and 2B). We therefore used only eGFP-MutL for this study.
Figure 2. eGFP-MutLWT Foci in Cells Exhibiting Different Mutation Rates.
(Aa–Ae) Fluorescent images of mutL (Aa), mutL mutH (Ab), mutL mutD5 (Ac), mutL mutH mutS strains producing eGFP-MutLWT (Ad), and mutL mutH strain producing eGFP-MutLm (MutLK159E) (Ae), all grown to early exponential phase in minimal medium.
(B) The percentage of cells with at least one eGFP-MutLWT focus from (A). Error bars indicate standard error of the mean. n indicates the number of cells examined. See also Table S1 and Figure S1.
Chromosomally mutL cells that express eGFP-MutL from plasmid show very rare focus, with 0.45% of the cells growing in minimal medium containing a single focus (Figures 2Aa and 2B). Eliminating MutH, the endonuclease that initiates the removal of the incorrect base, increases the fraction of cells with at least one focus to 24.9% (Figures 2Ab and 2B). The number of MutL foci in mutH cells is not dependent on the cellular amount of eGFP-MutL (Figure S1). Elimination of the proofreading activity of the replicative DNA polymerase (the mutD5 mutant) increases this fraction still further to 52% (Figures 2Ac and 2B). Thus, the number of eGFP-MutL foci depends on three things: the frequency of errors in DNA replication, the efficiency with which these errors are repaired, and the integrity of MutS and MutL.
These results are inconsistent with the two models: (1) a source of foci that is unconnected to errors in DNA replication and (2) a model in which the foci are equally likely to come from errors destined to be repaired and those that are not. The results are consistent with the hypothesis that the foci only become bright enough and persistent enough to detect errors that are not going to be repaired. This hypothesis makes two further predictions: (1) the foci should disappear when a mismatched base pair is replicated to produce one duplex that has entirely wild-type information and one duplex that has entirely mutant information (Figure 1), and (2) the frequency of foci should be equal to the mutation rate.
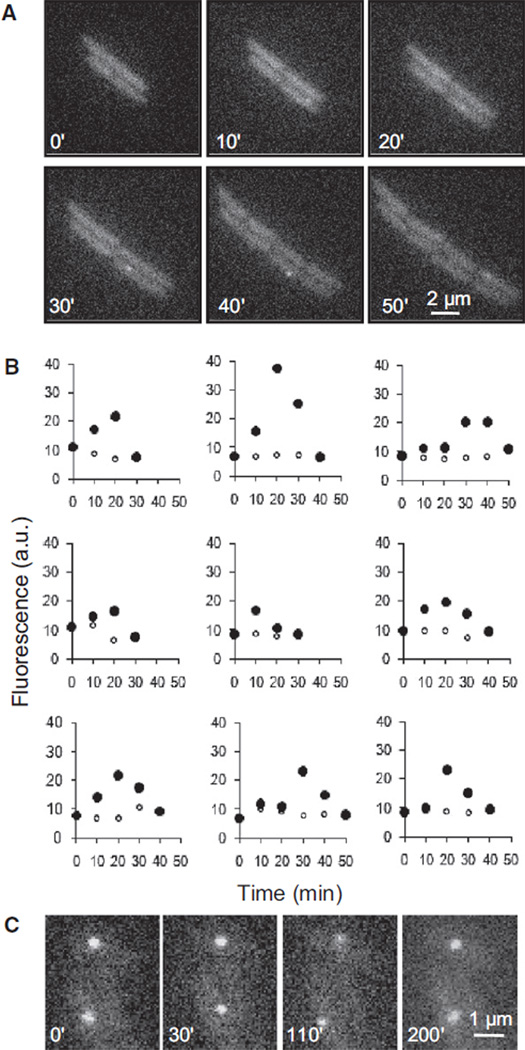
We tested the first prediction by following the fate of the eGFP-MutL foci in individual mutH cells. Figure 3A shows images from the growth of a single microcolony: a fluorescent focus becomes visible in one cell at 10 min and then disappears between 40 and 50 min. Figure 3B traces the intensity of nine individual eGFP-MutL foci through time. Foci were brighter than the background for 20 to 40 min. If a focus formed shortly after the passage of the replication fork that made the initial mistake and disappeared after the next fork replicated the mismatched DNA, the foci should persist for 40 min, which is the doubling time of the cells under the microscope and represents the time between the passage of successive replication forks. If the foci disappear because the mismatch is replicated, preventing the next round of replication will stop the focus from disappearing. This is precisely what we see: using rifampicin treatment to prevent the next round of DNA replication allows the foci to persist for at least 200 min (Figure 3C).
Figure 3. Lifetime of eGFP-MutLWT Foci.
(A and B) Dynamics of eGFP-MutLWT foci appearing and disappearing during growth. mutL mutH cells producing eGFP-MutLWT were grown in minimal medium to early exponential phase, plated on a slide with agarose supplemented with minimal medium, and examined by time-lapse microscopy.
(A) Representative examples of the consecutive fluorescent images of the same microcolony after 0, 10, 20, 30, 40, and 50 min of growth.
(B) Evolution of the fluorescence for nine individual foci in the course of time (●) and evolution of cell background fluorescence through time (○). Time 0 represents the fluorescence of the same cell, and the same cell area, 10 min prior to the time of initial focus detection. a.u. denotes arbitrary units. (C) Persisting eGFP-MutLWT foci in rifampicin-treated cells. Rifampicin (200 µg/ml) was added to an early exponential phase culture of mutL mutH cells producing eGFP-MutLWT grown in minimal medium, and incubation continued for 15 min. The cells were concentrated and plated on the slide with agarose supplemented by minimal medium and rifampicin. Representative examples of fluorescent images taken at 0, 30, 110, and 200 min are shown. Time 0 corresponds to 30 min postincubation with rifampicin.
The second and most important prediction is that the focus frequency should correspond to the mutation rate. There are caveats to this prediction. Some types of replication errors, such as C:C mismatches, are not recognized by the mismatch repair machinery [11, 12]. Fortunately, the rate at which DNA polymerases make these errors is much lower than the rate of errors that is recognized by the repair machinery [13]. Additionally, it has been suggested that in some incipient mismatches in E. coli [14], the templating base, instead of the mutant base, may be repaired and replaced in the newly synthesized strand. If this occurs as rapidly as correct mismatch repair, then such mutations will not be visualized by our method.
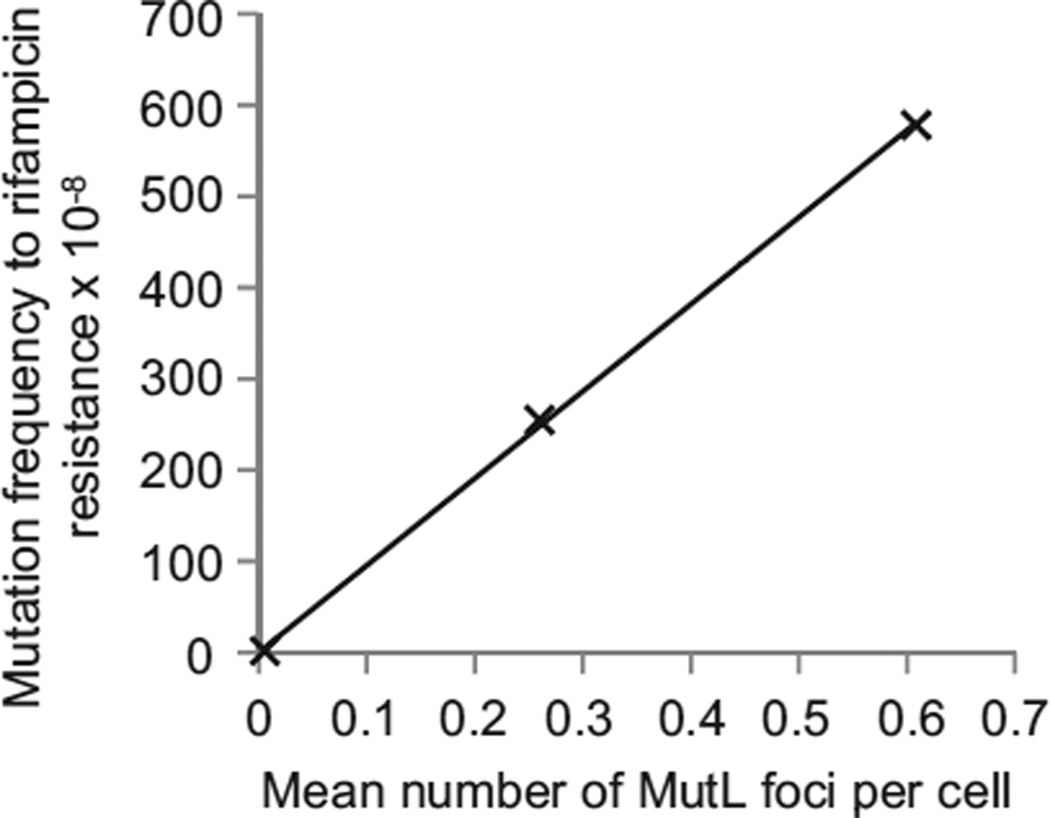
We tested the prediction that the frequency of MutL foci represents an accurate estimation of the genomic mutation rate. We established the correlations between the frequency of eGFP-MutL foci and two measurements that reflect the cellular mutation rate: the frequency of rifampicin-resistant colonies and estimates of the genome-wide mutation rate [15]. We measured the frequency of rifampicin-resistant colonies and the frequency of eGFP-MutL foci in phenotypically wild-type, mutH, and mutD5 cells in minimal medium. Rifampicin resistance is a result of point mutations, small deletions, or small insertions in the rpoB gene [16]. Figure 4 shows that the number of eGFP-MutL foci is linearly related (R2 = 0.999) to the frequency of rifampicin-resistant colonies (Table S4). This excludes the possibility that above-mentioned problems preclude the precise estimation of mutation rate by our method.
Figure 4. Number of eGFP-MutL Foci Is Linearly Related to the Mutation Frequency.
The plot shows the correlation between eGFP-MutL focus frequency and frequency of colonies that contain spontaneous mutations to rifampicin resistance (R2 = 0.999) for three strains with different mutation rates: mutL, mutL mutH, and mutL mutD5, all expressing eGFP-MutLWT. Assuming 2.0 genomes per cell and a target size of 69 different point mutations that can lead to rifampicin resistance, we calculate that MutL focus corresponds to a probability of 69/(2.0 × 3 × 4.5 × 106) = 2.5 × 10⁻⁶ of observing a mutation to rifampicin resistance in one of the cell’s descendants. We observe that each focus corresponds to a probability of obtaining a rifampicin-resistant colony of 8.2 × 10⁻⁶; this discrepancy is in the expected direction because we measured the frequency of mutant cells, rather than the mutation rate, and mutations that arise earlier in the culture give rise to more mutant colonies than those that arise later [1]. See also Table S4.
Next, we tested the agreement between the frequency of foci and estimates of the average mutation rate per base pair, which range from 4.1 × 10⁻¹⁰ to 6.9 × 10⁻¹⁰ [15, 17]. We see foci in 0.57% of wild-type cells grown in minimal medium. We calculate that an exponentially growing population of cells has mean genome number of 2.0 by using the measured doubling time of the population (40 min) and three assumptions: (1) it takes 40 min for the forks to get from the origin to the terminus, (2) there is a 20 min interval between the termination of replication and cell division, and (3) the age distribution for exponentially growing cells is N(x) = 2(1 − x), where N is the number of cells of age x and x varies from 0 (newly born cells) to 1 (cells about to divide). Using this value and the frequency of foci, we calculate the overall mutation rate as the focus frequency (0.0057) divided by the product of the mean genome number cell (2.0) and the length of the genome (4.5 × 10⁶), giving a value of 6.3 × 10⁻¹⁰ bp/cell/generation. This number falls within other estimates of the genomic mutation rate and suggests that we are measuring the occurrence of base pair mismatches that the next round of replication will convert into stable mutations. Because both our and others’ calculations of the genomic mutation rate involve assumptions, we cannot exclude the possibility that we fail to detect all the lesions that are going to be converted into mutations.
The Mutation Rate in the Population Is Roughly Uniform
Genetically identical cells need not behave identically even when they share the same environment [18–20]. This raises the possibility that the mutation rate is nonuniform in a population of cells. In principle, this possibility can be investigated by asking whether the frequency of double mutations is greater than half the square of frequency of single mutations. In practice, spontaneous double mutations are so rare that this question has proved impossible to address.
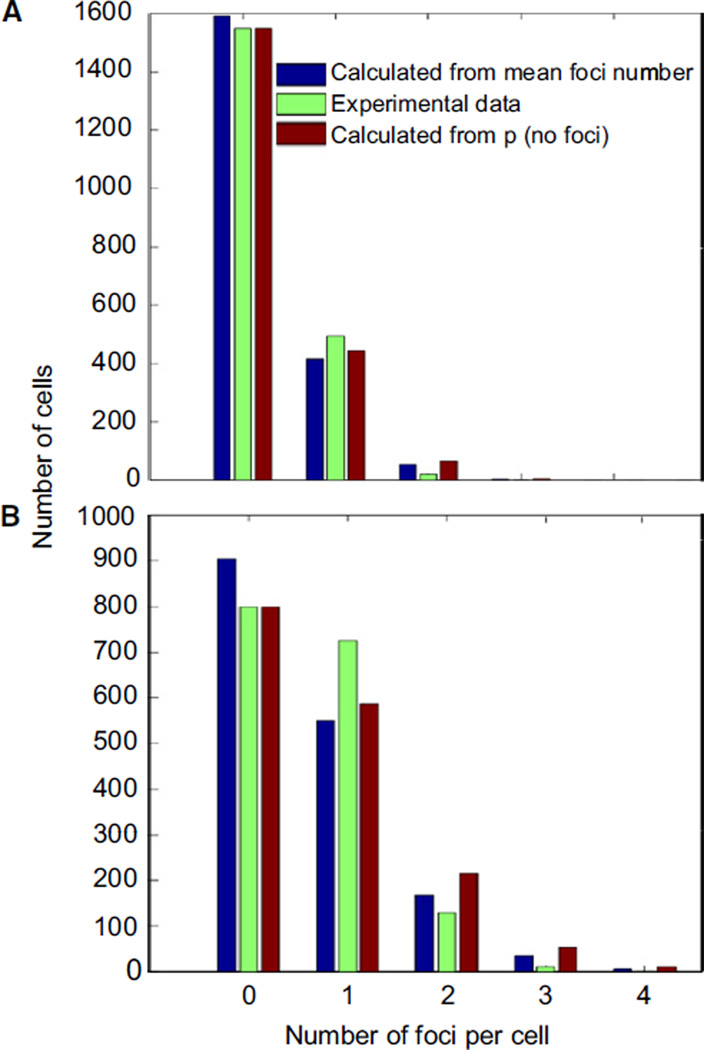
Our method allows us to interrogate the entire genome of many cells for the presence of mutations. If all the cells in the population have the same mutation rate, the number of eGFP-MutL foci per cell will follow a Poisson distribution. In chromosomally mutL cells that express eGFP-MutL from plasmid, less than 1% of the cells has a focus, suggesting that less than 0.01% of them should have two foci, a frequency that is difficult to accurately measure. In cells that lack MutH or have an error-prone DNA polymerase, the mutation frequency is higher, and we see cells with up to three distinct foci. We can use the mean focus frequency of mutations to predict the distribution of cells with 0 to ≥3 foci if the mutation rate were uniform across the population of cells. Under these conditions, the number of foci per cell should follow a Poisson distribution. Figure 5 shows the actual distribution of the number of foci for mutH and mutD5 cells compared with two different Poisson distributions, one calculated from the measured mean number of foci per cell and the other calculated from the fraction of cells that has no focus, on the assumption that the foci show a Poisson distribution. The actual number of foci is close to the two calculated distributions, although there is a slight excess of cells with one focus, compared to the predictions, and a deficit of cells with two or more foci.
Figure 5. Mutation Rate in the Population Is Roughly Uniform.
(A and B) The plot shows the observed and calculated frequency of cells with a different number of foci for mutL mutH strain expressing eGFP-MutLWT (A) and mutL mutD5 strain expressing eGFP-MutLWT (B). The expected number of foci was calculated according to the Poisson distribution based on two different estimates of the mean number of foci per cell: (1) directly calculating the mean number of foci from the different frequency classes, which may be a slight underestimate, because if two foci are close together in the cell, they cannot be resolved from each other, and (2) using the frequency of cells that have no focus and the relationship p(no focus) = e−m, where m is the mean number of foci per cell.
Discussion
We have used the cell’s own mismatch repair machinery to detect the minority of errors that escapes repair and will produce mutations, because the errors get replicated before they can be repaired. We suggest that this apparent paradox arises because of a race between two processes: cleavage of the newly replicated strand that contains the misincorporated base by MutH and methylation of the GATC motifs on the newly synthesized strand by the Dam methylase. If MutH wins, the mismatch is removed, and accurate DNA repair prevents mutation. If Dam wins, both old and new strands are methylated near the site of the mismatch, precluding MutH cleavage, the mismatch persists, and the next round of replication converts it into a mutation.
We can estimate how often MutH wins this race by comparing the frequency of eGFP-MutL foci in chromosomally mutL cells that express eGFP-MutL from plasmid and chromosomally mutL mutH cells expressing eGFP-MutL. This comparison suggests that more than 99% of the time, MutH wins the race, a stretch of the newly synthesized DNA is degraded, and MutH rapidly disappears from the DNA. This result is coherent with previous genetic studies on mismatch repair effect on replication fidelity [21]. If we assume that cells take 5 min to methylate newly synthesized DNA and that the time taken for MutH to cleave DNA near mismatches is exponentially distributed, the mean time that a MutL focus would be associated with a mismatch destined to be successfully repaired would be <70 s, assuming that MutS and MutL detect mismatches and become microscopically visible as soon as the DNA has replicated. We suspect that most mismatches do not recruit enough MutL molecules to become microscopically visible before they are repaired. Only unrepaired mismatches, either because of the absence of MutH protein or because of the “premature” methylation of GATC sequence by Dam methylase that prevents GATC cutting, allow accumulation of enough fluorescent MutL proteins to be detected as fluorescent foci.
We present two pieces of evidence that support the idea that the eGFP-MutL foci we see represent nascent mutations. The first is that the ratio between the mean number of foci per cell and the frequency of rifampicin-resistant colonies is constant for three different genotypes whose relative mutation rate varies by a factor of 300. The second is the quantitative agreement between the number of foci and estimates of the genome-wide mutation rate.
We used our method to address the long-standing puzzle of whether mutation rates are uniform within a population. The distribution of cells with a different number of MutL foci is a close match to a Poisson distribution. This observation rules out the possibility of any pronounced nonuniformity in the mutation rate within a growing population of E. coli. There are two important caveats to this conclusion. First, we detect two nascent mutations by seeing two foci. If two mutations lie close together in space, even if they recruit eGFP-MutL independently, the two foci cannot be resolved by light microscopy. Thus, we cannot rule out the possibility that there is local clustering of mutations. Second, because we analyze only cells with high mutation rates, our conclusion of uniformity of mutation rates holds for most cells with high mutation rates. We cannot rule out, for example, that a subpopulation in wild-type cells can become transiently mismatch repair-defective as a result of, for example, stochastic fluctuations of a limiting component.
The ability to see mutations as they happen opens many possibilities. In bacteria, these include the vexed question of whether a subpopulation of cells elevates its mutation rate as cultures enter stationary phase [22] and the comparison of the mutation rate in species that do and do not use the preferential methylation of older DNA strands to direct mismatch repair. Previous attempts to visualize mismatch repair were made in Bacillus subtilis [8], but the relationship between the frequency of MutL foci and the genomic mutation rate was difficult to assess because this study was done with nonfunctional fluorescent MutL. Because the mismatch repair machinery is conserved, it should also be possible to see nascent mutations in eukaryotes. This would open up many important possibilities, such as investigating the elevation of the mutation rate in meiosis [23], comparing the rate of mutation in soma and germline, and investigating the uniformity of mutation rates within populations of tumor cells.
Experimental Procedures
Strain Construction
The construction of egfp fusions to wild-type and mutant mutL and mutS genes expressed from T7 RNA polymerase promoter on pET-32a type plasmid is described in the Supplemental Experimental Procedures. Plasmids were transformed into the strains deleted for the chromosomal mutL or mutS gene to avoid dilution of the fluorescent MutL or MutS proteins by the nonfluorescent native MutL or MutS, respectively. The T7 phage RNA polymerase-encoding gene was inserted into the chromosome under the control of an arabinose-inducible promoter.
Growth Conditions
Cells were cultivated in minimal medium supplemented by 0.2% casamino acids and ampicillin (100 µg/ml). For microscopy, cells from exponentially growing cultures were inoculated onto a solid matrix of minimal medium agarose in microscope cavity slides, as previously described [24].
Live Cell Imaging and Image Analysis
Cells were visualized with a 100 objective on an Axiovert 200 inverted microscope (Carl Zeiss) equipped with a Photometrics CoolSNAP camera (Princeton Instruments) and a temperature-controlled incubation chamber. Images were taken and analyzed by MetaMorph software. Focus fluorescence was calculated by subtracting the background fluorescence of the cell from the maximal pixel intensity of the focus.
Statistics
We used the observed frequency of cells with a different number of foci to calculate two predictions for the foci distribution we would expect if the mutation rate were uniform within the population. The first uses the observed mean number of foci per cell, and the second assumes that the mutations are Poisson distributed and uses the fraction of cells with no foci to calculatem, the mean number of foci per cell according to the formula p(0) = e−m.
Supplementary Material
Acknowledgments
We thank Martin Marinus and Wei Yang for kindly providing bacterial strains and plasmids as indicated. We also acknowledge Lydia Robert and Alex Dajkovic for critical reading of the manuscript. M.E. was supported by the University of Paris-Descartes and by Inserm U 1001 laboratory funds.
Footnotes
Supplemental Information
Supplemental Information includes Supplemental Experimental Procedures, one figure, and four tables and can be found with this article online at doi:10.1016/j.cub.2010.06.071.
References
- 1.Luria SE, Delbrück M. Mutations of bacteria from virus sensitivity to virus resistance. Genetics. 1943;28:491–511. doi: 10.1093/genetics/28.6.491. [DOI] [PMC free article] [PubMed] [Google Scholar]
- 2.Denver DR, Dolan PC, Wilhelm LJ, Sung W, Lucas-Lledó JI, Howe DK, Lewis SC, Okamoto K, Thomas WK, Lynch M, Baer CF. A genome-wide view of Caenorhabditis elegans base-substitution mutation processes. Proc. Natl. Acad. Sci. USA. 2009;106:16310–16314. doi: 10.1073/pnas.0904895106. [DOI] [PMC free article] [PubMed] [Google Scholar]
- 3.Haag-Liautard C, Dorris M, Maside X, Macaskill S, Halligan DL, Houle D, Charlesworth B, Keightley PD. Direct estimation of per nucleotide and genomic deleterious mutation rates in Drosophila. Nature. 2007;445:82–85. doi: 10.1038/nature05388. [DOI] [PubMed] [Google Scholar]
- 4.Hsieh P, Yamane K. DNA mismatch repair: Molecular mechanism, cancer, and ageing. Mech. Ageing Dev. 2008;129:391–407. doi: 10.1016/j.mad.2008.02.012. [DOI] [PMC free article] [PubMed] [Google Scholar]
- 5.Kunkel TA, Erie DA. DNA mismatch repair. Annu. Rev. Biochem. 2005;74:681–710. doi: 10.1146/annurev.biochem.74.082803.133243. [DOI] [PubMed] [Google Scholar]
- 6.Ninio J. Transient mutators: A semiquantitative analysis of the influence of translation and transcription errors on mutation rates. Genetics. 1991;129:957–962. doi: 10.1093/genetics/129.3.957. [DOI] [PMC free article] [PubMed] [Google Scholar]
- 7.Drake JW. Too many mutants with multiple mutations. Crit. Rev. Biochem. Mol. Biol. 2007;42:247–258. doi: 10.1080/10409230701495631. [DOI] [PMC free article] [PubMed] [Google Scholar]
- 8.Smith BT, Grossman AD, Walker GC. Visualization of mismatch repair in bacterial cells. Mol. Cell. 2001;8:1197–1206. doi: 10.1016/s1097-2765(01)00402-6. [DOI] [PubMed] [Google Scholar]
- 9.Acharya S, Foster PL, Brooks P, Fishel R. The coordinated functions of the E. coli MutS and MutL proteins in mismatch repair. Mol. Cell. 2003;12:233–246. doi: 10.1016/s1097-2765(03)00219-3. [DOI] [PubMed] [Google Scholar]
- 10.Junop MS, Yang W, Funchain P, Clendenin W, Miller JH. In vitro and in vivo studies of MutS, MutL and MutH mutants: Correlation of mismatch repair and DNA recombination. DNA Repair (Amst.) 2003;2:387–405. doi: 10.1016/s1568-7864(02)00245-8. [DOI] [PubMed] [Google Scholar]
- 11.Dohet C, Wagner R, Radman M. Repair of defined single base-pair mismatches in Escherichia coli. Proc. Natl. Acad. Sci. USA. 1985;82:503–505. doi: 10.1073/pnas.82.2.503. [DOI] [PMC free article] [PubMed] [Google Scholar]
- 12.Su SS, Lahue RS, Au KG, Modrich P. Mispair specificity of methyl-directed DNA mismatch correction in vitro. J. Biol. Chem. 1988;263:6829–6835. [PubMed] [Google Scholar]
- 13.Mendelman LV, Boosalis MS, Petruska J, Goodman MF. Nearest neighbor influences on DNA polymerase insertion fidelity. J. Biol. Chem. 1989;264:14415–14423. [PubMed] [Google Scholar]
- 14.Witkin EM, Sicurella NA. Pure clones of lactose-negative mutants obtained In Escherichia coli after treatment with 5-Bromouracil. J. Mol. Biol. 1964;8:610–613. doi: 10.1016/s0022-2836(64)80017-6. [DOI] [PubMed] [Google Scholar]
- 15.Drake JW. A constant rate of spontaneous mutation in DNA-based microbes. Proc. Natl. Acad. Sci. USA. 1991;88:7160–7164. doi: 10.1073/pnas.88.16.7160. [DOI] [PMC free article] [PubMed] [Google Scholar]
- 16.Garibyan L, Huang T, Kim M, Wolff E, Nguyen A, Nguyen T, Diep A, Hu K, Iverson A, Yang H, Miller JH. Use of the rpoB gene to determine the specificity of base substitution mutations on the Escherichia coli chromosome. DNA Repair (Amst.) 2003;2:593–608. doi: 10.1016/s1568-7864(03)00024-7. [DOI] [PubMed] [Google Scholar]
- 17.Drake JW, Charlesworth B, Charlesworth D, Crow JF. Rates of spontaneous mutation. Genetics. 1998;148:1667–1686. doi: 10.1093/genetics/148.4.1667. [DOI] [PMC free article] [PubMed] [Google Scholar]
- 18.Novick A, Weiner M. Enzyme induction as an all-or-none phenomenon. Proc. Natl. Acad. Sci. USA. 1957;43:553–566. doi: 10.1073/pnas.43.7.553. [DOI] [PMC free article] [PubMed] [Google Scholar]
- 19.Kaern M, Elston TC, Blake WJ, Collins JJ. Stochasticity in gene expression: From theories to phenotypes. Nat. Rev. Genet. 2005;6:451–464. doi: 10.1038/nrg1615. [DOI] [PubMed] [Google Scholar]
- 20.Losick R, Desplan C. Stochasticity and cell fate. Science. 2008;320:65–68. doi: 10.1126/science.1147888. [DOI] [PMC free article] [PubMed] [Google Scholar]
- 21.Glickman BW, Radman M. Escherichia coli mutator mutants deficient in methylation-instructed DNA mismatch correction. Proc. Natl. Acad. Sci. USA. 1980;77:1063–1067. doi: 10.1073/pnas.77.2.1063. [DOI] [PMC free article] [PubMed] [Google Scholar]
- 22.Galhardo RS, Hastings PJ, Rosenberg SM. Mutation as a stress response and the regulation of evolvability. Crit. Rev. Biochem. Mol. Biol. 2007;42:399–435. doi: 10.1080/10409230701648502. [DOI] [PMC free article] [PubMed] [Google Scholar]
- 23.Magni GE, Von Borstel RC. Different rates of spontaneous mutation during mitosis and meiosis in yeast. Genetics. 1962;47:1097–1108. doi: 10.1093/genetics/47.8.1097. [DOI] [PMC free article] [PubMed] [Google Scholar]
- 24.Stewart EJ, Madden R, Paul G, Taddei F. Aging and death in an organism that reproduces by morphologically symmetric division. PLoS Biol. 2005;3:e45. doi: 10.1371/journal.pbio.0030045. [DOI] [PMC free article] [PubMed] [Google Scholar]
Associated Data
This section collects any data citations, data availability statements, or supplementary materials included in this article.


