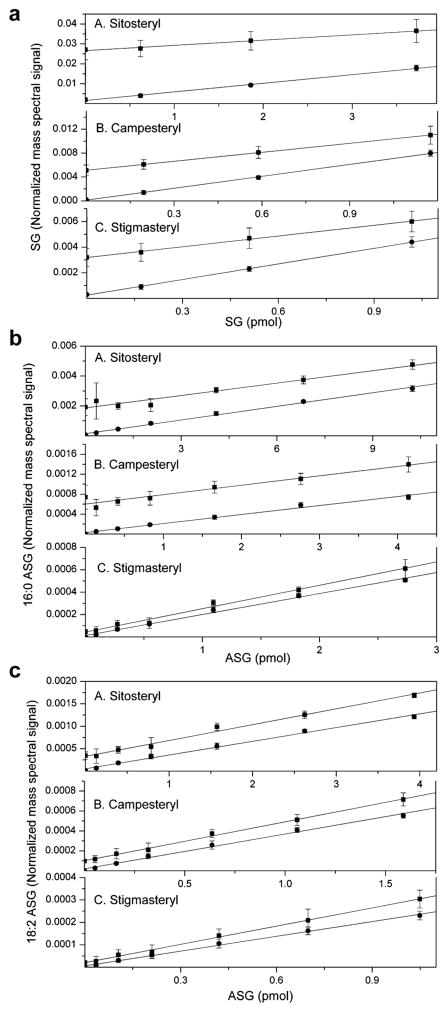
Figure 4.
Spike-in experiments indicate linear responses in mass spectral signals from ESI-MS/MS analysis of SGs and ASGs. Normalized mass spectral signals are shown for compounds from Arabidopsis seeds of wild-type (squares) and the ugt80A2,B1 mutant (circles) for (a) SGs, (b) 16:0 ASGs, and (c) 18:2 ASGs in three panels from top to bottom. Each panel is further sub-divided to indicate quantification of (A) sitosteryl, (B) campesteryl, and (C) stigmasteryl SGs, 16:0 ASGs or 18:2 ASGs, respectively. A normalized signal of 1.0 for SGs and ASGs is the same amount of signal as the average signal produced by 1.0 nmol of the internal standards, di12:0 and di20:0 PtdGro. Error bars represent standard deviations (sd) for n = 5 biological replicates.

