

Abstract
Background
EHR clinical document synthesis by clinicians may be time-consuming and error-prone due to the complex organization of narratives, excessive redundancy within documents, and, at times, inadvertent proliferation of data inconsistencies. Development of EHR systems that are easily adaptable to the user’s work processes requires research into visualization techniques that can optimize information synthesis at the point of care.
Objective
To evaluate the effect of a prototype visualization tool for clinically relevant new information on clinicians’ synthesis of EHR clinical documents and to understand how the tool may support future designs of clinical document user interfaces.
Methods
A mixed methods approach to analyze the impact of the visualization tool was used with a sample of eight medical interns as they synthesized EHR clinical documents to accomplish a set of four pre-formed clinical scenarios using a think-aloud protocol.
Results
Differences in the missing (unretrieved) patient information (2.3±1.2 [with the visualization tool] vs. 6.8±1.2 [without the visualization tool], p = 0.08) and accurate inferences (1.3±0.3 vs 2.3±0.3, p = 0.09) were not statistically significant but suggest some improvement with the new information visualization tool. Despite the non-significant difference in total times to task completion (43±4 mins vs 36±4 mins, p = 0.35) we observed shorter times for two scenarios with the visualization tool, suggesting that the time-saving benefits may be more evident with certain clinical processes. Other observed effects of the tool include more intuitive navigation between patient details and increased efforts towards methodical synthesis of clinical documents.
Conclusion
Our study provides some evidence that new information visualization in clinical notes may positively influence synthesis of patient information from EHR clinical documents. Our findings provide groundwork towards a more effective display of EHR clinical documents using advanced visualization applications.
Keywords: Electronic health records, data visualization, interfaces and usability
1. Introduction
Current efforts in the U.S. healthcare system towards increasing the adoption of health information technology (HIT) focus on improving access to patient data and clinical knowledge within the healthcare environment, with the goals of improving healthcare delivery, quality, and safety [1]. Although electronic health record (EHR) systems are recognized HIT solutions that support computerized documentation, these systems still contain visual components that replicate data presentation in paper-based media, which may not be optimal for clinician users. As such, some of the similar difficulties experienced by clinicians in navigating, retrieving, and synthesizing paper-based patient records remain unsolved with current EHR systems [2].
Clinicians typically create and review text-based EHR documents (e.g. progress notes and discharge summaries) in the process of patient care. These documents assist clinicians in constructing a contextual clinical understanding of a particular patient. They also serve as medico-legal documents of patient care, and tools to communicate clinical reasoning, medical phenomena, and historical information [3]. Current EHR systems possess limited user interface functionalities designed to augment navigation and synthesis of text-based documents [2]. This represents an important opportunity to potentially provide more efficient and innovative note visualization ultimately aimed at improving patient care.
The objective of this study is to evaluate the effects of a new information visualization tool for clinical documents within a prototype EHR system.
2. Background
2.1 Medical Errors and EHR Clinical Document Synthesis
Recent studies on HIT adoption and computerized physician documentation outline potential benefits of EHR systems which include increased availability of patient data, access to evidence-based guidelines, and reduction of medical errors [4, 5, 6]. Complex organization and varying granularity of details in EHR clinical documents often make clinicians’ search for specific patient information haphazard and difficult [7].
While studies with paper-based health records have demonstrated that clinicians use clues such as individual penmanship of colleagues to identify relevant data in paper documents, electronic documents lack these helpful features, and identifying key pieces of information within electronic documents can be challenging [8]. Additionally, poor organization of EHR clinical documents may contribute and perpetuate this challenge. Clinicians may have reduced motivation to thoroughly review ‘visually unattractive’ narratives, thus resulting in an increased likelihood to omit details pertinent to accurate diagnosis or reorder laboratory procedures and medications that can expose patients to considerable health risks [9].
During patient encounters, clinicians often review EHR clinical documents while multi-tasking (i.e. simultaneously reviewing clinical documents and communicating with patients or other clinicians). Ash et al, in their study on unintended consequences of HIT, indicated that many EHR user interfaces are designed without careful consideration of the multi-tasking clinician and typically require undivided concentration to adequately synthesize relevant patient information [10]. Similarly, in a study by Laxmisan et al, it is stated that frequent workflow interruptions in the practice environment may contribute to increased cognitive load as clinicians synthesize EHR data [11]. Also, brief periods of inattentiveness while reviewing clinical documents can lead to wrongful matching of dates and diagnostic or treatment details in close proximity (juxtaposition error) or abrupt loss of clinical history sequencing based on documentations from previous hospital visits (loss of overview) [10].
2.2 Redundancy in EHR Clinical Documents
When reviewing complex and lengthy patient records, clinicians typically read through clinical documents to abstract patient details and generate hypotheses related to the presenting clinical scenario [12]. Investigators at Columbia University showed that less than 20% of EHR documents are typically reviewed by clinicians, and the likelihood of reviewing these documents during patient care reduced with the age of the documents, difficulty in locating them within the EHR, and perceived irrelevance of documented patient information [13].
In composing a clinical document, clinicians often rewrite or ‘copy and paste’ unchanged text across subsequent documents to indicate that specific patient information remains true [14]. This “redundant information” is in contrast to new information that is the focus of this paper, which is current and changed from previously.
Wrenn et al. found that duplicated patient information within sign-out and progress notes averaged 54% and 78% respectively, and that redundancy increased over the course of an inpatient hospitalization [15]. In a study on outpatient clinic documents, Zhang et al. found that redundancy generally increased with time and that ambulatory care records displayed a cyclical pattern of redundancy with dips correlating with significant clinical care events [16]. Although some ‘copying and pasting’ may have benign implications, significant redundancy in EHR clinical documents can introduce misleading information that may result in patient mismanagement [17]. In addition, redundancy in EHR documents may complicate review and navigation through textual data, increase clinician cognitive load and negatively impact efficiency at putting together the ‘pieces of the patient’s puzzle’ [18, 19].
2.3 Visualization of New Information within EHR Clinical Documents
Implementation of visualization techniques to effectively distill new information from large quantities of clinical documents should correspond to clinical reasoning patterns and efforts to minimize erroneous data interpretations [20]. Most textual data in the EHR are displayed using unsophisticated visual cues (e.g. spacing and paragraphing, lists and tables) which may not facilitate cognitive distinction of new and redundant information within clinical documents, although they support consumption of information in segments [2, 21]. We hypothesize that visual cues to support the discovery of relevant patient information may promote workflow efficiency and reduce the potential for omission errors while reviewing EHR documents.
3. Methods
We used a mixed methods approach to analyze the impact of a prototype visualization tool for new patient information on clinicians’ synthesis of EHR clinical documents while accomplishing a set of routine clinical tasks for a set of preformed clinical scenarios. The study experiments were conducted in a simulated ambulatory setting controlled for the typical interruptions and multi-tasking observed in the realistic clinical setting. Clinicians were expected to create clinical documents during the scenarios, and these documents were reviewed thereafter, the purpose of which was to ensure that there are no obvious errors or omissions. The criteria for assessing the new documents is a reference standard document for each scenario created by the clinician investigators (OF and GM) under no time constraints.
3.1 Study Sample
According to sampling strategies used in human factors and usability research [22–24], we recruited a purposive sample of clinicians at the University of Minnesota Medical Center while restricting study participation to intern level physicians to minimize the confounding effect of clinical expertise. On the other hand, since each intern had a range of technical expertise and familiarity with EHR systems, while clinical expertise was more minimized, this variability remained.
3.2 A Prototype EHR Clinical Document User Interface
Using a spiral model for software development [25] (►Figure 1) and the EHR system user interface framework of the Veterans Affairs’ computerized patient record system (VistA CPRS) [26], we carried out three iterations of planning, risk analysis, design and evaluation of a prototype ambulatory EHR user interface with specific functionalities for clinical documents. A screen shot of the final product (prototype 3) is shown in ►Figure 2.
Fig. 1.
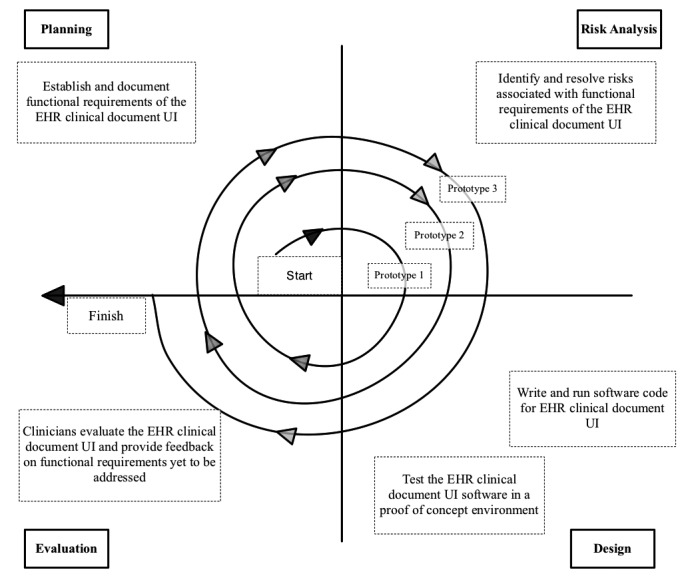
Spiral model for development of EHR Clinical Document User Interface (UI)
Fig. 2.
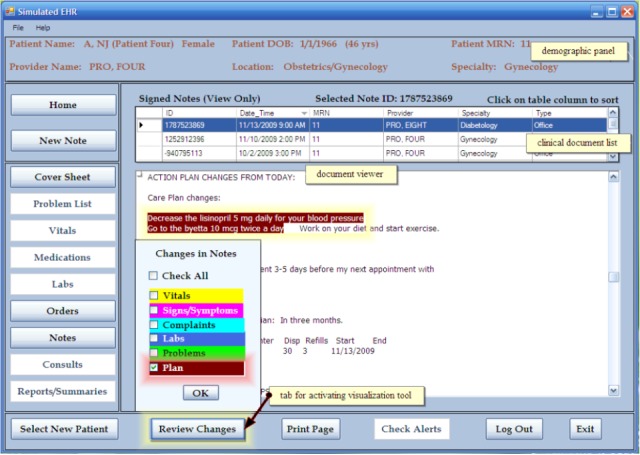
Main features of the EHR clinical document user interface
Evidence of the sizeable amounts of data redundancy in EHR clinical documents [15, 27] and insights on interns’ information processing patterns observed in our previous studies [15, 19, 28] provide a rationale for our implementation of a novel visualization tool to distinguish new (non-redundant) information from duplicated patient details. In addition, we replicated basic tools for reviewing and creating clinical documents in VistA CPRS e.g. the document viewer and a tab to create a new note. The main features of the prototype user interface, as shown in ►Figure 2, include:
-
•
demographic panel: located at the top of the user interface; provides basic patient information such as patient’s names, date of birth, age and medical record number, healthcare provider’s name and the out-patient clinic/specialty currently managing the patient.
-
•
clinical document list: contains clinical document metadata, including the names and specialties of authoring healthcare providers, dates of associated clinical encounters, and the clinical note type (e.g. office visit).
-
•
document viewer: displays the selected clinical document in a read-only format and allows for extracts to be copied and pasted into a new document window.
-
•
review changes tab: to enhance document display in the user interface, we implemented a visualization tool to highlight new patient information within the selected clinical note. Color-coded highlighting is used to identify clinically relevant data changed in value or detail compared to the preceding clinical encounters. The highlighted text is colored coded into the following classes of information: vitals, signs and symptoms, complaints, labs, problems, and plan. For instance, as depicted in ►Figure 2, users have the option while reviewing a particular clinical document, to have the ‘review changes’ tab activated for all or particular types of information. When the user selected the option ‘plan’ only, the revised treatment plan was highlighted in brown within the clinical document.
3.3 Experimental Design
We developed a set of clinical scenarios and routine tasks to simulate problem solving activities for the think-aloud (TA) protocol. The TA protocol is a qualitative research technique used in software usability evaluation to investigate users’ cognitive behavior and reveal reasoning patterns that indicate compatibility between software applications and users’ cognitive activities [29, 30]. As outlined in ►Table 1, the tasks that were accomplished in these scenarios were routine clinical processes that required interns to synthesize patients’ clinical documents. Interns were observed in a simulated ambulatory care setting as they accomplished these clinical tasks (e.g. summarizing or synthesizing a patient record as part of an admission or referral). Each task required the intern to document their findings, assessment, and treatment plan (where necessary) in a new clinical note saved within the prototype EHR system. These notes were evaluated subjectively for similarities in content by a clinician investigator (OF). In addition, the time period taken by the interns to accomplish the designated clinical scenarios was analyzed for potential differences in time expenditure with and without the visualization tool. The duration to task accomplishment was calculated from when the intern logged into the EHR System to when s/he indicated they had completed the clinical task.
Table 1.
Clinical Scenarios
| Scenario ID | Summary | Task | Diagnosis |
|---|---|---|---|
| 1 | 56 year old man presents with a 7-day history of pain and swelling in his left leg. The pain was gradual in onset and got worse whenever he walked up the stairs. He had a fever which got better after he took tylenol, except for some warmth in his lower extremity | Admit the patient | Cellulitis |
| 2 | 53 year old man presents today after having a seizure 15 minutes before arrival. His daughter said he was acting confused and was sweating profusely prior to the seizure. His Temperature and BP taken at presentation were 98.2F and 110/75mmhg respectively. | Summarize the patient record | Hypoglycemia |
| 3 | 77 year old woman was brought today after she told her partner that she vomited some blood in the earlier hours of the day. She says she's been feeling tired and breathless ever since the episodes of vomiting. She also complains of abdominal pain that is sometimes relieved on eating | Write a referral | Peptic ulcer disease |
| 4 | 46 year old woman, presents with a 3-day history of mild confusion, high fever, chills, and cough with yellowish sputum. She also complained of worsening fatigue and loss of appetite. Her BP, Temperature and Respiratory rate taken at presentation were 100/70 mmHg, 101.8F and 32/min respectively | Admit the patient | Pneumonia |
Based on the fact that chronically ill patients expectedly accumulate considerable amounts of clinical documents due to their frequent ambulatory visits and in-patient admissions [31], patient records used in the study were selected from a larger cohort of patients with a diagnosis of diabetes and other comorbidities, e.g. hypertension and dyslipidemia. During control experiments in a previous study without the visualization tool [28], six interns reviewed nine patient records with associated clinical scenarios. These patient records were from the University of Minnesota affiliated Fair-view Health Services. Each intern scored all the records on a 10 point scale (1– lowest, 10– highest) for each of three parameters: 1) completeness of clinical information within the record, 2) degree to which the record assisted with performing a routine clinical task, and 3) the amount of redundant information within the record.
Clinician investigators (OF and GBm) selected four patient records for the study after eliminating outlier records that had mean total scores ≤6 or were atypical (e.g. had missed appointments/office visits or relatively complex scenarios/diagnoses) compared to the other records (Supplementary data File: Appendix A). For the purposes of this study, all outpatient progress notes over a one-year period were used for the scenarios, which amounted to 8 or 9 notes per scenario (35 notes in all) for the four patients selected.
For the main experiments, a different set of interns synthesized the selected patient records to accomplish related clinical scenarios. Each intern accomplished one clinical scenario without access to the visualization tool for new information and another scenario using the ‘review changes’ tab to activate the visualization tool (►Table 2). Interns verbalized their thought processes (think aloud) as they reviewed clinical scenarios and performed associated tasks using a prototype EHR user interface that included the visualization tool. Mock sessions of TA protocol and the use of the ‘review changes’ function were conducted for each intern prior to the observations; these sessions involved a sample clinical scenario different from those used in the observations. We also conducted semi-structured interviews to further identify themes that reflect the possible influences of the visualization tool on interns’ efficiency at synthesizing EHR documents as they performed specific clinical tasks. The general question posed during these semi-structured interviews was “please can you discuss your overall experience using the visualization tool while accomplishing the clinical scenarios?”
Table 2.
Duration of Clinician Observations for the TA protocol
| Clinician ID | Scenario 1 (mins) | Scenario 2 (mins) | Scenario 3 (mins) | Scenario 4 (mins) |
|---|---|---|---|---|
| 1 | N (9) | V (7) | ||
| 2 | N (14) | V (16) | ||
| 3 | V (14) | N (22) | ||
| 4 | V (27) | N (23) | ||
| 5 | N (32) | V (22) | ||
| 6 | N (31) | V (26) | ||
| 7 | V (12) | N (21) | ||
| 8 | V (22) | N (21) |
Key: N = No visualization tool; V= Visualization tool used
Interns’ verbalizations during the experiments were transcribed and analyzed using QSR NVIVO® 9. Following thematic analysis of verbalizations from the TA protocol, the time to task accomplishment and mean number of references coded under each theme was analyzed using ANOVA for repeated measures, which is robust enough to adequately adjust for the nested data resulting from the same clinical scenarios being accomplished by more than one intern. For the statistical analysis, we used an adjusted α-level (probability of a false positive or type I error) of 0.01, calculated using the Bonferroni method (α/k = 0.05/5 = 0.01 [k = the number of statistical tests]). Kappa statistic (κ) and percent agreement were used to quantify the magnitude of concurrence between investigators’ coding of the study transcripts [32]. Another researcher familiar with the coding scheme and experienced in qualitative research (KM) coded a subset of 4 (11%) study transcripts; there was very good agreement between the investigators for both the protocol analysis (κ = 0.96, mean agreement = 98%) and the interview data analysis (κ = 0.81, mean agreement = 91%).
4. Results
We observed eight clinical interns (4 males and 4 females, aged 21 – 30 years) as each synthesized two patient records and carried out routine clinical tasks associated with clinic scenarios with and without the visualization tool for new information. To emphasize information synthesis rather than recall, the experiments were designed such that an intern was exposed to a specific clinical scenario and the corresponding routine task no more than once.
4.1 Protocol Analysis
Prior to our analysis of the think-aloud data (protocol analysis), clinical documents created by the interns at the end of each clinical task were evaluated by a clinician investigator (OF) and all documents for each task were found to be appreciably similar in format, length, and clinical details such as history of presenting illness, differential diagnoses and treatment plan. The average duration based on the total time to task accomplishment when each scenario was reviewed with and without the visualization tool was analyzed using ANOVA for repeated measures; the difference was not statistically significant (36±4 mins vs 43±4 mins, p = 0.35). However, we noted that the there was a much larger difference in the total times to accomplish scenarios 2 and 3, with and without the visualization tool, compared to 1 and 4 (►Table 2 and ►Table 3). Although our study was not focused on evaluating clinicians’ multitasking capabilities, we recognize that the interns’ duration to task accomplishment may have been influenced by the process of simultaneously synthesizing patient records and articulating their thought processes. As outlined in ►Table 1, scenarios 1 and 4 required the synthesis of EHR documents to develop an admission note, scenario 2 involved summarizing the entire patient record, while constructing a referral based on salient aspects of the EHR documents was the task in scenario 3.
Table 3.
ANOVA Results for Time to Task Completion
| Scenario ID | Total duration (mins), N = 4 | F score (P value) | |
|---|---|---|---|
| No Visualization Tool | Visualization Tool | ||
| 1 | 41 | 49 | |
| 2 | 45 | 26 | |
| 3 | 43 | 29 | |
| 4 | 44 | 42 | |
| LSMean ± SE | 43 ± 4 | 36 ±4 | 1.23 (0.35) |
In view of the study objective and recognized frameworks highlighted in software usability studies involving TA protocols [33–35], we analyzed the study transcripts to identify important themes that aptly represented the interns’ information synthesis from EHR clinical documents while completing various clinical tasks.
Through an iterative protocol analysis of the think-aloud data, we deductively identified predominant high level cognitive activities that signified ongoing information processing by the interns. As shown in ►Table 4, interns’ verbalizations were exclusively coded based on whether s/he reasoned out an accurate inference (Deduction), expressed a possibility without verifying the statement (Assumption), alluded that s/he could not retrieve specific clinical data necessary for patient care (Missing Information), made an inference that conflicts with available clinical data (Incorrect Inference), or ordered a procedure or test as part of patient care (Intervention).
Table 4.
Themes from the Protocol Analysis
| Theme | Definition | Example from Transcripts |
|---|---|---|
| Deduction | accurate inference based on logical reasoning | “So it looks like she has a diagnosis of proteinuria- so that’s suggestive of kidney damage due to her diabetes.” |
| Assumption | relevant statement without proof/verification | “Compression stockings- possibly I think that he might have had some problems with neuropathic pain likely related to diabetes in the past, but not entirely sure; maybe he has some circulation problems.” |
| Missing Information | existing clinical information that was not retrieved | “Trying to see what they did for her at this time- which I am not seeing.” |
| Incorrect Inference | inference that disagrees with available information | “I think Nasacort is may be for blood pressure.”( Note: Nasacort is used to treat nasal allergies) |
| Intervention | procedures ordered for patient care | “To evaluate for those things I definitely want to first start her with a chest x-ray to evaluate for pneumonia.” |
As shown in ►Table 5, an ANOVA test carried out on the verbal protocols revealed that, although deductions and assumptions were predominant end points of information processing when the interns synthesized EHR clinical documents in completing designated clinical tasks, the differences in the number of references under these themes with and without the visualization tool was not statistically significant. Overall, when analyzed per clinical scenario, we observed a three-fold decrease in cases of available but unretrieved patient data (missing information) when interns used the visualization tool; however, this difference was not statistically significant (2.3±1.2 [with the visualization tool] vs. 6.8±1.2 [without the visualization tool], p = 0.08). The mean value of incorrect inferences (logical conclusion that is contrary to available patient information) made when the visualization tool was not used (2.3±0.3) was almost twice that observed when the tool was used (1.3±0.3); this difference was also not statistically significant (p = 0.09). Differences in deductions, assumptions and interventions revealed a 1.1–1.5 factor increase in references coded under these themes when interns did not use the tool; as in ‘missing information’ and ‘incorrect inferences’, the differences in mean values were non-significant (26.8±3.7 vs 28.3±3.7, p = 0.79 [deduction], 7.3±1.8 vs 11.5±1.8, p = 0.20 [assumption], and 6.5±2.5 vs 9.3±2.5, p = 0.50 [intervention]).
Table 5.
ANOVA Results for Identified Themes
| Themes | LSMean ± SE (Total), N = 4 | F score (P-value) | |
|---|---|---|---|
| No Visualization Tool | Visualization Tool | ||
| Deduction | 28.3 ± 3.7 (113) | 26.8 ± 3.7 (107) | 0.08 (0.79) |
| Assumption | 11.5 ± 1.8 (46) | 7.3 ± 1.8 (29) | 2.75 (0.20) |
| Missing Information | 6.8 ± 1.2(27) | 2.3 ± 1.2 (9) | 6.57 (0.08) |
| Incorrect Inference | 2.3 ± 0.3 (9) | 1.3 ± 0.3 (5) | 6.00 (0.09) |
| Intervention | 9.3 ± 2.5 (37) | 6.5 ± 2.5 (26) | 0.59 (0.50) |
4.2 Interview Analysis
To further identify effects of the visualization tool of new information, we interviewed each intern following completion of a sequence of clinical tasks with and without the tool. As indicated in ►Table 6, we identified some themes from the interview transcripts showing the potential impact of the visualization tool:
Table 6.
Frequencies of Themes from the Interviews
| Theme | Definition | Positive | Negative | No comment |
|---|---|---|---|---|
| Attentiveness | focus on details while reviewing clinical documents | 5 | 4 | 0 |
| Time-related changes | information that signifies changes in health status over a period | 7 | 1 | 0 |
| Speed | rate at which clinical documents are reviewed | 4 | 1 | 0 |
| Thoroughness | careful synthesis of portions of the clinical documents | 3 | 1 | 0 |
| Navigation | maneuvering from one clinical document to another | 3 | 0 | 1 |
| Total | 22 | 7 | 1 | |
Attentiveness
Some interns commented that the visualization tool helped them carefully consider specific patient information that may have escaped their attention if the clinical documents were reviewed ‘as-is’. However, some interns indicated that the visualization tool could pose a distraction and obstruct the synthesis of aspects of the EHR clinical documents that are not highlighted. Statements to support these perspectives include;
Positive
“I guess even if some things were important and some things didn’t seem that important but at least, when it was highlighted, my eyes definitely go there and I definitely take note of it.”
Negative
“It could mislead you because it’s saying that’s the only change and then you don’t know the other things.”
Given the similar number of positive and negative references categorized under ‘attentiveness’, further studies involving eye-tracking and measurement of attention span are necessary to investigate the extent to which the visualization tool enhances or interrupts the focus of clinicians as they synthesize electronic clinical text.
Time-related Changes
According to majority of the interns, the visualization tool assisted with noticing changes in the patient’s clinical condition across time, and constructing a mental model of the patient’s progress. Responses that reflected this impression include;
Positive
“It's helpful to see what had changed. I think that's the information that is most pertinent especially when somebody is coming in.”
Negative
“I think that the vitals are always going to change; so I didn’t really think that was useful to have that highlighted at me.”
Speed
In most cases, interns implied that the visualization tool was time-saving by facilitating an easier and faster process of going through EHR documents However, interns’ perception of speed did not correlate with the average duration of task completion for scenarios 1 and 4. Examples from the interview transcripts include:
Positive
“My experience was that it was a little bit faster going through the note, through all the notes. It kind of helped you weed out some of the extraneous information.”
Negative
“I think I would use it; but it wouldn’t, for me, necessarily make me faster.”
Thoroughness
Responses during the interns’ interviews indicated that, although the visualization tool did not completely eliminate possibilities of missing any patient information, it often motivated meticulous and accurate synthesis of the EHR documents:
Positive
“I think I made a more complete note as I actually was able to review a lot more of the previous notes because of the tool.”
Negative
“I think this time I was just frustrated because I couldn't find the information I was looking for ; so I didn’t know if I was just not thoroughly reading the notes.”
Navigation
Comments from the interns signified that navigating between EHR documents while synthesizing relevant patient information was more intuitive with the visualization tool:
Positive
“I found the tool useful to help navigate through the notes. The notes, without the tool, are sort of difficult to find your way around because so much stuff gets blown in from previous notes.”
Negative
None
5. Discussion
Information synthesis from lengthy text-based EHR clinical documents using unsophisticated visualization aids may be arduous, time-consuming and error-prone due to complex organization of narratives, excessive redundancy within the documents and possible proliferation of data inconsistencies [18]. Ongoing interest in implementing user-centric EHR systems within healthcare inspires the need to systematically address issues related to data visualization which may optimize clinical information synthesis at the point of care [34, 36, 37. 38]. Previous studies on the design of user interfaces to improve EHR visualization and address cognitive needs of clinicians have employed various research methods in establishing solutions for enhanced clinician-computer interaction and efficiency in patient care [20, 34, 39, 40]. Using a mixed methods approach, we evaluated the effects of a prototype visualization tool for new (non-redundant) information on interns’ synthesis of EHR clinical documents while performing routine clinical tasks using a model ambulatory EHR user interface.
Although the difference in the interns’ total duration to task accomplishment with and without the visualization tool was not statistically significant, we observed significantly shorter times for completion of scenarios 2 and 3 with the visualization tool compared to 1 and 4. This suggests that the time to accomplish the clinical scenarios may be influenced by the nature of the task and not just the interns’ information retrieval strategies. The two tasks that had essentially the same times were admission tasks; the strategy of highlighting key information may not be particularly useful for these tasks since large quantities of available patient information may need to be reviewed to adequately capture all clinical events prior to the admission. This is in contrast to writing a referral or a patient summary where easier and quicker access to salient information would be more helpful. Further studies are required to investigate the correlation between the type of clinical tasks and the impact of the visualization tool on clinician efficiency.
In addition, since the study was conducted in a controlled practice environment, more research is required to evaluate the visualization tool in the context of the multitasking and interruptions in realistic practice settings. This will help to better determine if the tool can address barriers to EHR systems adoption such as increased physician time expenditure and reduced periods of clinician-patient interaction [27, 41, 42].
Although the statistical analysis showed non-significant differences, given the small p-values associated with the concepts of ‘missing information’ (p = 0.08) and ‘incorrect inferences’ (p = 0.09), the results suggest that the visualization tool may facilitate an improvement in retrieval of available patient information and accurate inferences when interns synthesize EHR clinical documents while performing clinical tasks. Despite being statistically comparable, the average number of assumptions was relatively more when interns synthesized the EHR documents without the visualization tool. We presume that the interns’ inability to retrieve relevant patient information when the tool was not used could have resulted in the higher number of assumptions, but more evidence is necessary to support this claim. Other benefits of the visualization tool perceived by majority of the interns include enhanced consumption of time-related changes in a patient’s clinical status, faster and more intuitive navigation between patient details in the EHR, and stimulated efforts towards methodical and accurate synthesis of EHR clinical documents. However, we recognize that the interns also had negative experiences using the visualization tool, and we intend to further investigate these issues in subsequent usability studies focused on the tool’s impact on clinicians’ synthesis of EHR documents. Overall, the visualization tool can inform future designs of user interfaces for text-based EHR documents as it provides a foundation for research on more effective ways to optimize color-coded distinction of new and redundant data within EHR clinical documents.
Our restricted sampling of interns at the University of Minnesota Medical Center poses a limitation to generalization of the study findings; the results obtained may not adequately represent the potential effects of the visualization tool on the workflow efficiency of interns at other healthcare facilities, more experienced physicians or other non-physician clinicians (e.g. nurses, pharmacists, and physician extenders). Further studies are required to corroborate our findings at other medical centers and stages of clinical expertise, and within various healthcare provider populations. Because the study experiments were conducted within a simulated ambulatory clinical environment, investigations regarding the impact of the tool within realistic emergency, in-patient and ambulatory care settings are required. In addition, the effects of visualization tool on efficiency of non-intern clinicians can be evaluated under time constraints similar to those experienced in realistic settings. The next steps in enhancing the visualization tool will be to address usability issues highlighted during the interviews and combine techniques in our laboratory to develop natural language processing (NLP) algorithms for improved automated detection of new information within EHR clinical documents in a pilot study of an interface in practice for patient care.
6. Conclusion
Our evaluation of the effects of a prototype visualization tool of new information on clinicians’ synthesis of text-based EHR clinical documents provides some evidence that new information identification in text may positively influence retrieval of relevant patient information, and therefore increase the clinician’s ability to accurately synthesize patient information while providing care. Further research is recommended to provide more evidence and investigate the impact of the tool on the synthesis of electronic clinical text among other clinician populations and within various healthcare settings. Our findings provide groundwork towards more user-centric display of EHR clinical documents using advanced visualization applications.
Clinical Relevance Statement
Clinicians’ use of the visualization tool may reduce cognitive load associated with reviewing large amounts of EHR clinical documents within time-constrained clinical encounters. Therefore, the tool may enhance provider satisfaction and promote better clinician-computer interactions towards effective clinical decision making.
Conflicts of Interest
The authors declare that they have no conflicts of interest in the research.
Human Subjects Protection
The study was performed in compliance with the World Medical Association Declaration of Helsinki on Ethical Principles for Medical Research Involving Human Subjects, and was approved by the University of Minnesota Institutional Review Board.
Supplementary Material
Acknowledgements
This research was supported by the University of Minnesota Institute for Health Informatics Research Seed Grant. We would like to appreciate Hanqing Cao (Biostatistician and Snr. Member Research Staff, Philips Research- North America) for her advice on appropriate statistical techniques, Fairview Health Services for their support and the University of Minnesota interns who participated in the study.
References
- 1.Miller RH, Sim I. Physicians’ use of electronic medical records: barriers and solutions. Health Aff 2004; 23(2): 116–126 [DOI] [PubMed] [Google Scholar]
- 2.Bui AAT, Hsu W, Taira RK. Medical Data Visualization: Toward Integrated Clinical Workstations. Berlin: Springer-Verlag Berlin; 2009: 139–193 [Google Scholar]
- 3.Feblowitz J, Wright A, Singh H, Samal L, Sittig D. Summarization of clinical information: A conceptual model. J Biomed Inform 2011; 44(4): 688–699 [DOI] [PubMed] [Google Scholar]
- 4.Embi PJ, Yackel TR, Logan JR, Bowen JL, Cooney TG, Gorman PN. Impacts of computerized physician documentation in a teaching hospital: perceptions of faculty and resident physicians. J Am Med Inform Assoc 2004; 11(4): 300–309 [DOI] [PMC free article] [PubMed] [Google Scholar]
- 5.Christensen T, Grimsmo A. Instant availability of patient records, but diminished availability of patient information: a multi-method study of GP's use of electronic patient records. BMC Med Inform Decis Mak 2008; 8: 12 [DOI] [PMC free article] [PubMed] [Google Scholar]
- 6.DesRoches CM, Campbell EG, Rao SR, Donelan K, Ferris TG, Jha A, Kaushal R, Levy DE, Rosenbaum S, Shields AE. Electronic health records in ambulatory care--a national survey of physicians. N Engl J Med 2008; 359: 50–60 [DOI] [PubMed] [Google Scholar]
- 7.Tange HJ, Schouten HC, Kester ADM, Hasman A. The Granularity of Medical Narratives and Its Effect on the Speed and Completeness of Information Retrieval. J Am Med Inform Assoc 1998; 5(6): 571–582 [DOI] [PMC free article] [PubMed] [Google Scholar]
- 8.Payne TH, tenBroek AE, Fletcher GS, Labuguen MC. Transition from paper to electronic inpatient physician notes. J Am Med Inform Assoc 2010; 17(1): 108–111 [DOI] [PMC free article] [PubMed] [Google Scholar]
- 9.Johnson SB, Bakken S, Dine D, Hyun S, Mendonça E, Morrison F, Bright T, Van Vleck T, Wrenn J, Stetson P. An electronic health record based on structured narrative. J Am Med Inform Assoc 2008; 15(1): 54–64 [DOI] [PMC free article] [PubMed] [Google Scholar]
- 10.Ash JS, Berg M, Coiera E. Some Unintended Consequences of Information Technology in Health Care: The Nature of Patient Care Information System-related Errors. J Am Med Inform Assoc 2004; 11(2): 104–112 [DOI] [PMC free article] [PubMed] [Google Scholar]
- 11.Laxmisan A, Hakimzada F, Sayan OR, Green RA, Zhang J, Patel VL. The multitasking clinician: Decision-making and cognitive demand during and after team handoffs in emergency care. Int J Med Inf 200712; 76(11–12): 801–811 [DOI] [PubMed] [Google Scholar]
- 12.Arocha J, Wang D, Patel V. Identifying reasoning strategies in medical decision making: A methodological guide. J Biomed Inform 2005. ;38(2): 154–171 [DOI] [PubMed] [Google Scholar]
- 13.Hripcsak G, Vawdrey D, Fred M, Bostwick S. Use of electronic clinical documentation: time spent and team interactions. J Am Med Inform Assoc 2011; 18(2): 112–117 [DOI] [PMC free article] [PubMed] [Google Scholar]
- 14.O’Donnell HC, Kaushal R, Barrón Y, Callahan MA, Adelman RD, Siegler EL. Physicians’ attitudes towards copy and pasting in electronic note writing. J Gen Intern Med 2009; 24(1): 63–68 [DOI] [PMC free article] [PubMed] [Google Scholar]
- 15.Wrenn JO, Stein DM, Bakken S, Stetson PD. Quantifying clinical narrative redundancy in an electronic health record. J Am Med Inform Assoc 2010; 17(1): 49–53 [DOI] [PMC free article] [PubMed] [Google Scholar]
- 16.Zhang R, Pakhomov S, McInnes BT, Melton GB. Evaluating Measures of Redundancy in Clinical Texts. AMIA Annu Symp Proc; 2011. [PMC free article] [PubMed] [Google Scholar]
- 17.Hammond KW, Helbig ST, Benson CC, Braithwaite-Sketoe BM. Are electronic medical records trustworthy? Observations on copying, pasting and duplication. AMIA Annu Symp Proc; 2003. [PMC free article] [PubMed] [Google Scholar]
- 18.Zhang R, Pakhomov S, Melton GB. Automated identification of relevant new information in clinical narrative. 2nd ACM SIGHIT Symp Proc;2012. [Google Scholar]
- 19.Cabitza F, Sarini M, Simone C, Telaro M. When once is not enough: the role of redundancy in a hospital ward setting. 2005 ACM SIGGROUP Conf Proc; [Google Scholar]
- 20.Ahmed A, Chandra S, Herasevich V, Gajic O, Pickering BW. The effect of two different electronic health record user interfaces on intensive care provider task load, errors of cognition, and performance. Crit Care Med 2011; 39(7): 1626–1634 [DOI] [PubMed] [Google Scholar]
- 21.Tufte ER. Visual Explanations: Images and Quantities, Evidence and Narrative. Chesire CT, Graphics Press. 1997. [Google Scholar]
- 22.Chittaro L. Information visualization and its application to medicine. Artif Intell Med 2001; 22(2): 81–88 [DOI] [PubMed] [Google Scholar]
- 23.Borycki E, Kushniruk A. Identifying and preventing technology-induced error using simulations: Application of usability engineering techniques. Healthc Q 2005; 8: 99–105 [DOI] [PubMed] [Google Scholar]
- 24.Virzi RA. Refining the test phase of usability evaluation: How many subjects is enough? Hum Factors 1992; 34(4): 457–468 [Google Scholar]
- 25.Boehm BW. A spiral model of software development and enhancement. Computer 1988; 21(5): 61–72 [Google Scholar]
- 26.Brown SH, Lincoln MJ, Groen PJ, Kolodner RM. VistA--US department of veterans affairs national-scale HIS. Int J Med Inf 2003; 69(2–3): 135–156 [DOI] [PubMed] [Google Scholar]
- 27.McAlearney AS, Robbins J, Hirsch A, Jorina M, Harrop JP. Perceived efficiency impacts following electronic health record implementation: An exploratory study of an urban community health center network. Int J Med Inf 201012; 79(12): 807–816 [DOI] [PubMed] [Google Scholar]
- 28.Farri O, Pieczkiewicz DS, Rahman A, Adam TJ, Pakhomov S, Melton GB. A Qualitative Analysis of EHR Clinical Document Syntheis by Clinicians. AMIA Annu Symp Proc 2012. [PMC free article] [PubMed] [Google Scholar]
- 29.Fonteyn ME, Kuipers B, Grobe SJ. A Description of Think Aloud Method and Protocol Analysis. Qual. Health Res 1993; 3(4): 430–441 [Google Scholar]
- 30.Peute L, Jaspers M. The significance of a usability evaluation of an emerging laboratory order entry system. Int J Med Inf 2007; 76(2–3): 157–168 [DOI] [PubMed] [Google Scholar]
- 31.Levin A, Chaudhry MR, Djurdjev O, Beaulieu M, Komenda P. Diabetes, kidney disease and cardiovascular disease patients. Assessing care of complex patients using outpatient testing and visits: additional metrics by which to evaluate health care system functioning. Nephrol Dial Transplant 2009; 24(9): 2714–2720 [DOI] [PubMed] [Google Scholar]
- 32.Viera AJ, Garrett JM. Understanding interobserver agreement: the kappa statistic. Fam Med 2005; 37(5): 360–363 [PubMed] [Google Scholar]
- 33.Evans DC, Nichol WP, Perlin JB. Effect of the implementation of an enterprise-wide Electronic Health Record on productivity in the Veterans Health Administration. Health Econ Policy and Law 2006; 1(02): 163–169 [DOI] [PubMed] [Google Scholar]
- 34.Jaspers M, Steen T, van den Bos C, Geenen M. The think aloud method: a guide to user interface design. Int J Med Inf 2004; 73(11–12): 781–795 [DOI] [PubMed] [Google Scholar]
- 35.Johnson C, Turley J. The significance of cognitive modeling in building healthcare interfaces. Int J Med Inf 2006; 75(2): 163–172 [DOI] [PubMed] [Google Scholar]
- 36.Benbunan-Fich R. Using protocol analysis to evaluate the usability of a commercial web site. Information & Management 200112; 39(2): 151–163 [Google Scholar]
- 37.Plaisant C, Mushlin R, Snyder A, Li J, Heller D, Shneiderman B. LifeLines: using visualization to enhance navigation and analysis of patient records. AMIA Annu Symp Proc;1998. [PMC free article] [PubMed] [Google Scholar]
- 38.Zheng K, Padman R, Johnson MP, Diamond HS. An interface-driven analysis of user interactions with an electronic health records system. J Am Med Inform Assoc 2009; 16(2): 228–237 [DOI] [PMC free article] [PubMed] [Google Scholar]
- 39.Patel VL, Kushniruk AW. Interface design for health care environments: the role of cognitive science. AMIA Annu Symp Proc; 1998. [PMC free article] [PubMed] [Google Scholar]
- 40.Kushniruk AW, Patel VL. Cognitive and usability engineering methods for the evaluation of clinical information systems. J Biomed Inform 20042; 37(1): 56–76 [DOI] [PubMed] [Google Scholar]
- 41.Linder JA, Schnipper JL, Tsurikova R, Melnikas AJ, Volk LA, Middleton B. Barriers to electronic health record use during patient visits. AMIA Annu Symp Proc;2006. [PMC free article] [PubMed] [Google Scholar]
- 42.Menachemi N. Barriers to ambulatory EHR: who are'imminent adopters' and how do they differ from other physicians? Inform Prim Care 2006; 14(2): 101–108 [DOI] [PubMed] [Google Scholar]
Associated Data
This section collects any data citations, data availability statements, or supplementary materials included in this article.