Abstract
The exquisite soft tissue contrast provided by magnetic resonance imaging arises principally from differences in the intrinsic relaxation properties, T1 and T2. Though the intricate relationships that link tissue microstructure and the longitudinal and transverse relaxation times remain to be firmly established, quantitative measurement of these parameters, also referred to as quantitative relaxometry, can be informative of disease-related tissue change, developmental plasticity, and other biological processes. Further, relaxometry studies potentially offer a more detailed characterization of tissue, compared with conventional qualitative or weighted imaging approaches. The purpose of this review is to briefly review the biophysical basis of relaxation, focusing specifically on the T1, T2 and T2* relaxation times, and to detail some of the more widely used and clinically feasible techniques for their in vivo measurement. We will focus on neuroimaging applications, though the methods described are equally well suited to cardiac, abdominal and musculoskeletal imaging. Potential sources of error, and methods for their correction, are also touched on. Finally, the combination of relaxation time data with other complementary quantitative imaging data, including diffusion tensor imaging, is discussed, with the aim of more thoroughly characterizing brain tissue.
Keywords: Quantitative Magnetic Resonance Imaging, T1, T2, Human Brain Imaging, Multi-Component Relaxometry
INTRODUCTION
The acquisition of T1 or T2 weighted images, and interpretation of the associated image information and tissue contrast, is familiar to the majority of clinicians and imaging scientists. However, the underlying biophysical processes that ultimately give rise to this contrast, and their relationships to tissue biochemistry and microstructure, remain poorly understood. Further, whilst qualitative T1 and T2 weighted imaging is pervasive in the clinical and research domains, quantitative mapping of these intrinsic relaxation parameters remains nascent despite many potential advantages.
In conventional qualitative T1 and T2 weighted imaging, tissue contrast is created by adjusting the sensitivity of the acquired signal to differences in the tissue relaxation times. Variation in signal sensitivity is commonly achieved through the choice of pulse sequence and manipulation of acquisition parameters (e.g. flip angle, echo time, repetition time, inversion time, etc.) (Fig. 1). However, whilst the resultant signal may be preferentially weighted towards T1, T2 or proton spin density (ρ) differences, the signal contrast depends on a mixture of ρ, T2, and T2*, as well as extraneous factors. These factors include acquisition parameters, receiver coil geometry and sensitivity and signal amplifier gains (Fig. 2). This nonlinear blend of signal sources, coupled with inconsistent hardware corruption, renders the physical interpretation of signal contrast or intensities changes challenging, Further, it precludes any direct comparisons of intensity values across subjects, time-points or imaging centers.
Figure 1.

Variation in T1 weighted signal contrast is typically achieved through manipulation of acquisition parameters and pulse sequence type. For example, (a) SPGR TE/TR/flip angle = 1ms/15ms/3 degrees; (b) SPGR TE/TR/flip angle = 1ms/15ms/18 degrees; (c) IR TE/TR/TI = 10/2500/500ms; (d) IR TE/TR/TI = 10/1800/850ms.
Figure 2.

Though weighted towards tissue T1 differences, the contrast in the T1 weighted SPGR image still contains contributions from proton density (with incorporated radio frequency coil sensitivity) as well as excitation flip angle variation.
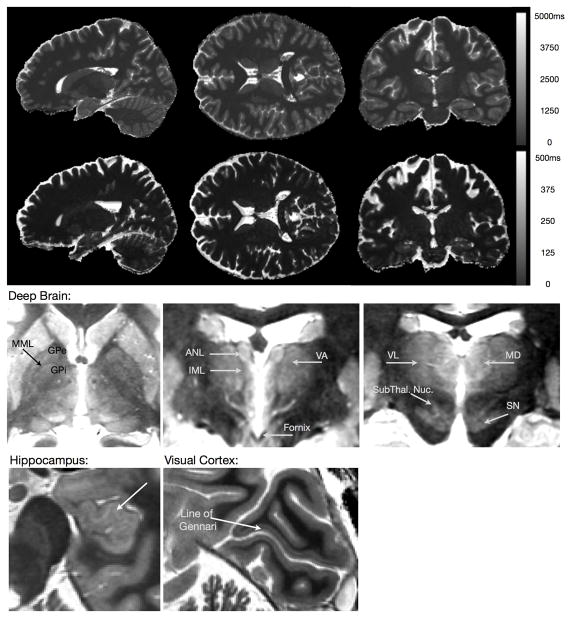
Interpretation of imaging data may be simplified by separating these independent sources through direct calculation of the proton density and spin relaxation times. The acquisition of ρ, T1, or T2 ‘maps’, such as those shown in Fig. 3, can facilitate improved characterization of tissue, enhance image tissue contrast, and provide a more direct link between the observed signal changes and the micro-anatomical alterations distinguished via histochemistry and histology. Further, the quantitative nature of the data allows ready comparison across longitudinal time points and against population-derived norms, as well as permitting more meaningful interpretation of intensity changes. In this review, we will highlight these potential advantages following a brief review of the biophysical basis of relaxation. Methods for map acquisition and analysis will be examined and a summary of significant neuroimaging results will be presented.
Figure 3.
(TOP) Representative quantitative T1 and T2 maps of the brain acquired using the DESPOT1 & DESPOT2 methods with incorporated B0 and B1 field corrections at 3 Tesla. Total acquisition time was 12 minutes for the whole brain (1×1×1)mm3 resolution maps. (BOTTOM) Axial, sagittal, and coronal slices through a high resolution T1 map, demonstrating the image contrast quantitative imaging can provide.
Prior to delving into this work, a word first about notation and terminology. Throughout this text we use the term relaxometry to refer to the quantitative measurement of relaxation times, as has become the common convention. However, prior to the advent of imaging, and in other applications of magnetic resonance, relaxometry referred to the study of the processes and mechanisms that give rise the relaxation phenomena.
BIOPHYSICAL BASIS OF RELAXATION
When a collection of proton spins are placed in a strong external magnetic field, B0, the individual spins align either parallel or anti-parallel to the field. At equilibrium, slightly more protons align in the parallel orientation, resulting in a small net magnetic vector. If tilted away from the direction of B0, this vector precesses about the external field at the Larmor frequency, ⌈0, equal to B0 multiplied by the proton gyromagnetic ratio (~42.59 MHz / Tesla for proton spins). In practice, a radio-frequency (RF) pulse applied at ⌈0 tilts the magnetic vector away from B0 and into the transverse plane and causes the individual spins to align in orientation (become phase coherent). When the RF pulse is removed, the magnetization recovers back to equilibrium, with the individual spins returning to their original parallel or anti-parallel direction and de-phasing in the transverse plane. T1 processes govern the re-growth of the longitudinal magnetization while T2 processes describe the loss of phase coherence in the transverse magnetization (Fig 4).
Figure 4.
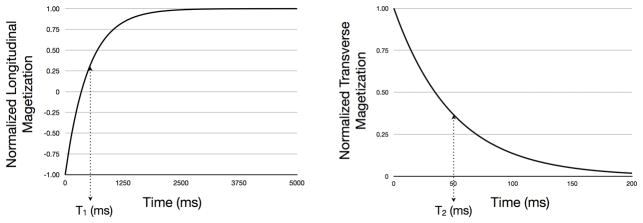
(a) Recovery of the longitudinal magnetization and (b) decay of the transverse magnetizations following 180 degree and 90 degree RF pulses, respectively. After time T1, the longitudinal magnetization has recovered to 63% of its equilibrium value. During time T2, the transverse magnetization relaxes 63% from its initial value to its equilibrium value of 0.
Intrinsically, relaxation is a process of molecular motion, interaction and energy exchange (1). In the case of proton (H1) MRI, T1 relaxation involves an exchange of energy between water protons and the surrounding lipids, proteins and macromolecules (collectively referred to as the ‘lattice’). Hence, T1 is also referred to as the spin-lattice relaxation time. T2 relaxation, in contrast, refers to the de-phasing of the water protons due to interactions between them. As individual spins move within an ensemble, they experience small variations in their local magnetic fields due to each others presence. These small variations cause the collection to slowly de-phase. Accordingly, T2 is termed the spin-spin relaxation time. In addition to spin-spin interactions, de-phasing can also be induced by macroscopic inhomogeneities in the applied magnetic field. This macroscopic de-phasing is termed T2’, and the combined effect of T2 and T2’ is referred to as T2* (where 1/T2* = 1/T2 + 1/T2’).
As both T1 and T2 arise from molecular motion and proton-proton interactions, they are directly influenced by the local biophysical structure and biochemical environment. In particular, amongst other microstructural characteristics T1 and T2 depend on the local tissue density (i.e. water content and mobility), macromolecule, protein and lipid composition, paramagnetic atom (e.g iron) concentration. Thus, changes in T1 and T2 can be indicative of change associated with disease, pathology, or other biological process (neurodevelopment, learning and neuroplasticity, or aging and neurodegeneration). For example, the lipid rich myelin sheath and associated proteins, cholesterol, iron containing oligodrendrocytes and glial cells, combined with reduced free water content, are primarily responsible for the shorter T1 and T2 of white matter compared to grey matter (2). Similarly, differing concentrations of iron, principally in the form of ferritin, gives rise to the T1, T2 and T2* variations observed between deep grey matter structures (3,4). Developmental changes, including myelination de-myelination axonal growth and gyrification, as well as pathological processes including edema, inflammation, tumor infiltration, iron accumulation, and necrosis all alter the local tissue structure and biochemistry. Consequently, these processes can result in substantial relaxation time changes (5, 2, 6–9).
Though seemingly obvious, it was not until 1971, some 33 years after the discovery of the NMR phenomenon (10), that disparate tissues were shown to have differing relaxation characteristics 53) and that they were altered by pathology.
ACCELERATED METHODS FOR T1 AND T2 MEASUREMENT
Whilst the gold standard approaches to T1 and T2 measurement remain multiple inversion-time inversion recovery (IR) and multiple echo-time spin-echo, respectively, these methods require lengthy acquisition times making them clinically prohibitive. The desire to study pathology using quantitative T1 and T2 metrics, however, has spurred the development of alternative, more rapid mapping approaches.
Of potential T1 mapping strategies, perhaps the most widely utilized is the method of Look and Locker (11). Proposed in 1970, this technique offers a subtle but important difference from the conventional IR approach. Rather than allowing the longitudinal magnetization to fully (or mostly) recover between successive inversion RF pulses, as in IR, the Look-Locker approach continuously samples the recovering magnetization with a series of small angle RF pulses. Thus, the T1 recovery curve is fully characterized following a single inversion pulse. Due to disturbing nature of the RF pulses, the magnetization recovery follows an apparent T1, or T1*, related to T1 in a known way, and reaches a steady state that is different from the thermal equilibrium value.
An alternative to the Look-Locker method, which does away with the inversion pulse and the concept of measuring a ‘true’ recovery curve, is the method of variable flip angles, or driven equilibrium single pulse observation of T1 (DESPOT1) (12). Here a series of SPoiled Gradient Recalled echo, SPGR, or spoiled FLASH (Fast Low Angle Single sHot), are acquired over a range of flip angles (α) whilst the repetition time is held constant. Provided adequate transverse magnetization spoiling is employed (or TE ≫ T2), these data provide a signal intensity curve characterized only by T1 and ρ. Christensen (12) first proposed the use of this unconventional T1 ‘recovery curve’ to characterize T1, and the method has been subsequently refined and optimized by a number of authors (13–18).
Similar in concept to the variable flip angle method for T1, variable flip angle bSSFP (fully balanced Steady State Free Precession) (19) acquisitions can also allow calculation of T2. With constant echo and repetition times, the bSSFP signal vs. α curve is characterized by T1, p and T2, If T1 is known a priori, T2 can be readily calculated (16).
The mixed contribution of T1 and T2 to the bSSFP signal, however, also provides opportunity for their combined calculation. With the addition of an inversion pulse, to increase the T1 dependence, a sequence analogous to the Look-Locker approach is obtained (20–22). Here, the signal is driven back to an altered equilibrium via an apparent T1, T1*, related to the true T1 and T2. From this complex relationship, both T1 and T2 may be estimated.
Additional methods, which make use of rapid echo-planar or spiral imaging techniquess to further increase imaging speed have also been proposed and are routinely used (23–26, for example).
Using these, as well as other less conventional approaches, T1 and T2 alterations have been investigated in a number of neurological disorders and pathology, offering insight into disease-related alterations in tissue microstructure.
QUANTITATIVE RELAXOMETRY IN THE CLINICAL AND NEUROSCIENCE REALMS
Although formulas relating tissue T1 and T2 to the biochemistry and structure of the tissue remain to be established, this fundamental link underpins the utility of quantitative T1 and T2 imaging to identify, investigate, diagnose and monitor pathology. Within the brain, the utility of T1 and T2 has been previously demonstrated in Multiple Sclerosis (MS), epilepsy, dementia, as well as in neurodevelopment.
MULTIPLE SCLEROSIS
Perhaps one of the most successful illustrations of quantitative relaxometry applied clinically is in the context of multiple sclerosis (MS). Characterized by focal white and grey matter lesions in the brain and spinal cord, MS is a neurodegenerative and neuroinflammatory disorder. White matter lesion areas correspond to areas of damaged, reduced, or lost myelin. Whilst grey matter lesions are also present, their role in the disorder is less well understood and, until the recent increased prevalence of high field strength (i.e. 7T) scanners, have only been visualized through histological means.
The loss of the lipid rich myelin sheath, and its subsequent replacement by free water, inflammatory cells and other proteins, results in substantive focal alteration in T1, T2 and T2*. Lesion areas, therefore, typically present as hypo-intense on T1 weighted, or hyper-intense on T2 weighted images. Based on the known influence of lipid, macro-molecule and free water content on T1 and T2, relaxation times have been proposed as potential surrogate markers of disease activity in treatment monitoring and therapeutic trials. Though alterations within lesion sites have produced only weak associations with disease extent and activity, investigation of T1 and T2 in the surrounding “normal appearing”, or abnormal “dirty appearing” white matter have revealed wide-spread and global alterations in T1 and T2, suggestive of unseen tissue disruption (27,28).
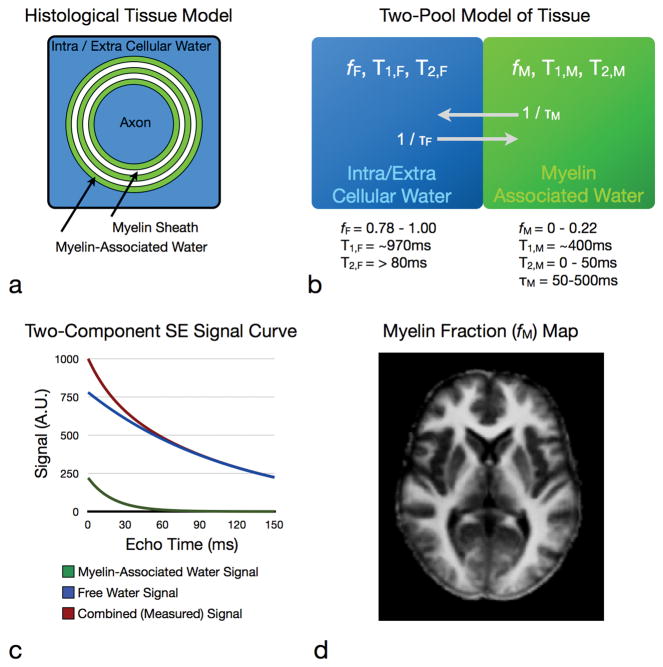
As MS is inherently a disorder of myelin, a more direct investigation of myelin content could provide a more tangible assessment of disease activity. In the preceding discussion, we assumed the magnetization relaxation in each image voxel was adequately described by a single T1 or T2 time. In complex biological systems, such as brain parenchyma, water is highly compartmentalized into discrete anatomical sub-domains, each with unique biophysical and biochemical properties. These differing characteristics impart unique T1, T2 and T2* relaxation properties onto the water protons residing within them. Thus, each anatomical domain provides a distinct MR signal signature, with the overall measured signal representing a volume weighted average of these individual contributions. Further, if the boundaries between these compartments are water permeable, water may readily exchange between them. The resulting complex signal decay is ill-described by a single T1 or T2 value (29).
Multicomponent relaxometry (MCR) analysis (illustrated in Fig. 5) attempts to model these independent signal contributors, providing a potent method for investigating sub-voxel tissue microstructure (30–32). Within brain and spinal cord, MRC analysis of T2 and, more recently T1 and T2*, relaxation data has yielded two distinct and reproducible water environments. Based on concomitant imaging and histology studies (33,34), the identified compartments are broadly attributed to the less-restricted intra and extra-cellular water; and water trapped within the lipid bilayers of the myelin sheath. The ability to non-invasively quantify this myelin-associated compartment immediately suggests that MCR might be useful in the study of MS (Fig. 6).
Figure 5.
Multicomponent relaxation theory and practice. A simple model of brain tissue contains two water components, free intra and extra-cellular water (blue) and water trapped between the lipid bilayers of the myelin sheath (green). The measured MR signal contains contributions from each of these water pools. MCR aims to reconstruct these individual contributions and quantify the volume of the myelin water pool (right).
Figure 6.
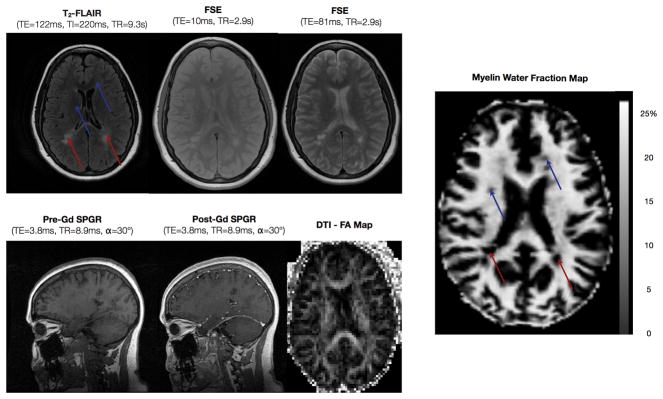
Images routinely acquired in MS (including T2-FLAIR, long and short echo time FSE, pre and post contrast SPGR and diffusion tensor fractional anisotropy) shown alongside a myelin water fraction image. Areas of reduced myelin may be readily appreciated in the myelin fraction image, which can correspond to hyper-intensities (red arrows), as well as areas not visible on conventional clinical images (blue images).
MCR, therefore, has played a significant (albeit to date, a primarily research) role in investigating myelin loss associated with MS disease progression (35–40). In addition to expected focal myelin reductions in lesion areas, MCR has revealed significant reductions in myelin content with normal appearing white matter, and has shown the potential to discriminate between acute, chronic and active, and chronic and inactive lesion subtypes. The reader is referred to a more thorough review of MCR in MS provided by MacKay et al. (41), a pioneer in the field of MCR analysis.
EPILEPSY
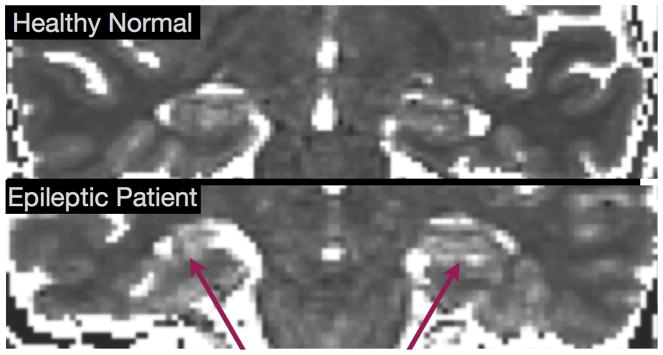
Hippocampal sclerosis (HS), or atrophy of the hippocampus, is the most common cause of temporal lobe epilepsy. Although HS is usually associated with increased signal intensity in T2 weighted images, the ambiguity of T2 weighted signal changes hinders definitive diagnosis (42). As an adjunct to conventional weighted acquisitions, quantitative T2 imaging in normal and pathological hippocampal tissue has proved an effective method for detecting and monitoring hippocampal structure changes (43).
Prolongation lobe T1 and T2 in the temporal lobe (see Fig. 7), as well as throughout the brain hemisphere containing the seizure focus, has been reported in epileptic patients, compared with healthy controls; (44, 45). These results intimate a potential role for quantitative T1 imaging in conjunction with electroencephalography (EEG) in identifying and localizing seizure foci.
Figure 7.
Comparison of Hippocampal T2 maps from healthy (top) and epileptic (bottom) individuals showing the prolonged T2 of the HS patient.
DEMENTIA AND ALZHEIMER’S DISEASE
T1 and T2 have been found to be altered in most dementia sub-types, including vascular dementia, dementia with Lewy bodies and Alzheimer’s Disease (AD). The iron composition of beta amyloid plaque deposits, the classic neuropathological hallmark of AD, has been proposed as a sufficient contrast mechanism to allow their visualization. Unfortunately, to date, direct plaque visualization has only been possible in animal models or in vitro specimens (46), or at ultra high field strengths (i.e. 7T). Measurement of more diffuse changes in T2 within the hippocampus and basal ganglia, caused by aggregate accumulation of plaques, however, may reduce the need for direct plaque visualization (47).
In addition to plaque deposits, white matter hyper-intensities are also commonly observed in AD (48). Whilst the exact mechanisms underpinning these white matter changes remain unknown, a predominant hypothesis suggests a vascular origin (49). A recent disease model forwarded by Bartzokis (50), however, suggests white matter and demyelination may play an underlying etiological role in this traditionally grey matter centric disorder. Indirect support for this myelin hypothesis has been the observation of T2 increases (presumably due to decreased myelin and increased free water content) throughout the white matter of subjects reporting memory loss and confirmed AD patients (51).
NEURODEVELOPMENT AND HEALTHY AGING
An area of increasing clinical interest is brain development in early infancy. One hypothesized substrate for a variety of psychiatric disorders, including autism, developmental delay, and attention deficit and hyperactivity disorder, is disrupted or abnormal connectivity of the complex neurological systems that underlay higher order emotional, social or behavioural functions (52,53). Mediating this connectivity are the myelinated white matter pathways, which develop throughout the first years of life. Quantitatively monitoring the maturation of these pathways, in association with behaviour, may offer new insights into the spatial and temporal origins of these disorders.
The earliest reports of magnetic resonance imaging in neurodevelopment demonstrated progressive changes in white and grey matter contrast on conventional T1 and T2 weighted imaging over the first year of life (54–57). The decrease in both T1 and T2 throughout the first years is believed to reflect to the increased presence of lipids, cholesterol and other constituents of the myelin sheath; and reduced free water content (i.e. increased water compartmentalization). Unfortunately, the proliferation of multi-channel and surface RF coil arrays, and their associated inhomogeneous signal profiles, makes appreciation of tissue signal and contrast changes difficult and ambiguous. Further, qualitative comparisons of signal intensity are inherently limited.
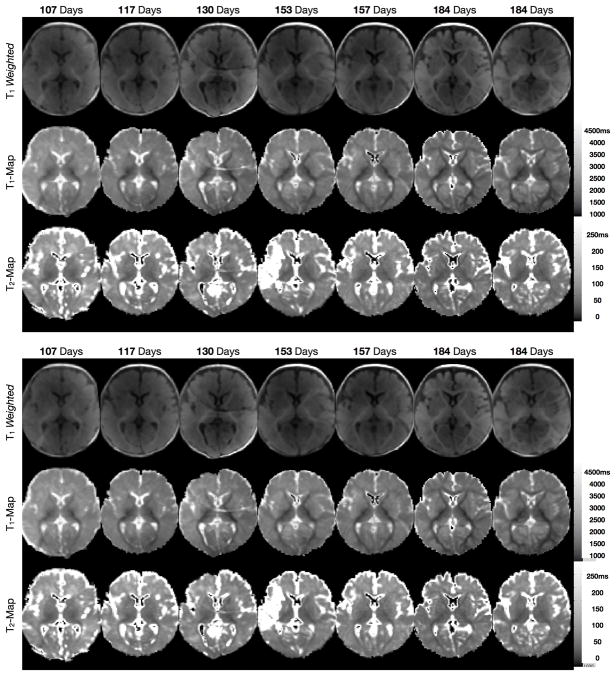
Quantitative evaluation of T1 and T2 throughout neurodevelopment can provide a less ambiguous appreciation of age related change and maturation, and can highlight the different sensitivity of T1 and T2. For example, Fig. 8 shows a comparison of qualitative T1 weighted SPGR images; and T1 and T2 maps from 11 healthy infants between the ages of 3 and 11 months (58).
Figure 8.

Comparison of conventional T1 weighted images with quantitative T1 and T2 maps obtained from healthy infants spanning the developmental period from 3 through 11 months.
Investigations of relaxation measures across the lifespan has been presented by Saito et el (59), demonstrating not only the expected rapid decrease in T1 and T2 over the first five years of life, followed by a more shallow decrease until approx. 35–40 years of age, but also a subsequent increase in relaxation parameters into old age (59) (Fig. 9). This increase, which Bartzokis and colleagues have correlated with age-related reductions in processing speed (60) is thought to reflect a loss in brain myelination and other neurodegenerative processes (61). It should be noted, however, that Bartozkis’ work is based on single-component (i.e. global) T2 measures, increases of which are hypothesized to correspond to decreases in myelin content. Comparing T2 and MCR myelin water fraction (MWF) estimates in heathy infants, Deoni and colleagues showed poor correlations between T2 and MWF (62), casting doubt on Barkzokis’ straightforward interpretation.
Figure 9.
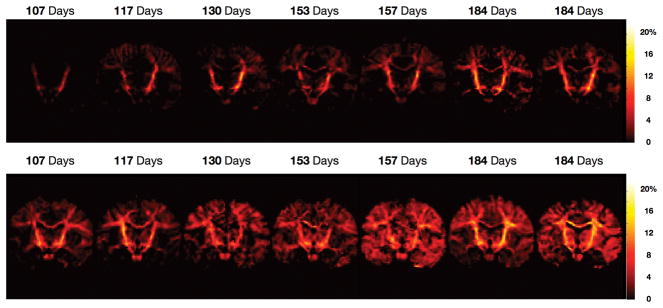
Coronally oriented myelin water fraction maps obtained from healthy infants spanning the developmental period from 3 through 11 months.
More direct assessment of myelination throughout the first months of life can also be performed using multicomponent relaxometry analysis. Figure 9 shows representative myelin fraction maps obtained from different healthy male and female infants across the first 11 months. Alternative imaging methods, including diffusion tensor and magnetization transfer imaging have also been proposed as myelination monitoring methods.
With knowledge of the “healthy” lifespan T1 and T2 trajectories, quantitative comparisons with neurodevelopmental, as well as neurodegnerative, disorders may be performed, and may improve our understanding of age related brain change.
SOURCES OF ERROR IN T1 AND T2 MEASUREMENTS
The clinical utility of relaxation time imaging, however, depends on a number of factors. Foremost amongst these is the ability to provide data with high reproducibility and accuracy. Whilst rapid T1 and T2 mapping techniques afford clinically feasible imaging times, a number of sources of error must be considered and accounted for in order to ensure the required reproducibility.
FLIP ANGLE INHOMOGENEITY
Accurate and precise relaxation time measurement requires careful consideration of potential sources of error and corrective techniques to mitigate their effects. The more egregious pitfalls include flip angle error; residual or incoherent transverse magnetization; and flow and movement.
Accelerated measurement techniques generally utilize small flip angle RF pulses to sample the magnetization, and incorporate the flip angle value itself into the T1 or T2 calculation. Thus, accurate knowledge of the applied flip angle is essential for correct T1 or T2 estimation. Deviations of the transmitted flip angle from the intended (i.e. ‘prescribed’) value arise from two main sources: RF pulse profile errors; and RF attenuation and tissue dielectric effects.
The ideal excitation profile is a boxcar or rect function, providing the desired flip angle across the excited volume or slice and zero elsewhere. Unfortunately, the achieved profile is less than this ideal; with the transmitted flip angle varying across the volume or slice. For three-dimensional (3D) volumetric acquisitions, this profile effect can be tolerated if the anatomy of interest lies within the centre portion of the excited slab, where the flip angle is approximately uniform and of the desired value. For single and multiple 2D slice applications, this profile effect will yield variation through the image slice, with the measured signal becoming an integrated function of flip angle (63).
RF coil geometry and RF attenuation and dielectric resonance effects also lead to deviations of the intended flip angle throughout the image volume. Asymmetric RF coils have non-uniform RF power profiles resulting in the flip angle varying with distance from the coil. Finally, dielectric resonance (RF penetration) effects also result in variations in the transmitted flip angle and increase in severity as the main magnetic field strength increases.
Minimization of flip angle related errors can be achieved through improved RF pulse design (64); use of B1 insensitive pulses (65,66); numerical RF modeling (63); or calibration of the transmitted flip angle field (67). Optimized RF pulse design, such as SLR pulses (64), provide idealized excitation profiles, minimizing the fall-off regions at the edges of the slab. In single-slice applications, Parker et al. showed how the flip angle could be numerically modeled and accounted for in T1 measurements (63). Composite or fast passage adiabatic pulses, which are less sensitive to RF amplitude, offer more uniform flip angles profiles. However, these pulses require lengthy pulse durations and can have high energy deposition.
Quantitative measurement of the transmitted flip angle has received increased attention with the move to higher magnetic field strengths and has benefited from a proliferation of rapid techniques. The most common of these techniques, the double-angle approach, acquires two spin-echo images with α and 2α flip angles. Through a trigonometric relationship, α is determined through the ratio of signal intensities. Rapid volumetric approaches, such as (68–71) also provide robust calculation of the flip angle field and are fast enough to be used in combination with a quantitative T1 or T2 experiment.
RESIDUAL AND INCOHERENT TRANSVERSE MAGNETIZATION
For accurate T1 measurement, the influence of T2 and T2* effects must be minimized. Stimulated echoes are echoes arising from previous RF pulses. Generally, when the inter-pulse time (TR) is greater than 5 x T2 (and T2*), little phase coherence remains amongst the proton spins. Thus, the transverse magnetization is de-phased or naturally spoiled. However, when TR is much less than T2, as is usually the case with accelerated T1 measurement techniques, residual transverse magnetization remains at the end of the TR interval. This remaining magnetization, which left unchecked will introduced undesired T2 weighting into the signal. This magnetization may also give rise to stimulated echoes (72), further corrupting the signal.
In addition to residual transverse magnetization at the end of the TR interval, incoherence of the transverse magnetization can further corrupt T1 and T2 measures. In some sequences, such as fully balanced steady-state free precession (bSSFP), the transverse magnetization is not destroyed at the end of each TR interval. Rather, it is left to build up over multiple TR intervals. However, if the phase of the transverse magnetization is not the same after each TR period, the magnetization does not add perfectly. This results in the well-known bSSFP banding artifact (73), and effects any relaxation measurement based on this signal.
Residual and incoherent transverse magnetization, therefore, will corrupt the T1 and T2 estimates made using the Look-Locker, DESPOT1, DESPOT and IR-SSFP methods. To eliminate residual magnetization, a combination of RF (74) and gradient spoiling (75) is generally used and are common and essential features of most SPGR and spoiled FLASH pulse sequences. Eliminating incoherence within the magnetization is more difficult (requiring a near perfectly uniform magnetic field throughout the object). One common approach to dealing with bSSFP off-resonance and banding artifacts is the use of a technique called RF phase-cycling (76) (Fig. 10). Deoni et al. have shown how this technique can be used to calculate artifact-free T2 maps through a more complete modeling of the bSSFP signal (77).
Figure 10.
Illustration of RF pulse phase-cycling in SSFP.. Incrementing the phase of each RF pulse shifts the spatial location of signal bands (yellow arrows). The maximum intensity projection of two SSFP images acquired with different phase-cycling patterns (phase angles) can produce an artifact-free image (right-most panel).
BULK MOVEMENT AND FLOW
Subject motion has the expected consequences on image quality, that is ghosting and blurring artifacts, which can similarly bleed through to calculated relaxation time maps. Motion can be particularly troublesome in single-slice acquisitions, where the slice location may differ between inversion times, echo times, or flip angles. Beyond bulk motion, physiological motion including blood flow can introduce more subtle artifacts and T1 and T2 biases.
Accelerated measurement methods that utilize steady-state imaging techniques require the establishment of a magnetization steady-state. In some methods, thorough spoiling of the transverse magnetization is also necessary. In moving tissues, these conditions may be violated. Depending on the extent and rate of flow, spins within blood may have exited the volume before reaching a steady-state. Further, the flow of spins through the imaging and spoiling gradients may result in incomplete spoiling or, worse, refocused magnetization.
In volumetric applications, the flowing magnetization is more likely to evolve to steady-state as it navigates the image volume, leaving only subtle artifact near the leading edge of the volume. In single-slice or multiple 2D slice applications, this artifact can be far more serious. Saturation bands can be used to null the flowing signal immediately outside the slice of interest. However, it is unlikely flowing blood will achieve adequate steady-state before exiting the slice, making 2D approaches ill-suited to quantifying blood T1 or T2.
INADEQUATE STEADY-STATE
The majority of accelerated T1 and T2 measurement techniques utilize steady-state imaging techniques. In methods based on rapid SPGR or bSSFP acquisitions, for example, the magnetization is first driven to a dynamic equilibrium and then sampled. Establishment of this steady-state generally requires a duration of T1, though catalyst approaches may reduce this time (78), during which non-sampling “dummy” pulses are applied. Failure to ensure adequate steady-state prior to acquisition can result in signal oscillations throughout k-space (presenting as ghosting in the reconstructed image); and incorrect T1 or T2 estimation (as the steady-state signal models become inappropriate).
With suitable appreciation for these principal sources of error, artifact-free T1 and T2 maps may be obtained with high accuracy and reproducibility. Such maps enable a wide range of analysis and direct comparisons, which may identify regions of change not evident on conventional images.
ANALYSIS AND INTERPRETATION OF RELAXATION DATA
Depending on the spatial extent and resolution of the acquired maps, comparisons can be at the whole-brain, hemispheric, regional, white matter tract or voxel-wise levels. In addition to group comparisons, a powerful attribute of relaxation data is the ability to perform single subject comparisons against population norms without requiring correction for scanner hardware, acquisition strategy, etc., (79).
The overwhelming majority of clinical and research structural neuroimaging studies involve normal-pathology comparisons to determine 1) if there is a difference in brain structure associated with the condition; 2) where in the brain those differences are manifest; and 3) how identified differences vary with degree of pathology. To address these basic questions, a number of approaches, each with differing levels of sensitivity and detail, have been devised.
HISTOGRAM-BASED COMPARISONS
Histogram-based approaches offer a straight-forward means of addressing the most basic question: is there a difference between normal and disease (80)? Advantageous as they require no spatial normalization (alignment of images from each participant) and require no a priori hypothesis as to where changes might be expected, histograms provide an intuitive and direct means for visualizing group differences.
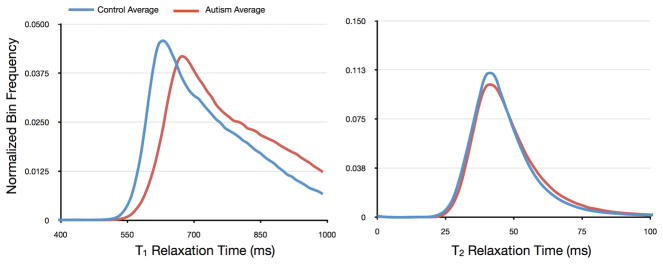
Calculation of T1 or T2 histograms, simply the frequency of binned values, is straightforward. Correction for brain volume is accomplished by normalizing the bin frequencies by the total number of voxels included in the histogram (or, area under the histogram curve). Averaged patient and control histograms can be visually and statistically compared, with standard metrics of comparison including mean; median; mode; skewness; kurtosis; peak height and peak location. An example histogram-based comparison of white matter T1 and T2 in healthy adolescents and adolescents with autism is shown in Fig. 11.
Figure 11.
Histogram-based comparison of whole-brain white matter T1 (left) and T2 (right) in healthy young adults and those with autism. The T1 histogram reveals a global increase in T1 in autism.
The primary disadvantages of histogram-based comparisons are that they provide no spatial information as regards to where identified differences exist, and are only sensitive to large-scale (global) tissue changes as focal changes are likely to be obscured when included with whole-brain data.
VOXEL-BASED COMPARISONS
The primary disadvantage of histogram-based approaches is the lack of spatial information. An approach to address this deficit of information is to compare values within pre-defined regions of interest, or more generally, to treat each voxel as an independent region of interest, and perform voxel-wise comparisons (81).
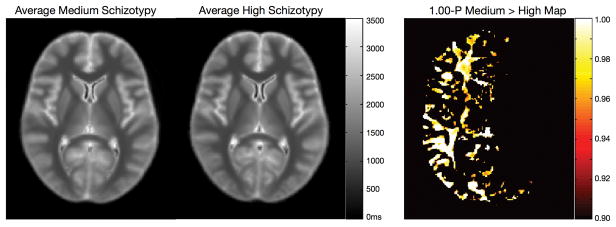
Following linear or non-linear spatial normalization of patient and control image data (81, 82), voxel-wise t-tests (or a non-parameter equivalent) with appropriate correction for multiple comparisons (81, 83), can identify regions of group difference. The ability to examine the whole-brain, without requiring consideration of a priori hypotheses, offers tremendous potential for speculative or exploratory studies where affected regions may not be known before hand.
An example voxel-based comparison of T1 and T2 in schizotypy is shown in Fig. 12, demonstrating hemispheric differences in the relaxation times in normal vs. high schizotypy groups.
Figure 12.

Voxel-based T1 comparison of medium and high schizotypy patients. Voxels showing a significant difference following multiple comparison correction are shown in the far right panel (1-p-Value map).
TRACT-BASED COMPARISONS
A common theme in neuroimaging research is the use of a connectionist approach to understand neurological or psychiatric disorders (84). This approach entails consideration of the white matter tracts which connect the disparate brain regions comprising integrated neuronal networks and brain systems. While voxel-based approaches can elucidate regions of differences, these regions may contain multiple independent white matter pathways connecting different grey matter regions. Thus, additional information may be gleaned by considering the T1 and T2 characteristics along specific tracts of interest (85, 86).
Two common approaches for isolating specific white matter pathways are the use of digitized atlases (87,88); or the combined acquisition of relaxation and diffusion tensor imaging (DTI) data (89). Diffusion imaging provides estimates of local fiber orientation (89). By stitching these independent orientation measures together (tractography), three-dimensional representations of the white matter paths may be reconstructed (90).
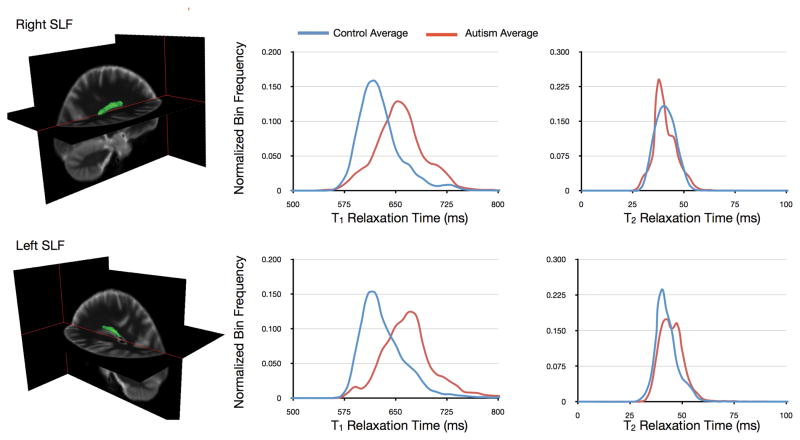
Using either atlas or tractography data to supply regions of interest, T1 and T2 values within these regions can be obtained and statistical comparisons made. As an example, Fig. 13 shows comparison of T1 and T2 histogram data for the left and right Superior Longitudinal Fasiculi in patients with autism and healthy age and sex-matched controls.
Figure 13.
Tract-specific comparison of T1 and T2 in the right and left superior longitudinal fasciculi (shown as the green volume rendering superimposed on the anatomical images) in healthy young adults and those with autism. Histograms of values along these tracts demonstrate substantive alteration in T1 and T2.
COMPARISON WITH POPULATION NORMS
In a variety of disorders, group-wise comparisons are difficult or ill-posed. For example, multiple sclerosis is characterized by acute focal white and grey matter lesions occurring throughout the brain and spinal cord (91). In many instances, however, from a disease monitoring or prognosis perspective, it is not the lesions themselves that are of interest, but the surrounding ‘normal appearing’ white matter (92). Voxel-wise comparisons across groups is not appropriate given the near random location of lesions. While histogram-based approaches are useful, they lack the spatial information necessary to pin-point affected brain regions.. In these cases, it is preferable to perform subject-specific analysis, comparing each subject with a matched population average.
Similar to group-wise comparisons, the population mean and variance can be determined from spatially normalizing healthy participant data (matched for age, sex, handedness, etc. as required). Identification of voxels or regions that differ substantively from the population norm can be determined through straightforward voxel-wise z-tests. Illustrated in Fig. 14 comparison of T1 data from an MS against a matched population average demonstrates how this form of analysis can reveal white matter regions that appear normal on conventional clinical T1 and T2 weighted scans that are, in fact, substantially affected (93).
Figure 14.
Single subject T1 analysis of an MS (relapsing remitting, EDSS score of 4) patient. The population average and variance were calculated from 18 healthy age-matched controls. Z-score analysis reveals significant distribution in cerebral white matter that appears normal in the patient’s clinical FLAIR image.
In addition to multiple sclerosis, conditions characterized by sparse or random pathology, for example stroke and cancer, may benefit from this form of analysis.
CONCLUSIONS
Quantitative imaging offers a number of advantages over more conventional qualitative or weighted imaging approaches, including simplicity of analysis, quantitative and population-based comparisons, and more direct interpretation of detected changes. Recent acquisition techniques coupled with appreciation of, and correction for, relevant sources of error have made the acquisition of whole-brain high spatial resolution quantitative T1 and T2 maps a clinically feasible alternative to conventional T1 or T2-weighted imaging. Analysis of these maps is in its infancy; however, we can draw inspiration from other quantitative imaging techniques, such as proton emission tomography (PET), to glimpse the rich information contained within these data. Further, when combined with alternative MR-based imaging techniques, including diffusion tensor MRI and MR spectroscopy, a more complete picture of brain structure, architecture and metabolism may be formed. Imaging protocols comprising each of these elements will be ideally positioned to assess tissue alternation in pathology.
Acknowledgments
The author receives research support through an MRC UK Career Development Fellowship (G0800298) as well as the National Institutes of Mental Health (R01 MH087510). A special thanks is extended to those who provided clinical examples and imaging data used herein: Prof. Derek Jones, Dr. Janneke Zinkstok, Dr. Marco Catani, Dr. Emma Burkus, Dr. Mark Richardson, Katrina McMullin, Catherine Traynor and Sarah Kwan.
References
- 1.Bloembergen N, Purcell EM, Pound RV. Relaxation Effects in Nuclear Magnetic Resonance Absorption. Phys Rev. 1948;73:679–715. [Google Scholar]
- 2.Paus T, Collins DL, Evans AC, Leonard G, Pike B, Zijdenbos Maturation of White Matter in the Human Brain: A Review of Magnetic Resonance Studies. Brain Res Bull. 2001;54:255–266. doi: 10.1016/s0361-9230(00)00434-2. [DOI] [PubMed] [Google Scholar]
- 3.Gelman N, Ewing JR, Gorell JM, Spickler EM, Solomon EG. Interregional Variation of Longitudinal Relaxation Rates in Human Brain at 3.0T: Relation to Estimated Iron and Water Contents. Magn Reson Med. 2001;45:71–79. doi: 10.1002/1522-2594(200101)45:1<71::aid-mrm1011>3.0.co;2-2. [DOI] [PubMed] [Google Scholar]
- 4.Gelman N, Gorell JM, Barker PB, Savage RM, Spickler EM, et al. MR Imaging of the Human Brain at 3.0T: Preliminary Report on Transverse Relaxation Rates and Relation to Estimated Iron Content. Radiology. 1999;210:759–767. doi: 10.1148/radiology.210.3.r99fe41759. [DOI] [PubMed] [Google Scholar]
- 5.Damadian RV. Tumor Detection by Nuclear Magnetic Resonance. Science. 1971;171:1151. doi: 10.1126/science.171.3976.1151. [DOI] [PubMed] [Google Scholar]
- 6.Naoko S, Sakai O, Ozonoff A, Jara H. Relaxo-volumetric Multispectral Quantitative Magnetic Resonance Imaging of the Brain over the Human Lifespan: Global and Regional Aging Patterns. Mag Reson Imaging. 2009;27:895–906. doi: 10.1016/j.mri.2009.05.006. [DOI] [PubMed] [Google Scholar]
- 7.Williams LA, Gelman N, Picot PA, Lee DS, Ewing JR, et al. Neonatal Brain: Regional Variability of In Vivo MR Imaging Relaxation Rates at 3.0T - Initial Experience. Radiology. 2005;235:595–603. doi: 10.1148/radiol.2352031769. [DOI] [PubMed] [Google Scholar]
- 8.Hoque R, Ledbetter C, Gonzalez-Toledo E, Misra V, Menon V, et al. The Role of Quantitative Neuroimaging Indices in the Differentiation of Ischemia from Demyelination: An Analytical Study with Case Presentation. Int. Rev. Neurobiol. 2007;79:491–519. doi: 10.1016/S0074-7742(07)79022-0. [DOI] [PubMed] [Google Scholar]
- 9.Li Y, Srinivasan R, Ratiney H, Lu Y, Chang SM, Nelson SJ. Comparison of T1 and T2 Metabolite Relaxation Times in Glioma and Normal Brain at 3T. J Magn Reson Imaging. 2008;28:342–350. doi: 10.1002/jmri.21453. [DOI] [PMC free article] [PubMed] [Google Scholar]
- 10.Rabi II, Zacharias JR, Millman S, Kusch P. A New Method of Measuring the Nuclear Magnetic Moment. Phys Rev. 1938;53:318. doi: 10.1002/jmri.1880020203. [DOI] [PubMed] [Google Scholar]
- 11.Look DC, Locker DR. Time Saving in Measurement of NMR and EPR Relaxation Times. Rev Scient Instr. 1970;41:250–251. [Google Scholar]
- 12.Christensen KA, Grand DM, Schulman EM, Walling C. Optimal Determination of Relaxation Times of Fourier Transform Nuclear Magnetic Resonance. Determination of Spin-Lattive Relaxation Times in Chemically Polarized Species. J Phys Chem. 1974;78:1971–1977. [Google Scholar]
- 13.Homer J, Beevers MS. A Re-Evaluation of a Rapid ‘New’ Method for Determining NMR Spin-Lattice Relaxation Times. J Magn Reson. 1985;63:287–297. [Google Scholar]
- 14.Wang HZ, Riederer SJ, Lee JN. Optimizing the Precision in T1 Relaxation Estimation using Limited Flip Angles. Magn Reson Med. 1987;5:399–416. doi: 10.1002/mrm.1910050502. [DOI] [PubMed] [Google Scholar]
- 15.Homer J, Roberts JK. Routine Evaluation of Mo Ratios and T1 Values from Driven Equilibrium NMR Specta. J Magn Reson. 1990;87:265–272. [Google Scholar]
- 16.Deoni SCL, Rutt BK, Peters TM. Rapid Combined T1 and T2 Mapping Using Gradient Recalled Acquisition in the Steady State. Magn Reson Med. 2003;49:515–526. doi: 10.1002/mrm.10407. [DOI] [PubMed] [Google Scholar]
- 17.Deoni SCL, Peters TM, Rutt BK. Determination of Optimal Angles for Variable Nutation Proton Magnetic Spin-Lattice, T1, and Spin-Spin, T2, Relaxation Times Measurement. Magn Reson Med. 2004;51:194–199. doi: 10.1002/mrm.10661. [DOI] [PubMed] [Google Scholar]
- 18.Chang LC, Koay CG, Basser PJ, Pierpaoli C. Linear Least-Squares Method for Unbiased Estimation of T1 from SPGR Signals. Magn Reson Med. 2008;60:496–501. doi: 10.1002/mrm.21669. [DOI] [PMC free article] [PubMed] [Google Scholar]
- 19.Carr HY. Steady-State Free Precession in Nuclear Magnetic Resonance. Phys Rev. 1958;112:1693–1701. [Google Scholar]
- 20.Scheffler K, Hennig J. T1 Quantification with Inversion Recovery TrueFISP. Magn Reson Med. 2001;45:720–723. doi: 10.1002/mrm.1097. [DOI] [PubMed] [Google Scholar]
- 21.Deimling M, Heid O. Magnetization Prepared True FISP Imaging. Proceedings of the 2nd annual meeting of the ISMRM; San Fransico. 1994. p. 495. [Google Scholar]
- 22.Schmitt P, Griswold MA, Jakob PM, Kotas M, Gulani V, et al. Inversion Recovery TrueFISP: Quantification of T1, T2 and Spin Density. Magn Reson Med. 2004;51:661–667. doi: 10.1002/mrm.20058. [DOI] [PubMed] [Google Scholar]
- 23.Preibisch C, Deichmann R. T1 Mapping Using Spoiled FLASH-EPI Hybrid Sequences and Varying Flip Angles. Magn Reson Med. 2009;62:240–246. doi: 10.1002/mrm.21969. [DOI] [PubMed] [Google Scholar]
- 24.Shin W, Gu H, Yang Y. Fast High Resolution T1 Mapping Using Inversion-Recovery Look-Locker Echo-Planar Imaging at Steady-State: Optimization for Accuracy and Reliability. Magn Reson Med. 2009;61:899–906. doi: 10.1002/mrm.21836. [DOI] [PMC free article] [PubMed] [Google Scholar]
- 25.Ropele S, Bammer R, Stollberger R, Fazekas F. T1 Maps from Shifted Spin Echoes and Stimulated Echoes. Magn Reson Med. 2001;46:165–170. doi: 10.1002/mrm.1323. [DOI] [PubMed] [Google Scholar]
- 26.Huang TY, Lui YJ, Stemmer A, Poncelet BP. T2 Measurement of the Human Myocardium using a T2-Prepared Transient State TrueFISP Sequence. Magn Reson Med. 2007;57:96–966. doi: 10.1002/mrm.21208. [DOI] [PubMed] [Google Scholar]
- 27.Manfredonia F, Ciccarelli O, Khaleeli Z, Tozer DJ, Saste-Garriga J, et al. Normal Appearing Brain T1 Relaxation Time Predicts Disability in Early Primary Progressive Multiple Sclerosis. Arch Neurol. 2007;64:411–415. doi: 10.1001/archneur.64.3.411. [DOI] [PubMed] [Google Scholar]
- 28.Ropele S, Strasser-Fuchs S, Augustin M, et al. A comparison of magnetization transfer ratio, magnetization transfer rate, and the native relaxation time of water protons related to relapsing-remit- ting multiple sclerosis. AJNR Am J Neuroradiol. 2000;21:1885–1889. [PMC free article] [PubMed] [Google Scholar]
- 29.Whittall KP, MacKay AL, Li DKB. Are Mono-Exponential Fits to a Few Echoes Sufficient to Determine T2 Relaxation for In Vivo Human Brain? Magn Reson Med. 1999;43:1255–1257. doi: 10.1002/(sici)1522-2594(199906)41:6<1255::aid-mrm23>3.0.co;2-i. [DOI] [PubMed] [Google Scholar]
- 30.MacKay A, Laule C, Vavasour I, Bjarnason T, Kolind S, Madler B. Insights into Brain Miscrostructure from the T2 Distribution. Magn Reson Imaging. 2006;24:515–525. doi: 10.1016/j.mri.2005.12.037. [DOI] [PubMed] [Google Scholar]
- 31.Kroeker RM, Henkelman RM. Analysis of Biological NMR Relaxation Data with Continuous Distributions of Relaxation Times. J Magn Reson. 1986;69:218–235. [Google Scholar]
- 32.Menon RS, Rusinko MS, Allen PS. Multiexponential Proton Relaxation in Model Cellular Systems. Magn Reson Med. 1991;20:196–213. doi: 10.1002/mrm.1910200204. [DOI] [PubMed] [Google Scholar]
- 33.Laule C, Leung E, Lis DK, Traboulsee AL, Paty DW, et al. Myelin Water Imaging in Multiple Sclerosis: Quantitative Comparison with Histopathology. Mult Scler. 2006;12:747–753. doi: 10.1177/1352458506070928. [DOI] [PubMed] [Google Scholar]
- 34.Webb S, Munro CA, Midha R, Stanisz GJ. Is Multicomponent T2 a Good Measure of Myelin Content in Peripheral Nerve. Magn Reson Med. 2003;49:638–645. doi: 10.1002/mrm.10411. [DOI] [PubMed] [Google Scholar]
- 35.Vavasour IM, Laule C, Li DK, Oger J, Moore GR, Traboulsee A, Mackay AL. Longitudinal Changes in Myelin Water Fraction in two MS Patients with Active Disease. J Neurol Sci. 2009;15:49–53. doi: 10.1016/j.jns.2008.08.022. [DOI] [PubMed] [Google Scholar]
- 36.Laule C, Kozlowski P, Leung E, Li DK, MacKay AL, Moore GR. Myelin Water Imaging of Multiple Sclerosis at 7T: Correlations with Histopathology. NeuroImage. 2008;40:1575–1580. doi: 10.1016/j.neuroimage.2007.12.008. [DOI] [PubMed] [Google Scholar]
- 37.Vavasour IM, Li DK, Laule C, Traboulsee AL, Moore GR, MacKay AL. Multi-parametric MR Assessment of T1 Black Holes in Multiple Sclerosis: Evidence that Myelin Loss is not Greater in Hypointense Versus Hyperintense T1 Lesions. J Neurol. 2007;254:1653–1659. doi: 10.1007/s00415-007-0604-x. [DOI] [PubMed] [Google Scholar]
- 38.Moore GR, Laule C, MacKay AL, Leung E, Li DK, et al. Dirty Appearing White Matter in Multiple Sclerosis: Preliminary Observations of Myelin Phospholipid and Axonal Loss. J Neurol. 2008;255:1802–1811. doi: 10.1007/s00415-008-0002-z. [DOI] [PubMed] [Google Scholar]
- 39.Laule C, Vavasour IM, Moore GR, Oger J, Li DK, Paty DW, MacKay AL. Water Content and Myelin Water Fraction in Multiple Sclerosis. A T2 Relaxation Study. J Neurol. 2004;251:284–293. doi: 10.1007/s00415-004-0306-6. [DOI] [PubMed] [Google Scholar]
- 40.Laule C, Vavasour IM, Zhao Y, Traboulsee AL, Oger J, et al. Two-Year Study of Cervical Cord Volume and Myelin Water in Primary Progressive Multiple Sclerosis. Mult Scler. 2010;16:670–677. doi: 10.1177/1352458510365586. [DOI] [PubMed] [Google Scholar]
- 41.Mackay AL, Vavasour IM, Rauscher A, Kolind SH, Madler B, et al. MR Relaxation in Multiple Sclerosis. Neuroimaging Clin N Am. 2009;19:1–26. doi: 10.1016/j.nic.2008.09.007. [DOI] [PubMed] [Google Scholar]
- 42.Reutens DC, Stevens JM, Kingsley D, Kendall B, Mose-ley I, et al. Reliability of visual inspection for the detection of volumet- ric hippocampal asymmetry. Neuroradiology. 1996;38:221–225. doi: 10.1007/BF00596533. [DOI] [PubMed] [Google Scholar]
- 43.Jackson GD, Connelly A, Duncan JS, Gruenewald RA, Gadian DG. Detection of hippocampal pathology in intractable partial epilepsy: increased sensitivity with qualitative magnetic resonance T2 relaxometry. Neurology. 1993;43:1793–1799. doi: 10.1212/wnl.43.9.1793. [DOI] [PubMed] [Google Scholar]
- 44.Conlon P, Trimble MR, Rogers D, Callicot C. Magnetic Resonance Imaging in Epilepsy: A Controlled Study. Epilepsy Reson. 1988;2:37–43. doi: 10.1016/0920-1211(88)90008-3. [DOI] [PubMed] [Google Scholar]
- 45.Townsend TN, Bernasconi N, Pike GB, Bernasconi A. Quantitative Analysis of Temporal Lobe White Matter T2 Relaxation Time in Temporal Lobe Epilepsy. NeuroImage. 2004;23:318–324. doi: 10.1016/j.neuroimage.2004.06.009. [DOI] [PubMed] [Google Scholar]
- 46.Jack CR, Jr, Wengenack TM, Reyes DA, Garwood M, Curran GL, et al. In Vivo Magnetic Resonance Microimaging of Individual Amyloid Plaques in Alzheimer’s Transgenic Mice. J Neurosci. 2005;25:10041–10048. doi: 10.1523/JNEUROSCI.2588-05.2005. [DOI] [PMC free article] [PubMed] [Google Scholar]
- 47.Schenck JF, Zimmerman EA. High-Field Magnetic Resonance Imaging of Brain Iron: Birth of a Biomarker? NMR Biomed. 2004;17:433–445. doi: 10.1002/nbm.922. [DOI] [PubMed] [Google Scholar]
- 48.Duan JH, Wang HQ, Xu J, Lin X, Chen SQ, et al. White Matter Damage of Patients with Alzheimer’s Disease Correlated with Decreased Cognitive Function. Surg Radiol Anat. 2006;28:150–156. doi: 10.1007/s00276-006-0111-2. [DOI] [PubMed] [Google Scholar]
- 49.Millonis HJ, Florentin M, Giannopoulos S. Metabolic Syndrome and Alzheimer’s Disease: A Link to a Vascular Hypothesis? CNS Spectr. 2008;13:606–613. doi: 10.1017/s1092852900016886. [DOI] [PubMed] [Google Scholar]
- 50.Barkzokis G, Lu PH, Mintz J. Human Brain Myelination and Amyloid Beta Deposition in Alzheimer’s Disease. Alzheimer’s & Dem. 2007;3:122–125. doi: 10.1016/j.jalz.2007.01.019. [DOI] [PMC free article] [PubMed] [Google Scholar]
- 51.House MJ, St Pierre TG, Foster JK, Matrins RN, Clarnette R. Quantitative MR Imaging R2 Relaxometry in Elderly Participants Reporting Memory Loss. AJNR. 2006;27:430–439. [PMC free article] [PubMed] [Google Scholar]
- 52.Hughes JR. Autism: The First Firm Finding = Underconnectivity? Epilepsy Behav. 2007;11:20–24. doi: 10.1016/j.yebeh.2007.03.010. [DOI] [PubMed] [Google Scholar]
- 53.Kana RK, Keller TA, Cherkassky VL, Minshew NJ, Just MA. Sentence Comprehension in Autism: Thinking in Pictures with Decreased Functional Connectivity. Brain. 2006;129:2484–2493. doi: 10.1093/brain/awl164. [DOI] [PMC free article] [PubMed] [Google Scholar]
- 54.Dietrich RB, Bradlet WG, Zaragoza EJ, Otto RJ, Taira RK, Wilson GH, Kangarloo MR Evaluation of Early Myelination Patterns in Normally and Developmentally Delayed Infants. JNR. 1987;150:889–896. doi: 10.2214/ajr.150.4.889. [DOI] [PubMed] [Google Scholar]
- 55.Ballesteros MC, Hansen PC, Soila K. MR Imaging of the Developing Human Brain. Part 2. Postnatal Development. RadioGraphics. 1993;13:611–622. doi: 10.1148/radiographics.13.3.8316668. [DOI] [PubMed] [Google Scholar]
- 56.Paus T, Collins DL, Evans AC, Leonard G, Pike B, Zijdenbos A. Maturation of White Matter in the Human Brain: A Review of Magnetic Resonance Studies. Brain Res Bull. 2001;54:255–266. doi: 10.1016/s0361-9230(00)00434-2. [DOI] [PubMed] [Google Scholar]
- 57.Huang H, Zhang J, Wakana S, Zhang W, Ren T, Richards LJ, Yarowsky P, Donohue P, Graham E, van Zijl PC, More S. White and Gray Matter Development in Human Fetal, Newborn and Pediatric Brains. NeuroImage. 2006;33:27–38. doi: 10.1016/j.neuroimage.2006.06.009. [DOI] [PubMed] [Google Scholar]
- 58.Deoni SCL, Mercure E, Blasi A, Gasston D, Thomson A, et al. Mapping Infant Brain Myelination with Magnetic Resonance Imaging. J Neurosci. 2011;12:784–791. doi: 10.1523/JNEUROSCI.2106-10.2011. [DOI] [PMC free article] [PubMed] [Google Scholar]
- 59.Saito N, Sakai O, Ozonoff A, Jara H. Relaxo-Volumetric Multispectral Quantitative Magnetic Resonance Imaging of the Brain over the Human Lifespan: Global and Regional Aging Patterns. Magn Reson Imaging. 2009;27:895–906. doi: 10.1016/j.mri.2009.05.006. [DOI] [PubMed] [Google Scholar]
- 60.Bartzokis G, Lu PH, Tungus K, Mendez MF, Klunder AD, et al. Lifespan Trajectory of Myelin Integrity and Maximum Motor Speed. Neurobiol, Aging. 2010;31:1554–1562. doi: 10.1016/j.neurobiolaging.2008.08.015. [DOI] [PMC free article] [PubMed] [Google Scholar]
- 61.Barkzokis G, Lu PH, Mintz J. Quantifying Age-Related Myelin Breakdown with MRI: Novel Therapeutic Targets for Preventing Cognitive Decline and Alzheimer’s Disease. J Alzheimer’s Dis. 2004;6:S53–S59. doi: 10.3233/jad-2004-6s604. [DOI] [PubMed] [Google Scholar]
- 62.Deoni SCLI, Mercure E, Blasi A, Gasston D, Thomson A, et al. Investigating the Relationships between T1, T2 and Myelin Water Fraction in Early Infancy. Proceedings 17th Annual Meeting of the ISMRM; Stockholm Swe. 2010. p. 2060. [Google Scholar]
- 63.Parker GJ, Barker GJ, Tofts PS. Accurate Multislice Gradient Echo T1 Measurement in the Presence of Non-Ideal RF Pulse Shape and RF Field Nonuniformity. Magn Reson Med. 2001;45:838–845. doi: 10.1002/mrm.1112. [DOI] [PubMed] [Google Scholar]
- 64.Pauly P, Le Roux P, Nishimura D, Macovski A. Parameter Relations for the Shinnar-Le Roux Selective Excitation Pulse Design Algorithm. IEEE Trans Med Imag. 1991;10:53–65. doi: 10.1109/42.75611. [DOI] [PubMed] [Google Scholar]
- 65.Madhuranthakam AJ, Busse RF, Brittain JH, Rofsky NM, Alsop DC. B1-Insensitive Fast Spin-Echo Using Adiabatic Square Wave Enabling of the Echo Train (SWEET) Excitation. Magn Reson Med. 2008;59:1386–1393. doi: 10.1002/mrm.21630. [DOI] [PubMed] [Google Scholar]
- 66.Garwood M, Ugurbil K, Rath AR, Bendall MR, Ross BD, Mitchell SL, Merkle H. Magnetic Resonance Imaging with Adiabatic Pulses Using a Single Surface Coil for RF Transmission and Signal Detection. Magn Reson Med. 1989;9:25–34. doi: 10.1002/mrm.1910090105. [DOI] [PubMed] [Google Scholar]
- 67.Insko EK, Bolinger L. Mapping of the Radiofrequency Field. J Magn Reson Ser A. 1993;103:82–85. [Google Scholar]
- 68.Jiru F, Klose U. Fast 3D Radiofrequency Field Mapping Using Echo-Planar Imaging. Magn Reson Med. 2006;56:1375–1379. doi: 10.1002/mrm.21083. [DOI] [PubMed] [Google Scholar]
- 69.Morrell GR. A Phase-Sensitive Method of Flip Angle Mapping. Magn Reson Med. 2008;60:889–894. doi: 10.1002/mrm.21729. [DOI] [PubMed] [Google Scholar]
- 70.Cunningham CH, Pauly JM, Nayak KS. Saturated Double-Angle Method for Rapid B1+ Mapping. Magn Reson Med. 2006;55:1326–1333. doi: 10.1002/mrm.20896. [DOI] [PubMed] [Google Scholar]
- 71.Deoni SCL. High Resolution T1 Mapping of the Brain at 3T with Driven Equilibrium Single Pulse Observation of T1 with High-Speed Incorporation of RF Field Inhomogeneities (DESPOT1-HIFI) J Magn Reson Imaging. 2007;26:1106–1111. doi: 10.1002/jmri.21130. [DOI] [PubMed] [Google Scholar]
- 72.Matthaei D, Frahm J, Haase A, Merboldt KD, Hanicke W. Multipurpose NMR Imaging Using Stimulated Echoes. Magn Reson Med. 1986;3:553–561. doi: 10.1002/mrm.1910030409. [DOI] [PubMed] [Google Scholar]
- 73.Carr HY. Steady-State Free Precession in Nuclear Magnetic Resonance. Phys Rev. 1958;112:1693–1701. [Google Scholar]
- 74.Denolin V, Azizieh C, Metens T. New Insights into the Mechanisms of Signal Formation in RF Spoiuled Gradient Echo Sequences. Magn Reson Med. 2005;54:937–954. doi: 10.1002/mrm.20652. [DOI] [PubMed] [Google Scholar]
- 75.Lin W, Song HK. Improved Signal Spoiling in Fast Radial Gradient Echo Imaging: Applied to Accurate T1 Mapping and Flip Angle Correction. Magn Reson Med. 2009;62:1185–1194. doi: 10.1002/mrm.22089. [DOI] [PubMed] [Google Scholar]
- 76.Ganter C. Steady State of Gradient Echo Sequences with Radiofrequency Phase Cycling: Analytical Solution, Contrast Enhancement with Partial Spoiling. Magn Reson Med. 2006;55:98–107. doi: 10.1002/mrm.20736. [DOI] [PubMed] [Google Scholar]
- 77.Deoni SCL. Transvrse Relaxation Time (T2) Mapping in the Brain with Off-Resonance Correction Using Phase-Cycled Steady-State Free Precession Imaging. J Magn Reson Imaging. 2009;30:411–417. doi: 10.1002/jmri.21849. [DOI] [PubMed] [Google Scholar]
- 78.Hargreaves BA, Vasanawala SS, Pauly JM, Nishimura DG. Characterization and Reduction of the Transient Response in Steady-State MR Imaging. Magn Reson Med. 2002;46:149–158. doi: 10.1002/mrm.1170. [DOI] [PubMed] [Google Scholar]
- 79.Deoni SCL, Williams SCR, Jezzard P, Suckling J, Murphy DG, Jones DK. Standardized Structural Magnetic Resonance Imaging in Multicentre Studies using Quantiative T1 and T2 Imaging at 1.5T. NeuroImage. 2008;40:662–671. doi: 10.1016/j.neuroimage.2007.11.052. [DOI] [PubMed] [Google Scholar]
- 80.van Buchem MA, McGowan JC, Grossman RI. Magnetization Transfer Histogram Methodology: Its Clinical and Neuropsychological Correlates. Neurology. 1999;53:S23–S28. [PubMed] [Google Scholar]
- 81.Ashburner J, Friston KJ. Voxel-Based Morphometry - The Methods. NeuroImage. 2000;11:805–821. doi: 10.1006/nimg.2000.0582. [DOI] [PubMed] [Google Scholar]
- 82.Jenkinson M, Bannister PR, Brady JM. Improved Optimization for the Robust and Fast Linear Registration and Motion Correction of Brain Images. NeuroImage. 2002;17:825–841. doi: 10.1016/s1053-8119(02)91132-8. [DOI] [PubMed] [Google Scholar]
- 83.Voormolem EH, Wei C, Chow EW, Bassett AS, Mikulis DJ, Crawley AP. Voxel-Based Morphometry and Automated Lobar Volumetry: The Trade-Off Between Spatial Scale and Statistical Correction. NeuroImage. 2009:18. doi: 10.1016/j.neuroimage.2009.07.018. (ahead of print) [DOI] [PMC free article] [PubMed] [Google Scholar]
- 84.Catani M, ffytche DH. The Rises and Falls of Disconnection Syndromes. Brain. 2005;128:2224–2239. doi: 10.1093/brain/awh622. [DOI] [PubMed] [Google Scholar]
- 85.Kanaan RA, Shergill SS, Barker GK, Catani M, Ng VW, et al. Tract-Specific Anisotropy Measurements in Diffusion Tensor Imaging. Psychiatry Res. 2006;146:73–82. doi: 10.1016/j.pscychresns.2005.11.002. [DOI] [PubMed] [Google Scholar]
- 86.Jones DK, Deoni SCL. T1 and T2 Along Specific Tracts of Interest. Proceedings 14th Annual Meeting of the ISMRM; Seattle USA. 2006. p. 1892. [Google Scholar]
- 87.More S, Oishi K, Jiang L, Li X, Akhter K, et al. Stereotactic White Matter Atlas Based on Diffusion Tensor Imaging in an ICBM Template. NeuroImage. 2008;40:570–582. doi: 10.1016/j.neuroimage.2007.12.035. [DOI] [PMC free article] [PubMed] [Google Scholar]
- 88.Catani M, Thiebaut de Schotten M. A Diffusion Tensor Imaging Tractography Atlas for Virtual In Vivo Dissections. Cortex. 2009;44:1105–1132. doi: 10.1016/j.cortex.2008.05.004. [DOI] [PubMed] [Google Scholar]
- 89.Basser PJ. Inferring Microsctructural Features and the Physiological State of Tissues from Diffusion-Weighted Images. NMR Biomed. 1995;8:333–344. doi: 10.1002/nbm.1940080707. [DOI] [PubMed] [Google Scholar]
- 90.Jones DK, Simmons A, Williams SC, Horsfield MA. Non-Invasive Assessment of Axonal Fiber Connectivity in the Human Brain Via Diffuion Tensor MRI. Magn Reson Med. 1999;42:37–41. doi: 10.1002/(sici)1522-2594(199907)42:1<37::aid-mrm7>3.0.co;2-o. [DOI] [PubMed] [Google Scholar]
- 91.akshi R, Thompson AJ, Rocca MA, Pelletier D, Dousset V, et al. MRI in Multiple Sclerosis: Current Status and Future Prospects. Lancet Neurol. 2008;7:615–625. doi: 10.1016/S1474-4422(08)70137-6. [DOI] [PMC free article] [PubMed] [Google Scholar]
- 92.Manfredonia F, Ciccarelli O, Khaleeli Z, Tozer DJ, Saste-Garriga J, et al. Normal Appearing Brain T1 Relaxation Time Predicts Disability in Early Primary Progressive Multiple Sclerosis. Arch Neurol. 2007;64:411–415. doi: 10.1001/archneur.64.3.411. [DOI] [PubMed] [Google Scholar]
- 93.Deoni SCL. Whole-Brain Analysis of Myelin Content in Multiple Sclerosis. Proceedings of 17th Annual Meeting of the ISMRM; Hawaii USA. 2009. p. 162. [Google Scholar]


