

Abstract
Tc1 mouse model of Down syndrome (DS) is functionally trisomic for ∼120 human chromosome 21 (HSA21) classical protein-coding genes. Tc1 mice display features relevant to the DS phenotype, including abnormalities in learning and memory and synaptic plasticity. To determine the molecular basis for the phenotypic features, the levels of 90 phosphorylation-specific and phosphorylation-independent proteins were measured by Reverse Phase Protein Arrays in hippocampus and cortex, and 64 in cerebellum, of Tc1 mice and littermate controls. Abnormal levels of proteins involved in MAP kinase, mTOR, GSK3B and neuregulin signaling were identified in trisomic mice. In addition, altered correlations among the levels of N-methyl-D-aspartate (NMDA) receptor subunits and the HSA21 proteins amyloid beta (A4) precursor protein (APP) and TIAM1, and between immediate early gene (IEG) proteins and the HSA21 protein superoxide dismutase-1 (SOD1) were found in the hippocampus of Tc1 mice, suggesting altered stoichiometry among these sets of functionally interacting proteins. Protein abnormalities in Tc1 mice were compared with the results of a similar analysis of Ts65Dn mice, a DS mouse model that is trisomic for orthologs of 50 genes trisomic in the Tc1 plus an additional 38 HSA21 orthologs. While there are similarities, abnormalities unique to the Tc1 include increased levels of the S100B calcium-binding protein, mTOR proteins RAPTOR and P70S6, the AMP-kinase catalytic subunit AMPKA, the IEG proteins FBJ murine osteosarcoma viral oncogene homolog (CFOS) and activity-regulated cytoskeleton-associated protein (ARC), and the neuregulin 1 receptor ERBB4. These data identify novel perturbations, relevant to neurological function and to some seen in Alzheimer's disease, that may occur in the DS brain, potentially contributing to phenotypic features and influencing drug responses.
INTRODUCTION
Down syndrome (DS) is caused by an extra copy of the long arm of human chromosome 21 (HSA21). The incidence of DS in the USA and Europe is ∼1/750 and 1/1000 live births, respectively, making DS the most common genetic cause of intellectual disability (ID) (1,2). Individuals with DS have impairments in hippocampal-based learning, executive function and language skills and, while ID can be mild, it is reflected in an average IQ of 40–50 (3–5). At birth, the brain in DS is described as grossly normal, but postnatal development slows and the adult brain in DS is characterized by decreased hippocampal and cerebellar volumes, decreased neuronal densities and altered dendritic spine morphologies (6,7). DS is also associated with relatively high incidences of autism (∼10%) and seizures (∼10%), plus early development of the neuropathology of Alzheimer's disease (AD) and an AD-like dementia (7,8).
The DS phenotype is assumed to be the result of over expression, due to increased copy number, of subsets of HSA21 genes that lack mechanisms for dosage compensation. HSA21, by recent genomic sequence annotation, encodes ∼550 genes (9). Of these, 161 are annotated as protein coding in SwissProt and NCBI RefSeq protein databases and 5 are annotated as microRNAs. Creating an ideal mouse model of DS, i.e. one that is trisomic for all HSA21 genes, is a challenge because orthologs of these genes are dispersed among regions of three mouse chromosomes. The five microRNA genes and 101 RefSeq protein-coding (RefSeqP) genes map to the telomeric region of mouse chromosome 16, and 19 and 38 RefSeqP genes map to internal segments of mouse chromosomes 17 and 10, respectively (9). Four HSA21 RefSeqP genes (POTED, TCP10L, DSCR4 and PLAC) are not conserved in the mouse genome.
As a solution to the challenge of creating a mouse trisomic for all three chromosomal regions orthologous to HSA21, the Tc1 DS model was constructed to contain a freely segregating human HSA21 (10). Thus, Tc1 mice carry the human orthologs, including the human-specific genes, in a background of a complete set of mouse chromosomes. Some deletions and rearrangements affecting ∼40 HSA21 genes occurred during construction of the model, and, as a result, Tc1 mice are functionally trisomic for 121 of the 161 RefSeq protein coding genes (10,11; and F.K.Wiseman, unpublished data). They show a number of DS-relevant phenotypic features, including short-term memory deficits and abnormalities in long-term potentiation (LTP) (10,12). Little is known about the molecular abnormalities that underlie these and other features described for the Tc1. Here, we describe patterns in abnormalities of 90 proteins, HSA21 and non-HSA21, in cortex and hippocampus, and 64 in cerebellum. Abnormalities include altered levels of proteins and altered correlations among levels of functionally related proteins. Furthermore, abnormalities in Tc1 mice differ considerably from those previously reported in the popular Ts65Dn mouse model of DS. These data suggest that the molecular basis of the phenotype of full trisomy 21, i.e. in individuals with DS, will differ from those of both the Tc1 and the Ts65Dn. This conclusion has implications for development of pharmacotherapies for cognitive deficits in DS.
RESULTS
HSA21 and orthologous protein expression
Table 1 lists proteins that were measured, with their levels in the cortex, hippocampus and cerebellum in Tc1 mice relative to controls. All antibodies to HSA21-encoded proteins were verified to cross-react with both human and mouse proteins; therefore, levels in Tc1 represent expression from two copies of the mouse gene plus that from the orthologous HSA21 gene. Of the 16 HSA21 proteins measured, genes for 11 are intact in the Tc1 chromosome and therefore these genes are functionally trisomic (10,11; F.K.Wiseman, unpublished data). Of these, only TIAM1, SOD1, DYRK1A and S100B proteins show the elevated levels expected from trisomy, compared with controls (Table 1; Fig. 1, for TIAM1 and S100B that were measured by western blots). Alternative splicing of TIAM1 transcripts produces five protein isoforms, migrating as a ∼200 kDa doublet, a ∼150 kDa doublet and a 70 kDa form (13). In addition, proteolytic processing produces a 75 kDa product (14). In hippocampus, all four bands are increased by a relatively uniform 41–75%, while in the cortex, the levels of increase vary from 21 to 85%. SOD1 levels average a 50% increase, but the levels in the hippocampus are highest at 75% and cerebellum lowest at 36%. DYRK1A levels range from a 57% increase in the cortex to 95% in cerebellum, consistent with a previous report (15). Finally, S100B levels were increased by 99 and 112% in the cortex and hippocampus, respectively. Although S100B has been reported to be duplicated in the Tc1 HSA21, protein levels remain only marginally higher than those seen for SOD1 and DYRK1A. In contrast to these four, proteins encoded by the remaining seven trisomic genes, such as CCT8, CHAF1B, ETS2, RRP1, FTCD, ADARB1 and PRMT2, show no differences in levels from controls (data not shown).
Table 1.
Tc1 protein expression
| Protein | CR | HP | CB | nc: CR, HP, CB | #nc: CR, HP |
|---|---|---|---|---|---|
| Hsa21 proteins | |||||
| TIAM1_200 | 38%*** | 41%*** | ND | APP, CCT8, DONSON, CHAF1B, ETS2, TRPM2, ADARB1, FTCD, PRMT2 | RRP1, RCAN1 |
| TIAM1_150 | 21%* | 45%*** | ND | ||
| TIAM1_75 | 44%** | 51%** | ND | ||
| TIAM1_70 | 85%*** | 70%** | ND | ||
| SOD1 | 43%*** | 75%*** | 36%*** | ||
| ITSN1 | 30%*** | 35%*** | 52%*** | ||
| DYRK1A | 57%*** | 67%*** | 95%*** | ||
| S100B | 99%*** | 112%*** | ND | ||
| Signaling proteins, phosphorylation dependent forms | |||||
| pERK1/2 (Tyr204) | 52%*** | 73%*** | 94%*** | pMEK1/2(Ser 217/221), pBRAF(Thr401), pRSK(Ser380), pAKT(Ser473), pCREB(Ser133), pJNK(Thr183/Tyr185), pCAMKIIA/B(Thr286), pGSK3B(Ser9), pPKCA/B(Thr638/641), pPKCG (Thr514), pMTOR(Ser2448), pP70S6(Thr389) | pS6(Ser240/244), pEIFB4(Ser422) |
| pELK1(Ser383) | 52%*** | 50%*** | 76%*** | ||
| pGSK3B(Tyr216) | 12%* | nc | ND | ||
| Signaling proteins, phosphorylation independent forms | |||||
| BRAF | 32%*** | 45%*** | 61%*** | ERK1/2, MEK1/2, RSK, CREB, AKT, JNK, CAMKII, PKCA, P35/25, CDK5, MTOR | S6 |
| GSK3B | 21%*** | 24%*** | 35%*** | ||
| P70S6 | 19%** | 17%*** | ND | ||
| AMPKA | nc | 13%* | ND | ||
| RAPTOR | nc | 12%** | ND | ||
| Apoptosis related | |||||
| BAD | −8%* | nc | nc | BCL2, CASP3, pCASP9(Ser196) | |
| BAX | nc | −14%*** | nc | ||
| Receptors | |||||
| ERBB4 | 11%**** | 19%*** | ND | TRKA, NR1, pNR1(Ser889), NR2A, pNR2A(Tyr1246), NR2B, pNR2B(Tyr1336), GluR3, GluR4, pGluR2(Tyr876) | RAGE |
| Immediate Early Genes | |||||
| cFOS | nc | 15%* | ND | EGR1 | |
| pCFOS | nc | 17%* | ND | ||
| ARC | nc | 14%* | ND | ||
| Miscellaneous | |||||
| pNUMB(Ser276) | −8%*** | nc | nc | NUMB, pGJA1(Ser368), SHH, SYP, CAT, GAD2, CTNNB1 | Ubiquitin, PSD95, pTau(Thr212), Histone H3(AcK9), Histone H3(AcK18), Histone H3(DMeK4), TH, IL1B |
| GFAP | −9%*** | nc | nc | ||
| BDNF | −9%*** | nc | nc | ||
| Tau | 27%*** | 29%*** | ND | ||
| A-Synuclein | 20%* | nc | ND | ||
| nNOS | 13%*** | 19%** | ND | ||
| PP2A | ND | 13%* | ND | ||
Levels are provided as averages for Tc1 relative to 100% in control mice.
CR, cortex; HP, hippocampus; CB, cerebellum. ND, not measured. nc, not changed in Tc1 versus controls. #nc: not changed in the cortex or hippocampus and not measured in cerebellum. TIAM1 isoforms, S100B and RAGE were measured by western blot and significant differences were determined using the unpaired Student t-test: *P < 0.05; **P < 0.01; ***P < 0.001. All other proteins were measured by RPA; significant differences using Bonferroni correction: *P < 0.0005; **P < 0.0001; ***P < 0.00001. nNOS, neuronal nitric oxide synthase.
Figure 1.

TIAM1 and S100B are overexpressed in Tc1 mice. Expression levels of HSA21 proteins TIAM1 and S100B, and the S100B receptor, RAGE, were examined by westerns blots. Representative gels are shown for (A) cortex, (C) hippocampus. For TIAM1, gels were 8% acrylamide to separate the four bands that range from 70 to ∼200 kDa; for S100B (12 kDa) and RAGE (46 kDa), gels were 12% acrylamide. Representative actin signals, used for normalization, are also shown. C, euploid control; T, trisomic Tc1. (B and D) Results of quantitation from two to three replicate gels as in (A) and (C). For comparison, euploid control values were set to 100%. The unpaired Student t-test was used to calculate the mean genotype differences; bars indicate standard error of the mean; *P < 0.05; **P < 0.01; ***P < 0.001.
The 11 trisomic genes are widely distributed within HSA21; CCT8, TIAM1, SOD1, CHAF1B and ETS2 map within an internal segment spanning ∼15 Mb on HSA21, and the remaining four map within a ∼2 Mb telomeric segment of HSA21 (9). Notably, the genes encoding S100B, which is overexpressed, and PRMT2, which is not overexpressed, are adjacent, organized 5′ to 5′, and separated by only 30 kb immediately telomere proximal on HSA21.
Three genes, DONSON, ITSN1 and RCAN1, are within the large HSA21 deletion that spans C21orf45 through RUNX1 (10,11; Supplementary Material, Table S6). As expected, DONSON and RCAN1 protein expression levels do not differ from controls. Interestingly, however, the levels of ITSN1 are elevated, in the cortex, hippocampus and cerebellum, to the levels comparable with those of proteins encoded by the trisomic genes, TIAM1, SOD1 and DYRK1A. There are no known mechanisms for regulation of ITSN1 expression by the genes trisomic in the Tc1. However, ITSN1 was recently shown to be one of the genes regulated by the neuregulin 1 receptor ERBB4 (16) and elevated ITSN1 may be caused by overexpression of ERBB4 in the Tc1 (see below). Alternatively, ITSN1 interacts with TIAM1 (17); it is possible that overexpression of TIAM1 indirectly drives increased ITSN1 expression, as has been observed in other cases of functionally interacting proteins (18). Finally, the APP gene is not deleted from the HSA21 chromosome, but rearrangements within the coding region inhibit transcription (15), and hence no human APP protein is produced and total APP levels are not elevated. Similarly, the TRPM2 gene, in distal HSA21, is also rearranged, and TRPM2 protein is not elevated.
Non-HSA21 ortholog protein expression
The goal of the protein measurements was to assess potential perturbations in pathways known or predicted to be relevant to learning/memory and other neurological abnormalities seen in DS or mouse models of DS. For direct comparison with prior studies, proteins chosen for analysis include those previously measured in the Ts65Dn (13), among them components of the MAP kinase pathway, subunits of the NMDA receptor complex, and proteins involved in nerve growth factor signaling, apoptotic responses and dendritic spine formation. We also measured proteins relevant to the pathology of AD, e.g. Tau and α-Synuclein, because AD is common in DS. While the APP gene, which is an obvious candidate for AD in DS, is not overexpressed in the Tc1, and neurodegeneration has not been reported, additional HSA21 genes that are uniquely trisomic in the Tc1 could also contribute to the development or progression of the AD pathology or cognitive decline that is seen in the DS brain. Lastly, we measured the products of several immediate early genes (IEGs) and additional components of the mTOR signaling pathway because altered expression of these at the mRNA or protein level has been reported in the Tc1, the Ts65Dn or another DS mouse model, the Ts1Cje (15,19,20).
Because Reverse Phase Protein Arrays (RPAs) require highly specific antibodies, not all proteins of interest could be measured. This was particularly the case for many antibodies raised against human proteins, where cross reactivity with orthologous mouse proteins was either undetectable or accompanied by high background or non-specific bands. Table 1 lists the 72 and 77 non-HSA21 proteins that were measured in the cortex and hippocampus (one by western blot), respectively, and the subset of 52 that were measured in the cerebellum. In some cases, pairs of antibodies directed at phosphorylation-dependent and phosphorylation-independent forms of the same protein were used. In total, 21 non-HSA21 proteins (∼30%) were significantly altered in one or more brain regions, and eight of these were altered in all brain regions analyzed.
Phosphorylated forms of 17 proteins that are components of signaling pathways were measured. Only three were altered. Levels of pERK1/2 and pELK1 each were robustly elevated, by 50% or more, in all three brain regions. Increases were highest, at 94 and 76%, respectively, in the cerebellum. Phosphorylation of other components of the classical MAP kinase pathway upstream of ERK, among them BRAF and MEK, were not altered, nor were phosphorylation levels of the downstream kinase, RSK, or the transcription factor CREB. No changes in phosphorylated levels of components of the mTOR pathway were seen, while pGSK3B-Tyr216, but not GSK3B-Ser9, was increased in the cortex. Other phosphorylation levels stable to the effects of the Tc1 trisomy were those of AKT, CAMKII, JNK and PKC.
Phosphorylation-independent levels of 17 signaling pathway components were measured. Elevated in all three brain regions were GSK3B and one component of the MAPK pathway, BRAF. Although the levels of mTOR remained normal, several proteins involved in mTOR signaling were altered significantly: P70S6 was elevated in the cortex and hippocampus, and RAPTOR and AMPKA in the hippocampus. Although, with the exception of pGSK3B-Tyr216, phosphorylated levels of these proteins were either not increased or not measured, these data still suggest altered proportions of active versus inactive forms of components of several signaling pathways.
Modest decreases of apoptosis-related proteins BAD and BAX were found in the cortex and hippocampus, respectively. Additional modest decreases were found in the cortex for phosphorylated NUMB, a protein that functions with HSA21 protein ITSN1 in regulation of dendritic spine morphology (21), and for BDNF and the glial-specific protein, GFAP.
Among 12 neurologically relevant receptors, no alterations were seen in either total or phosphorylated forms of TRKA, or subunits of the NMDA or AMPA receptors. In addition, although levels of the HSA21 protein S100B were significantly elevated, levels of its receptor, RAGE, were not. However, levels of ERBB4, the major receptor in brain for neuregulin 1 (NRG1)(22), were elevated in both the cortex and hippocampus. Other proteins of relevance to AD include significant increases in Tau, but not phosphorylated Tau, and neuronal NOS in the cortex and hippocampus, and α-Synuclein in the cortex. Finally, the IEG proteins, ARC, cFOS and phospho-cFOS, but not EGR1, were elevated specifically in the hippocampus.
Individual variation
Because the HSA21 chromosome segregates freely, the Tc1 mice are mosaics (10). Thus, the percentage of cells carrying the HSA21 can vary among tissues and will differ among mice. Without direct measurement, the level of mosaicism is unknown. The Tc1 mice, in addition, are not maintained on an inbred background and individuals will have a combination of 0, 1 or 2 alleles from C57BL/6J and 129/S8, plus the human allele. Among Tc1 mice, therefore, variations in protein levels may result from both the level of mosaicism and allelic variation, while only the latter contributes to variation among controls. Previous work with the Ts65Dn mouse model of DS has shown variability in protein and phosphorylation levels among individuals in the groups of trisomic mice and littermate controls (13, 23), and indeed patterns in such variability were used to predict variability in locomotor response to treatment with the NMDA receptor antagonist, MK-801 (24). We therefore investigated individual variation in the Tc1 mice. Data for several proteins are shown in Table 2. It is noteworthy, first, that even when mean genotype levels of a protein are greater in Tc1 mice than in controls, the lowest levels in trisomic mice are close to or overlapping with the highest levels in control mice. Secondly, for these same proteins, variation among individual Tc1 mice is greater than among controls. For example, in the cortex of control mice, levels of SOD1 range from 0.11 to 0.15, i.e. ∼1.3-fold, while in Tc1, they range from 0.14 to 0.27, almost 2-fold. Similar levels of variation are seen in the three brain regions for DYRK1A. A simple interpretation is that these levels reflect the proportion of cells carrying the HSA21 in the respective regions of individual mice. However, the levels of phosphorylated ELK1, a non-HSA21 protein, cannot be directly a result of mosaicism, and in the cortex, pELK1 levels vary from 0.20 to 0.32 (1.6-fold) and in trisomic mice, from 0.26 to 0.64 (2.5-fold). In the cerebellum, pELK1 levels vary from 0.24 to 0.43 (1.8-fold) in controls, and in trisomic mice from 0.3 to 1.08 (3.5-fold). Thirdly, for proteins that do not differ in mean levels between trisomic mice and controls, the range of levels among individuals typically is similar in Tc1 mice and controls. For example, APP in the hippocampus varies from 0.35 to 0.46 in controls and 0.36 to 0.45 in trisomic mice, and ARC in the cortex varies from 0.12 to 0.15 and 0.12 to 0.16 in controls and trisomics, respectively. Thus, elevated expression, whether directly or indirectly caused by trisomy, appears to result in a greater range of variability in expression among trisomic individuals. One exception to this observation is seen with the HSA21 protein RCAN1. RCAN1 is within the large HSA21 deletion and therefore is not trisomic in Tc1. Consistent with this, the mean levels of RCAN1 are not different between Tc1 and control genotypes. However, in both the cortex and hippocampus, there is again much greater variation in RCAN1 levels in Tc1 than in controls. Scatter plots in Figure 2 illustrate this in comparison with the levels for APP.
Table 2.
Range of expression levels for selected proteins
| Protein | Cortex |
Hippocampus |
Cerebellum |
|||
|---|---|---|---|---|---|---|
| Control | Tc1 | Control | Tc1 | Control | Tc1 | |
| APP | 0.41–0.54 | 0.41–0.48 | 0.35–0.46 | 0.36–0.45 | 0.39–0.47 | 0.37–0.45 |
| SOD1 | 0.11–0.15 | 0.14–0.27 | 0.1–0.12 | 0.16–0.23 | 0.11–0.2 | 0.15–0.23 |
| ITSN1 | 0.38–0.48 | 0.45–0.85 | 0.32–0.45 | 0.44–0.67 | 0.39–0.58 | 0.5–1.18 |
| DYRK1A | 0.19–0.26 | 0.26–0.54 | 0.16–0.25 | 0.26–0.46 | 0.21–0.36 | 0.31–0.99 |
| pERK1/2 | 0.34–0.53 | 0.44–1.23 | 0.24–0.45 | 0.46–1.01 | 0.36–0.7 | 0.56–1.9 |
| pELK1 | 0.20–0.32 | 0.26–0.64 | 0.19–0.27 | 0.28–0.47 | 0.24–0.43 | 0.3–1.08 |
| GSK3B | 0.99–1.23 | 1.14–1.84 | 0.83–1.19 | 1.1–1.5 | 0.91–1.25 | 1.09–2.22 |
| BRAF | 0.32–0.41 | 0.32–0.76 | 0.27–0.42 | 0.38–0.71 | 0.39–0.61 | 0.47–1.4 |
| MTOR | 0.39–0.43 | 0.37–0.42 | 0.31–0.37 | 0.31–0.36 | 0.34–0.39 | 0.33–0.37 |
| ERBB4 | 0.15–0.18 | 0.16–0.22 | 0.29–0.38 | 0.32–0.51 | ND | ND |
| ARC | 0.12–0.15 | 0.12–0.16 | 0.36–0.46 | 0.37–0.59 | ND | ND |
| pCFOS | 0.19–0.26 | 0.18–0.29 | 0.17–0.23 | 0.17–0.36 | ND | ND |
ND, not measured.
Figure 2.

Individual variation in levels of RCAN1 and APP. Scatter plots show that RCAN1 levels in Tc1 mice are more variable than in euploid controls. APP levels are shown for comparison. Nether RCAN1 nor APP are expressed from the Tc1 HSA21 chromosome and neither shows an average increase in Tc1 mice.
The within-genotype inter-individual variations are not necessarily random but rather show patterns among individuals. Bar graphs in Figure 3A–C illustrate this for expression of three HSA21 proteins in individual mice. Within a brain region, patterns of DYRK1A and ITSN1 are highly similar. For example, in the cortex, mice T4, T5 and T2 have the highest levels of both proteins while mice T1, T6 and T7 have the lowest. In contrast, in the hippocampus, the levels of DYRK1A and ITSN1 are highest in T5 and T2 but among the lowest in T4. SOD1 shows a different pattern, where in the cortex, mice T1 and T7 are highest and T2 and T5 are lowest. Therefore, factors in addition to or other than mosaicism are driving trisomic gene overexpression.
Figure 3.

Variation in protein expression levels. Levels of six proteins determined by RPA are shown in individual euploid controls (white bars) and Tc1 (black bars), in the cortex, hippocampus and cerebellum. Average levels of all six proteins in Tc1 relative to controls are given in Table 1. (A and C) DYRK1A and SOD1 are trisomic in Tc1 mice; (B) ITSN1 is deleted in the Tc1 chromosome and therefore functionally disomic; (D, E and F) Levels of non-HSA21 signaling proteins, pERK1/2, pELK and GSK3B.
To extend this analysis to non-HSA21 proteins, Figure 3D–F shows bar graphs for pERK, pELK1 and GSK3B. Not only are patterns of Tc1 variation clearly similar within and specific to each brain region, but these patterns are also similar to those of DYRK1A and ITSN1 in the same brain regions (Fig. 3A and B). A different scenario is presented by levels of proteins encoded by the IEGs, cFOS, ARC and phosphorylated-cFOS (Fig. 4). In the hippocampus where mean values are elevated in Tc1 compared with controls, the patterns of inter-individual variation are similar, e.g. mice T1 and T3 show the highest levels, while T5–T7 are the lowest. However, in the cortex, where protein levels in Tc1 consistently overlap with controls, patterns among Tc1 mice are not similar to each other (compare patterns in ARC with cFOS).
Figure 4.

Variation in IEG protein levels. Levels of non-HSA21 proteins (A) CFOS, (B) pCFOS and (C) ARC, determined by RPA, are shown in individual euploid controls (white bars) and Tc1 (black bars) in cortex and hippocampus. Relative to euploid controls, average levels of all three proteins are elevated in the hippocampus but not the cortex of Tc1.
Correlations among protein levels
The patterns shown in Figures 3 and 4 indicate relationships among the levels of these sets of functionally interacting proteins. We therefore investigated correlations between levels of all pairs of proteins in each genotype in each brain region. Using criteria of r > 0.82 and P < 0.05 (Spearman correlation analysis), 200 pairwise correlations were significant in the hippocampus, 125 in the cortex and 100 in the cerebellum (Supplementary Material, Table S3). After manual review of scatter plots to eliminate correlations with artifactual significance, we generated networks to illustrate correlations involving proteins with known functional associations. In Figure 5, networks of correlations among proteins from the MAP kinase cascade are shown. Notable are correlations among pERK, BRAF and the HSA21 proteins DYRK1A and ITSN1 that are conserved in the hippocampus and cortex in both control and Tc1 mice (Fig. 5a and b). Each of these four proteins are increased in the Tc1 but this has not altered correlations, with the exception of a loss of correlation between ITSN1 and DYRK1A in the hippocampus. In the hippocampus also, additional correlations are seen involving pBRAF, pRSK, pMEK, CREB and pCREB (Fig. 5C). Levels of none of these are altered in the Tc1; however, correlations are seen only in control mice and, with the exception of pRSK-CREB, are absent in Tc1. Given the observations of impaired learning and memory in the Tc1 mice, and the importance of hippocampal function and the MAP kinase pathway in learning and memory (25), perturbed stoichiometry among pathway components presents one possible molecular feature underlying the deficits.
Figure 5.

Correlations among HSA21 proteins ITSN1 and DYRK1A and components of the MAP kinase signaling cascade. (A) cortex; (B and C) hippocampus. Correlations with r> 0.8, with linear scatter plots and P < 0.05 (Spearman correlation analysis) were considered significant and are shown. Heavy solid lines, correlations seen in controls and Tc1; thin solid lines, correlations seen only in controls; dashed lines, correlations seen only in Tc1. All correlations are positive. Grey circles, HSA21 proteins; open circles, non-HSA21 proteins. Phosphorylation-dependent and -independent forms are shown separately. Asterisk indicates average levels are increased in Tc1 with respect to controls.
Figure 6A shows a network containing NMDA receptor subunits with similarly significant correlations. Again in the hippocampus, while seven pairwise correlations among NMDA receptor subunits and their phosphorylated forms are present in both controls and the Tc1, three correlations are lost in the Tc1. Notable also in Tc1 mice is the loss of correlations between the HSA21 protein APP and four NMDA receptor subunits. This is surprising because the levels of APP are not altered in the Tc1. However, also notable in Figure 6A are the Tc1-specific, negative correlations between NMDA receptor subunits and isoforms of TIAM1, a guanine nucleotide exchange factor with specificity for RAC (26). All isoforms of TIAM1 are elevated in the Tc1 (Fig. 1A, Table 1), but the direct correlations with NMDAR subunits involve only the smallest isoform, a 70 kDa protein, and the product of caspase-3 cleavage, the 75 kDa protein. The functional consequences of the large TIAM1 isoforms have not been distinguished, but caspase cleavage abolishes TIAM1 activity (14). Both TIAM1 and APP interact directly with NMDA receptor subunits, TIAM1, in regulation of dendritic spine morphology (27,28) and APP, to facilitate cell surface expression of the NMDA receptor (29). Therefore, overexpression of TIAM1 may alter the stoichiometry of NDMA receptor interactions, either in static or dynamic conditions, and contribute to the losses of normal correlations both between APP and NMDAR subunits and among NMDAR subunits. These altered correlations may contribute to perturbed NMDAR activity (23), as well as altered RAC activity, and abnormalities in LTP in the Tc1 mice. In Figure 6B, a network involving isoforms of TIAM1, GSK3B, plus the HSA21 proteins RCAN1 and DYRK1A, are shown. These associations largely have not been explored experimentally.
Figure 6.

Correlations involving the HSA21 protein TIAM1 in hippocampus. (A) With subunits of the NMDA receptor and the HSA21 protein APP, (B) with GSK3B and HSA21 proteins RCAN1 and DYRK1A. Correlations between protein levels were determined by Spearman correlation analysis; only correlations with r > 0.8, with linear scatter plots and P < 0.05 are shown. Heavy solid lines, correlations seen in controls and Tc1; thin solid lines, correlations seen only in controls; dashed lines, correlations seen only in Tc1. Grey circles, HSA21 proteins; open circles, non-HSA21 proteins. Phosphorylation-dependent and -independent forms are shown separately; pGSK3B_T, pTyr216; pGSK3B_S, pSer9. N, negative correlation. Asterisk indicates average protein levels are increased in Tc1 with respect to controls.
A third example of correlation networks is shown in Figure 7 and involves the IEG proteins, EGR1, ARC and CFOS. In the hippocampus (Fig. 7A), correlations among IEG proteins are present in controls and Tc1 mice. The levels of Tau and nNOS are also correlated in both genotypes. Notably, the levels of all except EGR1 are elevated in Tc1 mice. Additional correlations specific to the Tc1 include negative correlations between SOD1, Tau and nNOS, and positive correlations between Tau and nNOS and the IEG proteins. Figure 7B shows that IEG protein correlations are quite different in the cortex. While correlations among IEG proteins and with nNOS are present in controls, they are lost in Tc1 mice. There are also control-specific correlations between IEG proteins and α-Synuclein and the neuregulin receptor ERBB4.
Figure 7.

Correlation involving Immediate Early Gene (IEG) proteins in (A) hippocampus and (B) cortex. Correlations between protein levels were determined by Spearman correlation analysis; only correlations with r > 0.8, with linear scatter plots and P < 0.05 are shown. Heavy solid lines, correlations seen in controls and Tc1; thin solid lines, correlations seen only in controls; dashed lines, correlations seen only in Tc1. Dark grey circles, IEG proteins; light grey circles, HSA21 proteins; open circles, non-IEG, non-HSA21 proteins. Phosphorylation-dependent and -independent forms are shown separately. N, negative correlation. Asterisk indicates average protein levels are increased in Tc1 with respect to controls.
We suggest that losses in correlated levels of component proteins may contribute to failed responses to stimuli and underlie impaired or slowed learning responses that also require MAP kinase signaling, NMDA receptor activity, and/or IEG responses to stimulation.
DISCUSSION
We have measured levels of 93 proteins in the hippocampus, 88 in the cortex and 64 in the cerebellum. Twenty-six proteins, HSA21 and non-HSA21, phosphorylated and phosphorylation-independent, were altered in expression level in at least one brain region. Thirteen proteins were increased in both the hippocampus and cortex of Tc1 mice compared with controls. In the hippocampus, an additional six were increased and one decreased, and in the cortex, an additional two were increased and four decreased. In the cerebellum, only seven proteins were altered, all increased, but this does not imply cerebellum is more stable to the effects of trisomy because 15 proteins whose levels were changed in the Tc1 cortex or hippocampus were not measured in cerebellum. Altered protein levels include components of MAP kinase, GSK3B and MTOR signaling, IEGs, the ERBB4 neuregulin receptor, Tau, α-Synuclein and nNOS. Proteins resistant to trisomy include NMDA receptor subunits and most phosphorylated forms of signaling pathway components.
Prior studies of Tc1 mice have included gene expression data, although age of mice and/or cell types used differed. RNA expression levels of 9 of the 11 trisomic HSA21 genes tested here were reported in Tc1 E14.5 day embryos (10). In the absence of translational regulatory effects, corresponding protein levels would then also be elevated. However, only the levels of TIAM1, SOD1, DYRK1A and S100B are elevated here, while those for CCT8, CHAF1B, ETS2, FTCD and PRMT2 are not different from controls. The failure to observe a 50% increase in expression expected from gene dosage is not uncommon in DS systems. While numerous microarray and large-scale quantitative reverse transcription polymerase chain reaction (RT–PCR) studies overall have supported gene-dosage effects, they have also invariably reported cell line-, tissue-, age- and gene-specific departures from it. These results have been summarized in (30). Furthermore, discrepancies between mRNA and protein levels are increasingly being documented (31), and have been reported specifically in aneuploidy (32). Given the cross-reactivity of the antibodies used, we cannot determine whether the human transcripts are inefficiently translated, or if feedback mechanisms compensate for gene dosage, or if, at this adult age, the HSA21 genes are silenced or expression is reduced from the mouse orthologs to maintain disomic levels. Protein expression in the embryonal stem (ES) cell line used in the production of the Tc1 was analyzed by mass spectrometry (33). Of the few HSA21 proteins detected in that work, only CCT8 was analyzed here, and it was not overexpressed in either experiment.
Another Tc1 study compared levels of DYRK1A, and total and phosphorylated forms of GSK3B, AKT and Tau in the cortex and hippocampus of 2-month and 20-month-old mice (15). Specific to 20-month-old Tc1 mice relative to age-matched controls, levels of pGSK3B-Ser9, pAKT-Ser473 and pTau-Thr212 were elevated in both the cortex and hippocampus. None of these abnormalities is observed in the 7- to 8-month-old Tc1 mice; rather mice at this age have elevated levels of pGSK3B-Tyr216 in the cortex and total GSK3B in the cortex and hippocampus (and cerebellum). Because phosphorylation of Try-216 increases GSK3B activity and phosphorylation of Ser-9 inhibits it (34), these data suggest that, at this interim age, kinase activity of GSK3B is enhanced in Tc1, at least in the cortex. Also in contrast to 20-month-old Tc1 mice, 7- to 8-month-old Tc1 have increased the levels of the regulatory subunit of the phosphatase PPA2 in the hippocampus and increased the levels of total Tau, but not pTau-Thr212, in the cortex and hippocampus. Together, these age comparisons suggest that changes occurring in the Tc1 throughout adult life are not necessarily a simple transition from the levels observed at 2 months of age to those seen at 20 months, but rather may involve a complex program of changes in regulatory mechanisms. This also suggests that developing pharmacotherapies to modulate abnormalities that may be responsible for cognitive deficits seen in DS will require careful studies of age-dependence and time courses.
Characterizing the response to trisomy of >70 non-HSA21 proteins has revealed many novel perturbations and considerable complexity in the pathway associations of the abnormalities. This is true both in the proteins showing abnormal levels and in those showing altered correlations in levels. The Tc1 mice are functionally trisomic for ∼120 protein-coding genes. For the majority of these proteins, there is little or no functional information beyond sequence similarities to gene family members or protein functional domains or motifs (9,35). Furthermore, because of the lack of quality antibodies, there is also little information on which of these proteins is overexpressed in trisomy (36). It is, therefore, difficult to speculate meaningfully regarding which specific HSA21 proteins are causing or contributing to the alterations seen in levels of non-HSA21 proteins. This point is discussed in detail in (35). In Supplementary Material, Table S5, we list 10 HSA21 genes uniquely trisomic in the Tc1 that have been shown to function in learning and memory, neurite outgrowth, neuroinflammation, protein stability and/or gene transcription. Each of these are processes that could underlie non-HSA21 protein abnormalities in the Tc1. In addition to such speculation, it is, however, both practical and more important to understand how the observed perturbations contribute to learning and memory deficits and behavioral abnormalities. There are several examples of potentially informative consequences.
ERBB4 is a tyrosine kinase receptor that binds to and mediates signaling from neuregulin 1 (NRG1) (22). ERBB4 has not been studied in the context of DS, but a number of observations make its elevated expression in both the cortex and hippocampus of Tc1 mice worth further consideration. Expression of ERBB4 in the adult brain is largely confined to GABAergic interneurons (37). Knockout of ERBB4, specifically in parvalbumin-expressing interneurons, resulted in abnormalities of LTP and impaired performance in context fear conditioning (CFC) (38). A mouse model of Angelman syndrome showed increased levels of phosphorylated ERBB4, deficits in CFC and abnormalities in LTP, all of which were rescued by inhibition of ERBB4 (39). Thus, altered levels of ERBB4 result in abnormalities that are consistent with features seen in several mouse models of DS, including the Tc1. Levels of ERBB4 are also elevated in brains from patients with AD, particularly in hippocampal and basal forebrain neurons, and similar increases are seen in the hippocampus and cortex from the APP/PSEN1 double-transgenic mouse model of AD (40). As in the Tc1 mice, it is not known whether these increases in ERBB4 protein levels contribute to, or are a consequence of, the disease process, but analysis of ERBB4 expression in DS and in AD in DS is warranted. ERBB4 is proteolytically processed by γ-secretase and the intracellular domain has been shown to activate transcription of a number of genes, among them the HSA21 gene ITSN1 (17). Therefore, elevated ERBB4 may be contributing to the elevated levels in the Tc1 of the ITSN1 protein in spite of the lack of trisomy of the ITSN1 gene. Lastly, ERBB4 activity regulates dendritic spine formation (22). This adds a non-HSA21 protein to the list of HSA21 proteins (APP, TIAM1, ITSN1, PCP4, RCAN1 and DSCAM) that have been associated with spine abnormalities when overexpressed and that are candidates for such abnormalities in DS (35). In summary, while the HSA21-related molecular mechanisms leading to elevated ERBB4 expression in Tc1 mice are not known, the consequences of perturbed ERBB4 levels observed in other disease models suggest that there are multiple mechanisms by which the Tc1 phenotype could be influenced and this requires investigation in full trisomy.
The AMP-activated Protein Kinase, AMPK, is a master regulator of cellular energy homeostasis. AMPK is activated by phosphorylation of the catalytic subunit, AMPKA. Low cellular ratios of AMP:ATP result in increased levels of phosphorylated AMPKA which then functions to increase ATP production and repress processes, such as protein translation, that consume high levels of ATP (reviewed in 41). The levels of total AMPKA are elevated specifically in Tc1 hippocampus, and while levels of pAMPKA could not be measured because of the lack of an appropriately specific antibody, this suggests altered AMPK activity or regulation. Activation of AMPK in hippocampal slices has been shown to decrease mTOR signaling by decreasing phosphorylation levels of P70S6 and S6 (42). Increased pAMPKA also inhibited maintenance of late-LTP, a process requiring mTOR signaling and protein synthesis. The mTOR pathway is perturbed in Tc1 mice because, although levels of phosphorylated forms are not altered, the levels of total P70S6 are increased in the cortex and hippocampus, and RAPTOR is increased in the hippocampus, suggesting decreased ratios of active to inactive mTOR components. Oxidative stress activates AMPK (43), a possible link to perturbations in DS where increased levels of reactive oxygen species are well documented. It is also of interest that levels of pAMPKA are decreased in AD brains (41).
SOD1 protein levels are elevated, due to trisomy, in all three brain regions of Tc1 mice. The levels of the IEG proteins ARC, cFOS and pCFOS are also elevated specifically in Tc1 hippocampus. The network in Figure 7A shows correlations specific to Tc1 between SOD1 and IEG proteins through nNOS and Tau. A functional/regulatory relationship between SOD1 and IEGs was demonstrated in a transgenic mouse overexpressing SOD1. Kainate treatment induced cFOS expression (neither ARC nor pCFOS were measured) in both controls and transgenic mice but in the presence of elevated SOD1 protein, elevated cFOS levels persisted longer (>24 h compared with <14h in control mice) (44). This indicates that elevated levels of SOD1 alone can lead to altered regulation of the production or half-life of IEG proteins. Other reports have shown increased expression of cFOS and EGR1 in response to oxidative stress (45,46) and suggested that this induction is protective (47). If elevated levels of IEG proteins in Tc1 mice are a protective response to elevated levels of oxidative stress, they may be a compensatory response in Tc1 (and DS) and not an abnormality that would be beneficial to alter directly with pharmacotherapies.
In contrast to observations in human DS lymphoblastoid cell lines (48), no correlations were observed in Tc1 brain regions between the levels of DYRK1A and BDNF. Indeed, BDNF levels were decreased and only in Tc1 cortex.
In prior work, we reported a similar analysis of protein expression in Ts65Dn mice (13). The Ts65Dn mice were similar in age (4.4 to 7.8 months) to the Tc1 analyzed here, and methods of tissue collection, protein lysate preparation and reverse phase protein array analysis were identical. The methodological issues are important, because they will affect experimental observations. In particular, heat stabilization preserves protein profiles while use of anesthetics, perfusion and the time frame of tissue dissection will each cause their own changes. In addition, RPA is more sensitive and accurate than standard quantitative western blot procedures. Figure 8 illustrates the regions of HSA21 and the orthologous region of mouse chromosome 16 that are trisomic in the Tc1 and Ts65Dn, respectively. In Figure 9, proteins with altered levels in one or both models are compared for the three brain regions (percent changes for each protein and brain region in Ts65Dn are provided in (13) and in Supplementary Material, Table S4). The Tc1 and Ts65Dn mice differ in strain background (C57BL6/J X 129S8 and C57BL6/JEi X C3H, respectively) and in trisomic gene content; both of these features can contribute to differences in protein expression levels. The Ts65Dn mice are trisomic for orthologs of 88 of the 161 HSA21 classical protein coding genes and ∼50 of these are also trisomic in the Tc1 (Fig. 8; see Supplementary Material, Table S6a for the complete list of HSA21 RefSeq genes and their trisomic status in the Tc1 and Ts65Dn). Ts65Dn-specific trisomic HSA21 genes include APP and genes within the region spanning just distal to HUNK through RUNX1. This region contains 37 protein coding genes, including synaptojanin 1, the OLIG1 and OLIG2 genes, the interferon receptor cluster, and RCAN1. Tc1-specific trisomic genes include ∼15 that are proximal to APP, including C21ORF34 that is the host gene for three microRNA genes, the 19 genes mapping within the MMU17 orthologous region and, with the exception of TRPM2, COL18A1 and PCBP3, 38 within the MMU10 orthologous region. The Ts65Dn, in addition, is trisomic for a centromere-proximal segment of mouse chromosome 17 that is not orthologous to HSA21 (Fig. 8). This has recently been shown to include 50 genes (49,50), including paralogs of several HSA21 protein-coding genes, TIAM2, SYNJ2, TCP10A, TCP10B and PDE10a (see Supplementary Material, Table S6B for the complete list). Consistent with differences in trisomic gene content, there are striking differences in both HSA21 and non-HSA21 protein perturbations in these two partial trisomy models. One obvious difference is that abnormalities in the Tc1 mice are more consistent among brain regions; indeed, of 22 proteins with elevated expression, 15 are elevated in all regions tested. In contrast, in the Ts65Dn mice, brain region-specific abnormalities are more common; only 4 of 22 proteins are increased in all brain regions tested. This is true even for HSA21 proteins, e.g. in the Ts65Dn, TIAM1 is not elevated in the hippocampus. Little is known about the specificities of TIAM2 versus TIAM1 (51), but it cannot be excluded that TIAM2 gene dosage in the Ts65Dn modulates TIAM1 gene expression to produce effects not present in the Tc1 mice.
Figure 8.

Chromosome 21 long-arm and orthologous mouse chromosome 16 region trisomic in the Tc1 and the Ts65Dn mice, respectively. D1, segment of HSA21 present in Tc1 and absent in Ts65Dn; grey-shaded D2, D3, internal deletions in the Tc1 HSA21 chromosome. R1, region of mouse chromosome 17 uniquely trisomic in the Ts65Dn; R2, HSA21 orthologous region of mouse chromosome 16 trisomic in the Ts65Dn; R3, HSA21 segment uniquely trisomic in the Tc1. RefSeqP, number of HSA21 annotated classical protein coding genes trisomic in the Tc1, and the number of mouse orthologs trisomic in the Ts65Dn (9). The complete list of protein-coding genes trisomic in regions D1–D3 and R1–R3 and additional details of Tc1 gene-specific partial deletions and duplications are provided in Supplementary Material, Table S6.
Figure 9.
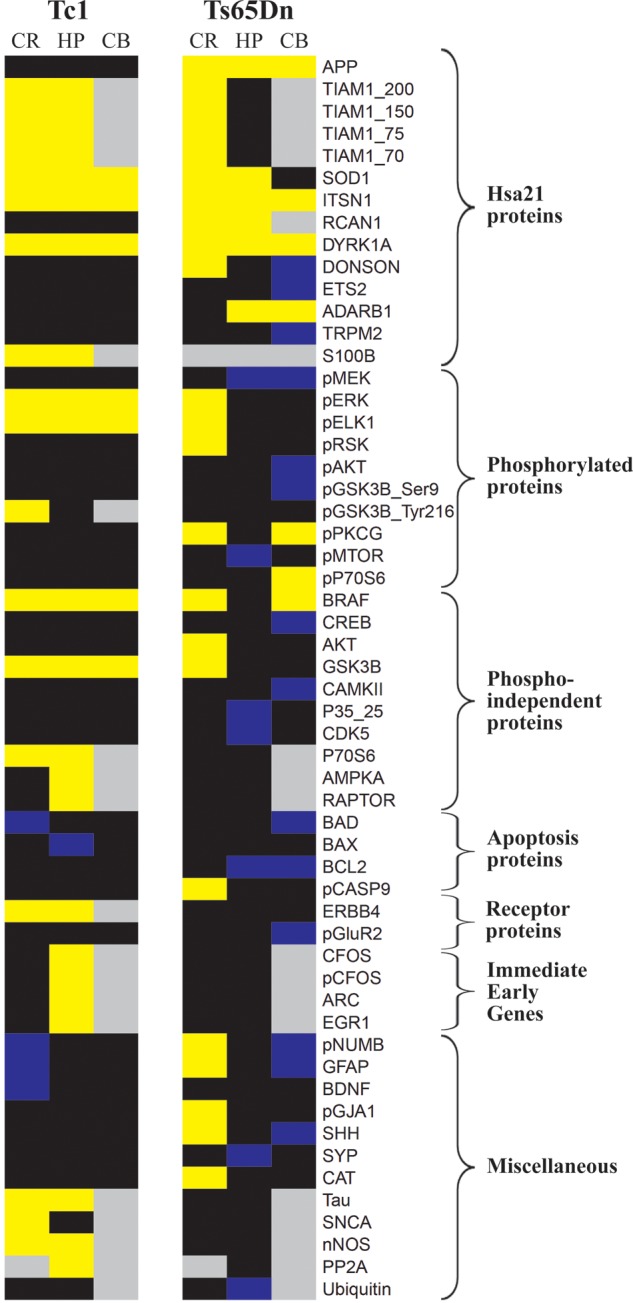
Comparison of protein expression abnormalities in Tc1 and Ts65Dn. All proteins with an average expression level significantly different from corresponding controls in at least one brain region of at least one mouse model are listed at right. Proteins are grouped by general category. Yellow, increased; blue, decreased; black, unchanged; grey, not measured. % difference from respective controls are provided in Table 1 for Tc1 and in Supplementary Material, Table S4 for Ts65Dn (13). Cr, cortex; HP, hippocampus; CB, cerebellum.
Notable abnormalities unique to the Tc1 mice are elevated levels of the IEG proteins, ARC, CFOS and pCFOS. That IEG proteins are not altered in the Ts65Dn was unexpected based on recent observations of decreased levels of mRNAs for ARC and CFOS in Ts65Dn relative to controls after exposure to the Morris Water Maze, and their normalization by treatment with a GABAAα5 antagonist that also rescued learning and memory impairments (19). One interpretation is that mRNA levels in the Ts65Dn are depressed as a feedback mechanism to maintain normal protein levels. Another possibility is that altered IEG expression is age related, decreased in 3-month-old mice and normal in the slightly older mice used here. Other Tc1-specific abnormalities include elevated ERBB4 in the cortex and hippocampus. This is of interest because ERBB4 expression is restricted to GABAergic interneurons, and, although not studied in the Tc1, GABAergic transmission is abnormal in the Ts65Dn. The complete picture is complicated to interpret, however, because in contrast to the Tc1, ERBB4 is not elevated in the Ts65Dn (at least at the age studied here), suggesting that abnormal ERBB4 expression may contribute to phenotype in the Tc1 but not in the Ts65Dn.
Perturbations unique to the Ts65Dn mice include decreased levels of CDK5 and p35/25 in the hippocampus, and perturbations of levels of more phosphorylated proteins, including decreased levels of pMTOR and pMEK1/2 and increased levels of pPKCG and pRSK. Interestingly, total ubiquitin levels are uniquely decreased in Ts65Dn hippocampus.
The Tc1 and Ts65Dn models also differ in patterns of correlated protein levels. In the hippocampus, many correlations among subunits of the NMDAR are preserved in the Tc1 mice (Fig. 6a). However, only those for NR2A-pNR2B and pNR2B-NR2B were also preserved in the Ts65Dn (13). In addition, the Ts65Dn showed none of the correlations between TIAM1 isoforms and NMDAR subunits that are gained in the Tc1. These differences may be related to the increased levels of APP unique to the Ts65Dn and the increased levels of TIAM1 unique to the hippocampus in the Tc1. In the MAP kinase pathway networks, in the hippocampus fewer correlations are lost in the Tc1 than in the Ts65Dn, while in cortex, most correlations are equally stable to trisomy effects.
Overall, protein abnormalities in these partial trisomy models of DS are complex and multi-faceted. As has also commonly been done with DS and DS model RNA expression studies, entire brain regions were analyzed here. Each brain region of course contains many different cell types, excitatory and inhibitory neurons, astrocytes, etc., and the protein profiles observed are therefore composites of those present in the specific cell types. For each brain region, they are also composites of the profiles that exist in subregions, e.g. for the hippocampus, they are composites of those in the CA1, CA3 and dentate gyrus. Future studies could include generation of protein profiles from such subregions, which might then provide insight into the specific molecular correlates of, for example, abnormalities in LTP.
Aside from differences in strain backgrounds, doubtless, in both the Tc1 and the Ts65Dn, many of the observed perturbations are direct consequences of increased expression of trisomic genes or are part of resulting cascade reactions. However, some of the abnormalities are likely to be compensatory responses to the primary perturbations, involving feedback control mechanisms. Furthermore, some perturbations will be influenced, positively and negatively, by functional interactions among HSA21 genes, and the number and identity of such interactions will also differ with trisomic gene content. Thus, relative to the TS65Dn, Tc1-specific features of the protein profiles are a complex result of trisomy of 121 HSA21 genes plus the lack of trisomy of the 38 Ts65Dn-specific protein-coding genes. Importantly, the differences in protein patterns between the Tc1 and Ts65Dn mice clearly preclude reliable inferences regarding what perturbations exist in a full trisomy, i.e. in the DS brain or in the brain in DS with AD. This limitation in knowledge must be considered in making decisions to move to clinical trials based on drug responses observed in a partial trisomy HSA21 mouse model, such as the Ts65Dn. Indeed, the Tc1 mice show protein abnormalities potentially relevant to oxidative stress, and NMDA and GABA receptor signaling. Drugs targeting each of these processes have been or are being used in clinical trials with people with DS (52–54). So far, antioxidants and the NMDA receptor antagonist, memantine, have shown no or very limited benefit. Rationales for these failures have included the age of participants, duration of the trial and/or number of participants. Data from the Tc1 mice, and their significant differences from those in the Ts65Dn mice that were used in pre-clinical evaluation of antioxidant, memantine and GABAA antagonist responses, indicate that a plausible cause of the failure of clinical trials is the quite different molecular basis of the phenotype in DS and consequent quite different drug responses.
MATERIALS AND METHODS
Mice
Mice were bred at the University College London Institute of Neurology, London, UK. Mice were housed in controlled conditions in accordance with guidance issued by the Medical Research Council in Responsibility in the Use of Animals for Medical Research (1993) and all experiments were carried out under License from the UK Home Office and with Local Ethical Review panel approval. Tc1 mice are maintained by mating Tc1 females to 129S8 X C57BL/6 F1 males and typed using DNA from tail tips as described previously (10). Littermates were housed in the same cage. Male mice, littermates, 7 controls and 7 trisomy, aged ∼7 months (Supplementary Material, Table S1), were sacrificed by cervical dislocation without anesthetic and the brain quickly removed, frozen in liquid nitrogen, and stored at −80°C until use. All mice were naïve and were sacrificed between noon and 2 PM to maintain a consistent circadian time frame. Optimal preservation of protein profiles precludes the use of anesthetic and perfusion.
Tissue processing and preparation of protein lysates
To optimally preserve protein profiles, including phosphorylation, prior to lysate preparation, tissues were heat stabilized in the Stabilizor T1 (Denator, AB, Gothernburg, Sweden) as described previously (13,55,56). Briefly, tissues were removed from 80°C and, without thawing, immediately placed in the sample cassette and inserted into the Stabilizor T1 where they were exposed to rapid heating to 95°C under vacuum. This process has been shown to prevent normal postmortem proteolytic events and alterations in posttranslational modification that occur in particularly in response to the use of anesthetics and during perfusion, but also during preparation of lysates when tissues are exposed to thawing (55,56). After stabilization, brains minus cerebellum were dissected into the hippocampus and cortex. Brain stem was removed from the cerebellum; for the cortex, the entire region remaining after the removal of hippocampus and striatum was used. The cortex, hippocampus and cerebellum tissue samples were weighed (Supplementary Material, Table S1) and whole tissue lysates were placed in 10 volumes of Iso Electric Focusing (IEF) buffer [8 M urea, 4% 3-[(3-cholamidopropyl)dimethylammonio]-1-propanesulfonate (CHAPS), 50 mm Tris] and homogenized by sonication (three bursts of 5 s duration in Branson Sonic Power Co., Danbury, CT, USA), followed by brief centrifugation to remove debris. Protein concentrations, determined using the 660 nm Protein Assay kit (Thermo Scientific, Rockfold, IL, USA), were within the range of 9–11 mg/ml for all samples. Information for each mouse on age, littermates and weights of individual brain regions is provided in Supplementary Material, Table S1.
Western blots
Twenty micrograms of protein lysates per lane were separated at 170 V, constant voltage for 2½h on sodium dodecyl sulfate polyacrylamide gel electrophoresis (SDS–PAGE) gels (8, 10 or 12% depending upon size the proteins to be detected). Following electrophoresis, proteins were transferred to polyvinylidene difluoride (PVDF) membranes at 250 mA constant current for 1½h. Membranes were blocked with 5% (w/v) non-fat dry milk in TBST (Tris-buffered saline, 0.1% Tween 20), followed by overnight incubation at 4°C with primary antibody. Detection of bound primary antibodies was performed with alkaline-phosphatase-conjugated goat anti-rabbit (Invitrogen, Camarillo, CA, USA) or goat anti-mouse (Cell Signaling Technology, Danvers, MA, USA) secondary antibodies. Signals were detected with CDP-Star Chemiluminescence reagent; imaging and quantitation were carried out using the Diana III CCD camera and Aida software (Raytest, Inc., Germany). All membranes were stripped in 0.2 m glycine pH 2.5/0.05% Tween 20, at 70°C for 20 min, and re-probed with actin antibody (Sigma, Saint Louis, MO, USA) for normalization. For genotype comparisons, data were analyzed using GraphPad Prism 5 software (San Diego, CA, USA). The unpaired Student t-test was used for statistical evaluation and the P-value of <0.05 was considered statistically significant.
Antibodies and validation for RPA
All antibodies were verified by western blots to cross-react with both mouse and human proteins. To determine suitability for use in RPA, each lot of each antibody was also verified to produce clean band(s) of the correct size(s) in the absence of significant background and non-specific bands, i.e. to produce predominant band(s) of explainable size. Antibodies are listed in Supplementary Material, Table S2 with supplier and dilution factor. With the exception of S100B and RAGE, which identify bands in addition to those explained by alternative splicing and proteolytic cleavage, all antibodies listed in Supplementary Material, Table S1 are suitable for RPA. TIAM1 was evaluated by western blots, instead of RPA, to determine relative proportions of splice variants and proteolytic cleavage products.
Array assembly and printing
For each sample, lysates, neat plus four serial dilutions (dilution factor 0.8) and one buffer control, were pipetted into V-shaped ABgene 384-well plates (Thermo Fisher Scientific, Rockford, IL, USA). Samples were printed in quadruplicate onto nitrocellulose-coated glass slides (Path or SuperNova slides, Grace Bio-Labs, Inc., Bend, OR, USA), using an Aushon BioSystems 2470 Arrayer (Aushon BioSystems, Billerica, MA, USA) with 185 μm pins and a single touch. Arrays were produced in four print runs. The first run included samples from the cortex, hippocampus and cerebellum, while runs 2–4 included either the cortex or hippocampus only. Eight milligrams of starting tissue is sufficient to spot 100 slides. Slides were stored at 4°C until use.
Antibody detection and array staining
Procedures for array screening have been described previously (13). Briefly, slides were incubated in blocking solution (3% BSA (Sigma-Aldrich Co, Saint Louis, MO, USA) in TBST (Tris-buffered saline, 0.1% Tween 20) for 4h, followed by overnight incubation at 4°C with primary antibody (antibody dilutions are provided in Supplementary Material, Table S1). Detection of bound primary antibodies was performed by incubation for 90 min at room temperature with Fluorescence Alexa Fluor 555 goat anti-mouse or anti rabbit or rabbit anti-goat (Invitrogen, Camarillo, CA, USA) secondary antibodies (1:2000). Slides were washed with TBST three times for 5 min and dried for 20 min at 30°C. All the steps including and following the incubation with secondary antibody were performed in the dark. For normalization purposes, total protein in each spot was determined by staining two to three non-sequential slides from each print run with SyproRuby reagent (Invitrogen, Camarillo, CA, USA) following the manufacturer's protocol.
Slide scanning, image analysis, quantification, normalization and review of data quality
Slides screened with antibodies or stained with SyproRuby were scanned on a GenePix 4000B array slide scanner (Axon Instruments, Union City, CA, USA) using GenePix Pro 4.0 software. The intensity of each spot was quantified using the ScanArray Express software (PerkinElmer, Inc., Boston, MA, USA). Antibody signal for each spot was normalized to the corresponding SyproRuby signal. Details of quantification and review of data quality and reproducibility were as described previously (13).
Statistical analysis
After exclusion of technical outliers, all SyproRuby-normalized protein values were included in the statistical analyses; data were transformed to a natural log scale. Mean differences in protein levels between genotypes (trisomy versus control, reported as a ratio and percent of control) were assessed using a hierarchical three-level mixed effects model to account for the possible correlations and variabilities among replicates and dilution levels within each mouse. To carry out a correlation analysis, data were reduced to one observation per mouse. Protein values for each brain region of each individual of each genotype were used to compute Spearman correlation coefficients. Graphs for data from protein pairs with correlation coefficients >0.8 with P < 0.05 were inspected and correlations with artifactually high r values (i.e. non-linear relationships) were eliminated. All data analyses were carried out using SAS® (version 9.2, SAS Institute, Inc., Cary, NC, USA). A two-tailed P-value of <0.05 was considered for overall statistical significance across the entirety of the hypotheses tests; Bonferroni correction and false discovery rate were applied to correct P-values from pairwise multiple tests. Supplementary Material, Table S3 shows all significant correlations (r > 0.8; P < 0.05) for all three brain regions. Correlation networks were created using JAVA JUNG2 software.
SUPPLEMENTARY MATERIAL
FUNDING
This work was supported by the National Institute of Child Health and Human Development (HD071585 to K.J.G.); the Linda Crnic Institute for Down Syndrome (K.J.G.); the Fondation Jerome Lejeune (K.J.G.); the Fidelity Foundation (F.K.W., E.M.C.F.); the UK Medical Research Council (F.K.W., E.M.C.F., U117527252 to V.L.J.T.) and the Wellcome Trust (080174 to V.L.J.T.). Funding to pay the Open Access publication charges for this article was provided by The Wellcome Trust (grant to Elizabeth Fisher).
Supplementary Material
ACKNOWLEDGEMENTS
The authors thank Xiaolu Sturgeon for initial computational assistance.
Conflict of Interest statement. None declared.
REFERENCES
- 1.CDC, Centers for Disease Control and Prevention. Improved national prevalence estimates for 18 major birth defects. MMWR Morb. Mortal. Wkly. Rep. 2006;54:6–12. [PubMed] [Google Scholar]
- 2.Irving C., Basu A., Richmond S., Burn J., Wren C. Twenty-year trends in prevalence and survival of Down syndrome. Eur. J. Hum. Genet. 2008;16:1336–1340. doi: 10.1038/ejhg.2008.122. [DOI] [PubMed] [Google Scholar]
- 3.Chapman R.S., Hesketh L.J. Behavioral phenotype of individuals with Down syndrome. Ment. Retard. Dev. Disabil. Res. Rev. 2000;6:84–95. doi: 10.1002/1098-2779(2000)6:2<84::AID-MRDD2>3.0.CO;2-P. [DOI] [PubMed] [Google Scholar]
- 4.Silverman W. Down syndrome: cognitive phenotype. Ment. Retard. Dev. Disabil. Res. Rev. 2007;13:228–236. doi: 10.1002/mrdd.20156. [DOI] [PubMed] [Google Scholar]
- 5.Edgin J.O., Mason G.M., Allman M.J., Capone G.T., Deleon I., Maslen C., Reeves R.H., Sherman S.L., Nadel L. Development and validation of the Arizona Cognitive Test Battery for Down syndrome. J. Neurodev. Disord. 2010;2:149–164. doi: 10.1007/s11689-010-9054-3. [DOI] [PMC free article] [PubMed] [Google Scholar]
- 6.Benavides-Piccione R., Ballesteros-Yanez I., de Lagran M.M., Elston G., Estivill X., Fillat C., Defelipe J., Dierssen M. On dendrites in Down syndrome and DS murine models: a spiny way to learn. Prog. Neurobiol. 2004;74:111–126. doi: 10.1016/j.pneurobio.2004.08.001. [DOI] [PubMed] [Google Scholar]
- 7.Lott I.T., Dierssen M. Cognitive deficits and associated neurological complications in individuals with Down's syndrome. Lancet. Neurol. 2010;9:623–633. doi: 10.1016/S1474-4422(10)70112-5. [DOI] [PubMed] [Google Scholar]
- 8.Capone G., Goyal P., Ares W., Lannigan E. Neurobehavioral disorders in children, adolescents, and young adults with Down syndrome.Am. J. Med. Genet. C. Semin. Med. Genet. 2006;142C:158–172. doi: 10.1002/ajmg.c.30097. [DOI] [PubMed] [Google Scholar]
- 9.Sturgeon X., Gardiner K. Comparative transcript catalogs of human chromosome 21 and orthologous chimpanzee and mouse genomic regions. Mam. Genome. 2011;22:61–71. doi: 10.1007/s00335-011-9321-y. [DOI] [PubMed] [Google Scholar]
- 10.O'Doherty A., Ruf S., Mulligan C., Hildreth V., Errington M.L., Cooke S., Sesay A., Modino S., Vanes L., Hernandez D., et al. An aneuploid mouse strain carrying human chromosome 21 with Down syndrome phenotypes. Science. 2005;309:2033–2037. doi: 10.1126/science.1114535. [DOI] [PMC free article] [PubMed] [Google Scholar]
- 11.Kuhn S., Ingham N., Pearson S., Gribble S.M., Clayton S., Steel K.P., Marcotti W. Auditory function in the Tc1 mouse model of down syndrome suggests a limited region of human chromosome 21 involved in otitis media. PLoS One. 2012;7:e31433. doi: 10.1371/journal.pone.0031433. [DOI] [PMC free article] [PubMed] [Google Scholar]
- 12.Morice E., Andreae L.C., Cooke S.F., Vanes L., Fisher E.M., Tybulewicz V.L., Bliss T.V. Preservation of long-term memory and synaptic plasticity despite short-term impairments in the Tc1 mouse model of Down syndrome. Learn Mem. 2008;15:492–500. doi: 10.1101/lm.969608. [DOI] [PMC free article] [PubMed] [Google Scholar]
- 13.Ahmed M.M., Sturgeon X., Ellison M., Davisson M.T., Gardiner K.J. Loss of correlations among proteins in brains of the Ts65Dn mouse model of Down syndrome. J. Prot. Res. 2012;11:1251–1263. doi: 10.1021/pr2011582. [DOI] [PubMed] [Google Scholar]
- 14.Qi H., Juo P., Masuda-Robens J., Caloca M.J., Zhou H., Stone N., Kazanietz M.G., Chou M.M. Caspase-mediated cleavage of the TIAM1 guanine nucleotide exchange factor during apoptosis. Cell Growth Differ. 2001;12:603–611. [PubMed] [Google Scholar]
- 15.Sheppard O., Plattner F., Rubin A., Slender A., Linehan J.M., Brandner S., Tybulewicz V.L., Fisher E.M., Wiseman F.K. Altered regulation of tau phosphorylation in a mouse model of down syndrome aging. Neurobiol. Aging. 2012;33:828.e31–828.e44. doi: 10.1016/j.neurobiolaging.2011.06.025. [DOI] [PMC free article] [PubMed] [Google Scholar]
- 16.Allison J.G., Das P.M., Ma J., Inglis F.M., Jones F.E. The ERBB4 intracellular domain (4ICD) regulates NRG1-induced gene expression in hippocampal neurons. Neurosci. Res. 2011;70:155–163. doi: 10.1016/j.neures.2011.02.009. [DOI] [PubMed] [Google Scholar]
- 17.Wong K.A., Wilson J., Russo A., Wang L., Okur M.N., Wang X., Martin N.P., Scappini E., Carnegie G.K., O'Bryan J.P. Intersectin (ITSN) family of scaffolds function as molecular hubs in protein interaction networks. PLoS One. 2012;7:e36023. doi: 10.1371/journal.pone.0036023. [DOI] [PMC free article] [PubMed] [Google Scholar]
- 18.Harashima C., Jacobowitz D.M., Witta J., Borke R.C., Best T.K., Siarey R.J., Galdzicki Z. Abnormal expression of the G-protein-activated inwardly rectifying potassium channel 2 (GIRK2) in hippocampus, frontal cortex, and substantia nigra of Ts65Dn mouse: a model of Down syndrome. J. Comp. Neurol. 2006;494:815–833. doi: 10.1002/cne.20844. [DOI] [PMC free article] [PubMed] [Google Scholar]
- 19.Braudeau J., Dauphinot L., Duchon A., Loistron A., Dodd R.H., Hérault Y., Delatour B., Potier M.C. Chronic treatment with a promnesiant GABA-A α5-selective inverse agonist increases immediate early genes expression during memory processing in mice and rectifies their expression levels in a Down syndrome mouse model. Adv. Pharmacol. Sci. 2011;2011:153218. doi: 10.1155/2011/153218. [DOI] [PMC free article] [PubMed] [Google Scholar]
- 20.Troca-Marín J.A., Alves-Sampaio A., Montesinos M.L. An increase in basal BDNF provokes hyperactivation of the Akt-mammalian target of rapamycin pathway and deregulation of local dendritic translation in a mouse model of Down's syndrome. J. Neurosci. 2011;31:9445–9455. doi: 10.1523/JNEUROSCI.0011-11.2011. [DOI] [PMC free article] [PubMed] [Google Scholar]
- 21.Nishimura T., Yamaguchi T., Tokunaga A., Hara A., Hamaguchi T., Kato K., Iwamatsu A., Okano H., Kaibuchi K. Role of numb in dendritic spine development with a Cdc42 GEF intersectin and EphB2. Mol. Biol. Cell. 2006;17:1273–1285. doi: 10.1091/mbc.E05-07-0700. [DOI] [PMC free article] [PubMed] [Google Scholar]
- 22.Mei L., Xiong W.C. Neuregulin 1 in neural development, synaptic plasticity and schizophrenia. Nat. Rev. Neurosci. 2008;9:437–452. doi: 10.1038/nrn2392. [DOI] [PMC free article] [PubMed] [Google Scholar]
- 23.Siddiqui A., Lacroix T., Stasko M., Costa A.C., Gardiner K. Molecular response of the Ts65Dn and Ts1Cje mouse models of Down syndrome to the NMDA receptor antagonist, MK-801. Genes Brain Behav. 2008;7:810–819. doi: 10.1111/j.1601-183X.2008.00428.x. [DOI] [PMC free article] [PubMed] [Google Scholar]
- 24.Nguyen C.D., Costa A.C., Cios K.J., Gardiner K.J. Machine learning methods predict locomotor response to MK-801 in mouse models of down syndrome. J. Neurogenet. 2011;25:40–51. doi: 10.3109/01677063.2011.558606. [DOI] [PubMed] [Google Scholar]
- 25.Samuels I.S., Saitta S.C., Landreth G.E. MAP'ing CNS development and cognition: an ERKsome process. Neuron. 2009;61:160–167. doi: 10.1016/j.neuron.2009.01.001. [DOI] [PMC free article] [PubMed] [Google Scholar]
- 26.Ehler E., van Leeuwen F., Collard J.G., Salinas P.C. Expression of Tiam-1 in the developing brain suggests a role for the Tiam-1-Rac signaling pathway in cell migration and neurite outgrowth. Mol. Cell Neurosci. 1997;9:1–12. doi: 10.1006/mcne.1997.0602. [DOI] [PubMed] [Google Scholar]
- 27.Tolias K.F., Bikoff J.B., Burette A., Paradis S., Harrar D., Tavazoie S., Weinberg R.J., Greenberg M.E. The Rac1-GEF Tiam1 couples the NMDA receptor to the activity-dependent development of dendritic arbors and spines. Neuron. 2005;45:525–538. doi: 10.1016/j.neuron.2005.01.024. [DOI] [PubMed] [Google Scholar]
- 28.Tolias K.F., Bikoff J.B., Kane C.G., Tolias C.S., Hu L., Greenberg M.E. The Rac1 guanine nucleotide exchange factor Tiam1 mediates EphB receptor-dependent dendritic spine development. Proc. Natl Acad. Sci. USA. 2007;104:7265–7270. doi: 10.1073/pnas.0702044104. [DOI] [PMC free article] [PubMed] [Google Scholar]
- 29.Cousins S.L., Hoey S.E., Anne Stephenson F., Perkinton M.S. Amyloid precursor protein 695 associates with assembled NR2A- and NR2B-containing NMDA receptors to result in the enhancement of their cell surface delivery. J. Neurochem. 2009;111:1501–1513. doi: 10.1111/j.1471-4159.2009.06424.x. [DOI] [PubMed] [Google Scholar]
- 30.Vilardell M., Rasche A., Thormann A., Maschke-Dutz E., Pérez-Jurado L.A., Lehrach H., Herwig R. Meta-analysis of heterogeneous Down syndrome data reveals consistent genome-wide dosage effects related to neurological processes. BMC Genomics. 2011;12:229–245. doi: 10.1186/1471-2164-12-229. [DOI] [PMC free article] [PubMed] [Google Scholar]
- 31.Schwanhäusser B., Busse D., Li N., Dittmar G., Schuchhardt J., Wolf J., Chen W., Selbach M. Global quantification of mammalian gene expression control. Nature. 2011;473:337–342. doi: 10.1038/nature10098. [DOI] [PubMed] [Google Scholar]
- 32.Stingele S., Stoehr G., Peplowska K., Cox J., Mann M., Storchova Z. Global analysis of genome, transcriptome and proteome reveals the response to aneuploidy in human cells. Mol. Syst. Biol. 2012;8:608. doi: 10.1038/msb.2012.40. [DOI] [PMC free article] [PubMed] [Google Scholar]
- 33.Wang Y., Mulligan C., Denyer G., Delom F., Dagna-Bricarelli F., Tybulewicz V.L., Fisher E.M., Griffiths W.J., Nizetic D., Groet J. Quantitative proteomics characterization of a mouse embryonic stem cell model of Down syndrome. Mol. Cell. Proteomics. 2009;8:585–595. doi: 10.1074/mcp.M800256-MCP200. [DOI] [PMC free article] [PubMed] [Google Scholar]
- 34.Cohen P., Frame S. The renaissance of GSK3. Nat. Rev. Mol. Cell Biol. 2001;2:769–776. doi: 10.1038/35096075. [DOI] [PubMed] [Google Scholar]
- 35.Sturgeon X., Le T., Ahmed M.M., Gardiner K.J. Pathways to cognitive deficits in Down syndrome. Prog. Brain Res. 2012;197:73–100. doi: 10.1016/B978-0-444-54299-1.00005-4. [DOI] [PubMed] [Google Scholar]
- 36.Spellman C., Ahmed M.M., Dubach D., Gardiner K.J. Expression of trisomic proteins in Down syndrome model systems. Gene. 2012;512:219–225. doi: 10.1016/j.gene.2012.10.051. [DOI] [PubMed] [Google Scholar]
- 37.Vullhorst D., Neddens J., Karavanova I., Tricoire L., Petralia R.S., McBain C.J., Buonanno A. Selective expression of ErbB4 in interneurons, but not pyramidal cells, of the rodent hippocampus. J. Neurosci. 2009;29:12255–12264. doi: 10.1523/JNEUROSCI.2454-09.2009. [DOI] [PMC free article] [PubMed] [Google Scholar]
- 38.Chen Y.J., Zhang M., Yin D.M., Wen L., Ting A., Wang P., Lu Y.S., Zhu X.H., Li S.J., Wu C.Y., et al. ErbB4 in parvalbumin-positive interneurons is critical for neuregulin 1 regulation of long-term potentiation. Proc. Natl Acad. Sci. USA. 2010;107:21818–21823. doi: 10.1073/pnas.1010669107. [DOI] [PMC free article] [PubMed] [Google Scholar]
- 39.Kaphzan H., Hernandez P., Jung J.I., Cowansage K.K., Deinhardt K., Chao M.V., Abel T., Klann E. Reversal of impaired hippocampal long-term potentiation and contextual fear memory deficits in Angelman syndrome model mice by ErbB inhibitors. Biol. Psychiatry. 2012;72:182–190. doi: 10.1016/j.biopsych.2012.01.021. [DOI] [PMC free article] [PubMed] [Google Scholar]
- 40.Woo R.S., Lee J.H., Yu H.N., Song D.Y., Baik T.K. Expression of ErbB4 in the neurons of Alzheimer's disease brain and APP/PS1 mice, a model of Alzheimer's disease. Anat. Cell Biol. 2011;44:116–127. doi: 10.5115/acb.2011.44.2.116. [DOI] [PMC free article] [PubMed] [Google Scholar]
- 41.Cai Z., Yan L.J., Li K., Quazi S.H., Zhao B. Roles of AMP-activated protein kinase in Alzheimer's disease. Neuromolecular Med. 2012;14:1–14. doi: 10.1007/s12017-012-8173-2. [DOI] [PubMed] [Google Scholar]
- 42.Potter W.B., O'Riordan K.J., Barnett D., Osting S.M., Wagoner M., Burger C., Roopra A. Metabolic regulation of neuronal plasticity by the energy sensor AMPK. PLoS One. 2010;5:e8996. doi: 10.1371/journal.pone.0008996. [DOI] [PMC free article] [PubMed] [Google Scholar]
- 43.Chen L., Xu B., Liu L., Luo Y., Yin J., Zhou H., Chen W., Shen T., Han X., Huang S. Hydrogen peroxide inhibits mTOR signaling by activation of AMPKalpha leading to apoptosis of neuronal cells. Lab. Invest. 2010;90:762–773. doi: 10.1038/labinvest.2010.36. [DOI] [PMC free article] [PubMed] [Google Scholar]
- 44.Kondo T., Sharp F.R., Honkaniemi J., Mikawa S., Epstein C.J., Chan P.H. DNA fragmentation and prolonged expression of c-fos, c-jun, and hsp70 in kainic acid-induced neuronal cell death in transgenic mice overexpressing human CuZn-superoxide dismutase. J. Cereb. Blood Flow Metab. 1997;7:241–256. doi: 10.1097/00004647-199703000-00001. [DOI] [PubMed] [Google Scholar]
- 45.Chaum E., Yin J., Lang J.C. Molecular responses transduced by serial oxidative stress in the retinal pigment epithelium: feedback control modeling of gene expression. Neurochem. Res. 2011;36:574–582. doi: 10.1007/s11064-010-0370-5. [DOI] [PubMed] [Google Scholar]
- 46.Kaur J., Bansal M.P. Effect of vitamin E on alcohol-induced changes in oxidative stress and expression of transcription factors NFkappaB and AP-1 in mice brain cerebral hemispheres. Indian J. Exp. Biol. 2008;46:562–567. [PubMed] [Google Scholar]
- 47.Sun L.Y., Steinbaugh M.J., Masternak M.M., Bartke A., Miller R.A. Fibroblasts from long-lived mutant mice show diminished ERK1/2 phosphorylation but exaggerated induction of immediate early genes. Free Radic. Biol. Med. 2009;47:1753–1761. doi: 10.1016/j.freeradbiomed.2009.09.021. [DOI] [PMC free article] [PubMed] [Google Scholar]
- 48.Tlili A., Hoischen A., Ripoll C., Benabou E., Badel A., Ronan A., Touraine R., Grattau Y., Stora S., van Bon B., et al. BDNF and DYRK1A are variable and inversely correlated in lymphoblastoid cell lines from Down syndrome patients. Mol. Neurobiol. 2012;46:297–303. doi: 10.1007/s12035-012-8284-7. [DOI] [PubMed] [Google Scholar]
- 49.Duchon A., Raveau M., Chevalier C., Nalesso V., Sharp A.J., Herault Y. Identification of the translocation breakpoints in the Ts65Dn and Ts1Cje mouse lines: relevance for modeling Down syndrome. Mamm Genome. 2011;22:674–684. doi: 10.1007/s00335-011-9356-0. [DOI] [PMC free article] [PubMed] [Google Scholar]
- 50.Reinholdt L.G., Ding Y., Gilbert G.J., Czechanski A., Solzak J.P., Roper R.J., Johnson M.T., Donahue L.R., Lutz C., Davisson M.T. Molecular characterization of the translocation breakpoints in the Down syndrome mouse model Ts65Dn.Mamm. Genome. 2011;22:685–691. doi: 10.1007/s00335-011-9357-z. [DOI] [PMC free article] [PubMed] [Google Scholar]
- 51.Chen J.S., Su I.J., Leu Y.W., Young K.C., Sun H.S. Expression of T-cell lymphoma invasion and metastasis 2 (TIAM2) promotes proliferation and invasion of liver cancer. Int. J. Cancer. 2012;130:1302–1313. doi: 10.1002/ijc.26117. [DOI] [PubMed] [Google Scholar]
- 52.Lott I.T., Doran E., Nguyen V.Q., Tournay A., Head E., Gillen D.L. Down syndrome and dementia: a randomized, controlled trial of antioxidant supplementation. Am. J. Med. Genet. A. 2011;155A:1939–1948. doi: 10.1002/ajmg.a.34114. [DOI] [PMC free article] [PubMed] [Google Scholar]
- 53.Hanney M., Prasher V., Williams N., Jones E.L., Aarsland D., Corbett A., Lawrence D., Yu L.M., Tyrer S., Francis P.T., et al. MEADOWS trial researchers. Memantine for dementia in adults older than 40 years with Down's syndrome (MEADOWS): a randomised, double-blind, placebo-controlled trial. Lancet. 2012;379:528–536. doi: 10.1016/S0140-6736(11)61676-0. [DOI] [PubMed] [Google Scholar]
- 54.Boada R., Hutaff-Lee C., Schrader A., Weitzenkamp D., Benke T.A., Goldson E.J., Costa A.C. Antagonism of NMDA receptors as a potential treatment for Down syndrome: a pilot randomized controlled trial. Transl. Psychiatry. 2012;2:e141. doi: 10.1038/tp.2012.66. [DOI] [PMC free article] [PubMed] [Google Scholar]
- 55.Ahmed M.M., Gardiner K.J. Preserving protein profiles in tissue samples: differing outcomes with and without heat stabilization. J. Neurosci. Methods. 2011;196:99–106. doi: 10.1016/j.jneumeth.2011.01.004. [DOI] [PMC free article] [PubMed] [Google Scholar]
- 56.Svensson M., Boren M., Sköld K., Fälth M., Sjögren B., Andersson M., Svenningsson P., Andren P.E. Heat stabilization of the tissue proteome: a new technology for improved proteomics. J. Proteome Res. 2009;8:974–981. doi: 10.1021/pr8006446. [DOI] [PubMed] [Google Scholar]
Associated Data
This section collects any data citations, data availability statements, or supplementary materials included in this article.