

Agropyron elongatum introgression into bread wheat (Triticum aestivum) improves root traits for drought adaptation.
Abstract
Root architecture traits are an important component for improving water stress adaptation. However, selection for aboveground traits under favorable environments in modern cultivars may have led to an inadvertent loss of genes and novel alleles beneficial for adapting to environments with limited water. In this study, we elucidate the physiological and molecular consequences of introgressing an alien chromosome segment (7DL) from a wild wheat relative species (Agropyron elongatum) into cultivated wheat (Triticum aestivum). The wheat translocation line had improved water stress adaptation and higher root and shoot biomass compared with the control genotypes, which showed significant drops in root and shoot biomass during stress. Enhanced access to water due to higher root biomass enabled the translocation line to maintain more favorable gas-exchange and carbon assimilation levels relative to the wild-type wheat genotypes during water stress. Transcriptome analysis identified candidate genes associated with root development. Two of these candidate genes mapped to the site of translocation on chromosome 7DL based on single-feature polymorphism analysis. A brassinosteroid signaling pathway was predicted to be involved in the novel root responses observed in the A. elongatum translocation line, based on the coexpression-based gene network generated by seeding the network with the candidate genes. We present an effective and highly integrated approach that combines root phenotyping, whole-plant physiology, and functional genomics to discover novel root traits and the underlying genes from a wild related species to improve drought adaptation in cultivated wheat.
During the Green Revolution, high-yielding semidwarf wheat (Triticum aestivum) and rice (Oryza sativa) cultivars were bred for improved responsiveness to irrigation and fertilizer (Borlaug, 2008). In wheat, this was made possible by Rht dwarfing alleles, which improved harvest index and reduced lodging under favorable conditions (Hedden, 2003). However, selection for the aboveground traits and yield under optimal environments may have led to a reduction in root parameters that may be adaptive to environments with limited water. Root biomass in modern high-yielding cultivars from the International Maize and Wheat Improvement Center is lower than in old tall landraces (Waines and Ehdaie, 2007). This difference was hypothesized to be consistent with an inadvertent selection of smaller, more compact root systems under optimal conditions.
As agriculture is increasingly shifted to marginal lands and drought events become more frequent and intense, specific root morphological traits that can improve drought tolerance and sustain yields in suboptimal conditions hold immense potential. To effectively incorporate drought-adaptive root traits in crops like wheat and rice, we need to better understand the genetic and physiological basis of adaptive root traits and explore the novel alleles or genes that were likely lost during domestication or through breeding for yield under optimal environments. Considerable genetic variation exists for root-related traits in major crops such as wheat, rice, and maize (Zea mays) in both the domesticated species as well as wild relatives (Reynolds et al., 2007; Ribaut et al., 2009; Gowda et al., 2011).
Here, we focus on the potential of wild wheat species to contribute to adaptive root traits under water limitations. Introduction of alien chromosome segments from wild relatives into wheat has resulted in improved pest resistance and yield (Rabinovich, 1998; Singh et al., 1998; Reynolds et al., 2001; Monneveux et al., 2003; Waines and Ehdaie, 2007). Rye-wheat translocations, for example, have been used to introduce traits for tolerance to abiotic and biotic stresses, resulting in improved yields in some cases (Zeller, 1973; Waines and Ehdaie, 2007). Genes providing resistance to biotic stresses such as stem rust (Puccinia graminis), powdery mildew (Blumeria graminis f. sp. tritici), and greenbug have been successfully introgressed from rye (Secale cereale) into modern wheat germplasm (Friebe et al., 1996; Graybosch, 2001; Waines and Ehdaie, 2007; Yediay et al., 2010). In addition to pathogen resistance, the rye-wheat translocation (1RS) has been reported to have significant effects on yield, root morphology, and water and nitrogen use efficiency (Rabinovich, 1998; Ehdaie et al., 2003, 2012; Sharma et al., 2010). The presence of the 1RS translocation reduced central metaxylem diameter, a trait that has been associated with drought tolerance in wheat (Richards and Passioura, 1989; Sharma et al., 2010).
Introgressions from Agropyron elongatum into bread wheat have improved pest resistance, biomass, and yield under irrigated conditions (Monneveux et al., 2003). Specifically, chromosome 7E of A. elongatum has been a valuable source of genetic variation for bread wheat, improving yield and providing resistance to barley yellow dwarf virus, stripe rust (Puccinia striiformis), and leaf rust (Puccinia triticina) resistance (Sharma et al., 1995; Ma et al., 2000; Zu-Jun and Zheng-Long, 2001; Monneveux et al., 2003). In addition to harboring pathogen resistance genes, several Agropyron species and wheat × A. elongatum lines have been reported to enhance tolerance to abiotic stresses, including drought, waterlogging, and salinity (Dvorák et al., 1988; Wang and Zhang, 1996; McDonald et al., 2001). In hexaploid wheat, introgressions of 7DL.7EL, originally used to introduce leaf rust resistance, have been reported to increase biomass and yield in various wheat backgrounds (Sears, 1956; Reynolds et al., 2001).
The reported yield increase associated with the 7DL.7EL translocation lines relative to control genotypes and the presence of genes improving tolerance to abiotic stresses on 7EL led us to investigate this specific chromosomal segment for traits associated with yield (Singh et al., 1998; Monneveux et al., 2003; Zhang et al., 2005). We hypothesized that the 7DL.7EL translocation could be improving yields and water use efficiency in some environments due to adaptive root traits introduced through the A. elongatum chromosomal segment. It is possible that 7EL translocations could be either introducing novel root-related genes into wheat from the wild relative or incorporating alleles lost during intense selection under optimal environment. The original 7DL.7EL translocation carried locus Y for yellow flour, which limited its use in breeding. For this study, we chose a newly engineered version of the 7DL.7EL translocation with Y removed (Zhang et al., 2005), the recipient parent spring wheat line, and sister lines of the translocation line served as additional controls. Our experiments aim to address whether the 7DL.7EL translocation improves root traits. If it does, then what are the physiological consequences of the altered root traits under water-limiting environments? We next explore the molecular basis of altered root traits to identify underlying genes or alleles that can be used to improve wheat yields in marginal environments. We present an effective approach for addressing these questions by integrating root phenotyping, with whole plant physiology, transcriptomics, and computational biology tools, to discover novel root traits and candidate genes underlying these traits.
RESULTS
A. elongatum Translocation Introduces a Drought-Adaptive Response in Wheat
We hypothesized that the differences in biomass and yield between the A. elongatum 7DL lines and the corresponding parental genotypes could be due to increased investment in root production, thus increasing the acquisition of water and nutrients from the soil. We used a parent line, Pavon76 (P76), the 1-96-1 translocation line (TL), and a negative control (NC) for the translocation event for our experiments (Fig. 1). Phenotypic screening at an early seedling stage showed that reduced water availability had negative effects on several root traits in P76 and NC. Primary root length was significantly reduced at 4 and 6 d in P76 and NC (P ≤ 0.05; Table I), while significant reductions in seminal root length were observed in these genotypes at 2, 4, and 6 d when compared with well-watered conditions (P ≤ 0.05; Supplemental Table S1). Furthermore, the number and density of lateral roots on the primary and seminal root axis of P76 and NC under limited-water conditions were significantly less than in well-watered conditions at 4 and 6 d (P ≤ 0.01; Table I; Supplemental Table S1). Water deficit also reduced shoot length in P76 and NC at day 6 (P ≤ 0.05; Table I). In striking contrast, TL exhibited no significant reductions in lateral root number, density, or the length of primary or seminal roots at any time point in response to water stress. The shoot length in TL did not decrease significantly during water stress. These data suggest that the A. elongatum translocation could influence both root and shoot traits when plants are water stressed. Similar results were observed when the experiment was repeated with one-tenth-strength Hoagland solution to ensure any confounding effects of nutrient availability (Supplemental Table S2). Collectively, these observations suggested that the presence of a 7DL.7EL segment in the P76 background could be conferring an adaptive response under water limitation in the translocation line. The results from early-seedling phenotyping prompted us to investigate the differences in root architecture and shoot photosynthetic traits in older plants.
Figure 1.

Visualization of wheat-A. elongatum translocation. An International Maize and Wheat Improvement Center hexaploid wheat cultivar, P76, carrying a chromosome 7 segment from A. elongatum (7Ag.7DL) is visualized by genomic in situ hybridization. In both images, green staining represents the translocated segment from A. elongatum. Wheat genomic probe was directly labeled with rhodamine (red). We performed root system architecture analysis on the background parent P76 as well as TL and NC.
Table I. Phenotypic evaluation of the early seedling root system.
Phenotyping of Spring Wheat genotypes P76, TL, and NC was done using the cigar roll method. The total number of lateral roots (more than 1 mm) on the primary root axis was counted. Lateral root density was calculated by dividing the number of lateral roots on the primary root axis by the primary root length. Statistical significance was determined using a one-way ANOVA using Tukey’s method. Asterisks indicate significant differences observed between treatments for each genotype as follows: ***P ≤ 0.001, **P ≤ 0.01, *P ≤ 0.05. se values are shown. nd, Not detected. This method was repeated three times using 30 wheat seedlings per cultivar per experiment.
| Parameter |
P76 |
TL |
NC |
||||||
|---|---|---|---|---|---|---|---|---|---|
| 2 d | 4 d | 6 d | 2 d | 4 d | 6 d | 2 d | 4 d | 6 d | |
| Lateral root number | |||||||||
| Well watered | nd | 4.6 ± 0.3 | 23.0 ± 0.5 | nd | 5.0 ± 0.3 | 26.6 ± 0.6 | nd | 4.8 ± 0.2 | 23.4 ± 0.9 |
| Limited water | nd | 1.3 ± 0.6** | 8.8 ± 1.9*** | nd | 5.1 ± 0.9 | 27.6 ± 2.3 | nd | 1.2 ± 0.6** | 8.8 ± 1.1*** |
| Primary root length (mm) | |||||||||
| Well watered | 7.6 ± 0.2 | 19.2 ± 0.3 | 25.0 ± 0.6 | 8.3 ± 0.2 | 19.8 ± 0.2 | 27.1 ± 0.8 | 8.1 ± 0.2 | 18.5 ± 0.5 | 25.1 ± 0.9 |
| Limited water | 7.2 ± 0.2 | 14.1 ± 1.0*** | 18.7 ± 1.9* | 7.2 ± 0.7 | 18.2 ± 0.9 | 27.5 ± 0.6 | 7.4 ± 0.3 | 14.4 ± 0.4*** | 19.5 ± 0.6*** |
| Lateral root density (mm−1) | |||||||||
| Well watered | nd | 0.24 ± 0.02 | 0.92 ± 0.01 | nd | 0.25 ± 0.02 | 1.00 ± 0.03 | nd | 0.26 ± 0.02 | 0.93 ± 0.01 |
| Limited water | nd | 0.08 ± 0.04** | 0.47 ± 0.08*** | nd | 0.28 ± 0.05 | 1.00 ± 0.08 | nd | 0.08 ± 0.04** | 0.44 ± 0.05*** |
| Shoot length (mm) | |||||||||
| Well watered | 2.9 ± 0.2 | 8.3 ± 0.6 | 12.5 ± 0.6 | 3.3 ± 0.2 | 9.2 ± 0.6 | 12.7 ± 0.7 | 3.2 ± 0.2 | 8.6 ± 0.8 | 13.1 ± 0.8 |
| Limited water | 2.4 ± 0.2 | 6.8 ± 0.5 | 9.7 ± 1.0* | 2.9 ± 0.1 | 8.5 ± 0.6 | 12.3 ± 0.5 | 3.0 ± 0.2 | 7.3 ± 0.5 | 9.8 ± 0.5* |
TL Lines Have Higher Shoot and Root Biomass under the Limited-Water Condition
To observe the effect of the 1-96-1 translocation on root and shoot phenotypes at the pretillering stage, we sampled plants at 18 d after germination. The root and shoot biomass of P76 and NC plants under water stress decreased significantly (P ≤ 0.01; Fig. 2; Table II). However, in TL, water stress did not significantly alter root or shoot biomass. Under water stress, TL had higher root (P ≤ 0.01) and shoot (P ≤ 0.001) biomass compared with P76 and NC (Fig. 2; Table II). Both root and shoot length measured slightly higher in TL under water stress relative to well-watered TL plants. Under well-watered conditions, there were no differences in root and shoot lengths and dry weights among genotypes. The phenotypic measurements indicate that the 1-96-1 translocation alters root traits but not at the cost of shoot biomass under water-limiting conditions.
Figure 2.

Harvested spring wheat P76 genotypes grown in the greenhouse under well-watered (A) and limited-water (B) environments. The images show 18-d-old wheat plants (pretillering stage) grown in tubes containing fine sand. The genotypes are indicated.
Table II. Summary of shoot and root lengths and biomasses of Spring Wheat genotypes P76, TL, and NC.
The lengths were measured at the time of harvest, while the shoot and root dry mass were weighed separately after 5 d of incubation in a 60°C chamber. Statistical significance was determined using a one-way ANOVA using Tukey’s method. Asterisks indicate significant differences observed between treatments for each genotype as follows: ***P ≤ 0.001, **P ≤ 0.01. se values are shown. This method was repeated three times using 35 wheat plants per cultivar per experiment.
| Genotype | Shoot |
Root |
||
|---|---|---|---|---|
| Well Watered | Limited Water | Well Watered | Limited Water | |
| Dry weight (mg) | ||||
| P76 | 366.6 ± 57.8 | 209.5 ± 30.0*** | 343.6 ± 56.1 | 192.2 ± 18.2*** |
| TL | 327.0 ± 51.1 | 336.4 ± 53.1 | 335.7 ± 81.0 | 290.2 ± 44.4 |
| NC | 320.9 ± 16.9 | 219.5 ± 30.5** | 318.9 ± 54.1 | 206.7 ± 39.4*** |
| Length (cm) | ||||
| P76 | 35.2 ± 13.1 | 24.8 ± 2.0 | 76.2 ± 6.8 | 71.1 ± 3.8 |
| TL | 26.1 ± 2.3 | 27.5 ± 2.8 | 75.6 ± 4.0 | 79.6 ± 7.0 |
| NC | 27.6 ± 3.0 | 26.3 ± 1.9 | 79.8 ± 10.6 | 78.4 ± 2.9 |
Stomatal Factors Limit Photosynthesis in P76 and NC during Water Deficit
To elucidate the physiological impact of higher root biomass in TL during water stress, the CO2 assimilation and gas-exchange rates were measured for the three genotypes. Carbon assimilation was different among the three genotypes under limited-water conditions (Fig. 3). Photosynthetic rates were reduced by 45% and 46% in P76 and NC (P ≤ 0.001), respectively, but did not change significantly in TL (Fig. 3A). Water deficit also severely impacted stomatal conductance and transpiration, reducing stomatal conductance by 50% and 56% (P ≤ 0.001) and transpiration rate by 39% and 49% (P ≤ 0.001) compared with well-watered conditions in P76 and NC, respectively (Fig. 3, B and C). Stomatal conductance was also reduced (P ≤ 0.001) in TL, but only by 16%. No reductions in transpiration were observed for TL during water deficit. Clearly, TL showed lower sensitivity to water limitation compared with P76 and NC.
Figure 3.

Physiological analyses to assess the response by each genotype under well-watered and limited-water conditions. A to C, Photosynthetic rate (Pn; A), stomatal conductance (gs; B), and transpiration rate (E; C) measurements using the LI-COR 6400 for 18-d-old posttransplanted spring wheat plants. D to F, Fv′/Fm′ (D), photochemical quenching (qP; E), and nonphotochemical quenching (qN; F). Experiments were performed three times independently. At least nine individual leaves for each genotype in each experiment were measured. Error bars represent se. Statistical significance was determined using a one-way ANOVA using Tukey’s method. Asterisks represent statistically significant differences between genotypes within a treatment: ***P ≤ 0.001, **P ≤ 0.01, *P ≤ 0.05. The genotypes are indicated in the key at right.
Reductions in gas exchange and carbon assimilation are common in drought-stressed plants due to decrease in stomatal aperture. However, other aspects of photosynthesis, such as light utilization and photosynthetic electron transport, can also be impacted by drought stress. Therefore, we also measured chlorophyll fluorescence at the pretillering stage. Calculation of maximum quantum efficiency of open PSII reaction centers (Fv′/Fm′) and the amount of energy used to drive photosynthesis (photochemical quenching) or dissipated as heat (nonphotochemical quenching) from fluorescence data are described in “Materials and Methods.” In well-watered conditions, no differences in Fv′/Fm′, photochemical quenching, or nonphotochemical quenching were observed among the genotypes (Fig. 3, D–F). Photochemical quenching increased under limited water by 12% and 9% in P76 and NC, respectively, but not in TL.
In addition to stomatal aperture and photosynthetic electron transport, biochemical components of carbon assimilation, such as the carboxylation of ribulose-1,5-bisphosphate (RuBP) or the rate at which RuBP is regenerated, contribute to the photosynthetic capacity of a plant. To assess whether biochemical factors were contributing to the decline in CO2 assimilation in P76, NC, and TL during water deficit, CO2 assimilation was measured at a series of CO2 concentrations and plotted against intercellular CO2, and the maximum rate of carboxylation by Rubisco (Vcmax) and the RuBP regeneration rate (Jmax) were calculated according to the methods outlined by Dubois et al. (2007). Under limited-water conditions, Jmax declined significantly by 31% and 24% in P76 and NC, respectively (P ≤ 0.05; Fig. 4; Table III) but did not change in TL. Vcmax was reduced by 31% in P76 (P ≤ 0.05). However, it increased in TL by 18%. Although a 7% reduction in Vcmax was observed in NC, the difference was not significant. The results suggest that the major cause of photosynthetic decline in P76 and NC during water stress could be RuBP regeneration rate.
Figure 4.

A/Ci curve analysis of P76, TL, and NC under well-watered and limited-water environments. The CO2 assimilation rate (A; µmol m−2 s−1) was measured at light saturation (photosynthetically active radiation = 1,000 µmol m−2 s−1) and recorded at different chamber CO2 concentrations. Experiments were performed three times independently. Six leaf samples per genotype per experiment were used for measurements.
Table III. Vcmax and Jmax.
Summary of CO2 assimilation (A)/Ci curve estimates of Vcmax and Jmax of P76, TL, NC using the methods described by Dubois et al. (2007). Asterisks denote statistical differences between treatments for each genotype: *P ≤ 0.05.
TL Differentially Regulates Genes Associated with Root Architecture
To elucidate the molecular mechanism underlying the increased root biomass phenotype observed in TL during water stress, we analyzed the root transcriptome of the three genotypes at the pretillering stage (18 d) under well-watered and water-stressed conditions. Lists of differentially expressed genes from various comparisons are provided as Supplemental Table S3 and Supplemental File S1. Several genes known to play roles in root development were differentially expressed between the TL and P76/NC lines in limited-water samples. One of these genes is a wheat ortholog of the KNOTTED-LIKE3 (KNAT3) homeobox gene in Arabidopsis (Arabidopsis thaliana). KNAT3 was down-regulated in roots and shoots of TL compared with P76 and NC under limited-water conditions (Fig. 5, D and G). In Arabidopsis, KNAT3 has been proposed to act as a negative regulator of lateral root development (Truernit et al., 2006; Truernit and Haseloff, 2007). KNAT3 expression level differences among the genotypes are notable in the context of increased lateral root formation in TL under water stress. KNAT3 transcript abundance in early seedlings was lower (P ≤ 0.001) at 4 d in TL compared with P76 and NC (Fig. 5A). At 6 d after germination, KNAT3 was down-regulated in TL compared with P76 at 2 d, while KNAT3 expression was slightly up-regulated in both P76 and NC when compared with P76 at 2 d. No genotypic differences were observed at 2 d after germination.
Figure 5.

Gene expression analysis of root-related genes by qRT-PCR. A to C, Expression of microarray genes in early seedling stages using root tissues collected at 2, 4, and 6 d. The genotypes are indicated. P76 at 2 d was used as a reference for comparison for each gene expression. D to F, Validation of microarray gene expression using cDNA from 18-d shoot tissues of P76, TL, and NC. G to I, Validation of microarray gene expression using cDNA from 18-d root tissues of P76, TL, and NC. The P76 well-watered value was used as a baseline for comparison for gene expression analysis for both root and shoot assays. The representative genes are as follows: KNAT3, E2F, and SERK1. The error bars represent se. The experiment was performed using three biological replicates with two technical replicates per sample. Statistical significance was determined using a one-way ANOVA using Tukey’s method. Asterisks represent statistically significant differences: ***P ≤ 0.001, **P ≤ 0.01, *P ≤ 0.05.
A wheat E2F-RELATED (E2F) transcription factor is down-regulated in roots and shoots of TL under water-limited conditions compared with P76 and NC (Fig. 5, E and H). E2F proteins are a family of transcription factors that regulate cell cycle progression in plants and animals. In Arabidopsis, E2Fc is known to play an antagonistic role in cell division and is a negative regulator of lateral root formation (del Pozo et al., 2002; Ramirez-Parra et al., 2004). We validated the expression of E2F using quantitative PCR (qRT-PCR) in pretillering stage and early seedling stage plants (Fig. 5, B, E, and F). Water stress caused a significant reduction (P ≤ 0.05) in E2F expression in both TL and P76 during the pretillering stage, while no significant reductions were observed in NC when compared with well-watered plants. However, at the pretillering stage, the transcript abundance of E2F was 5-fold less in TL compared with P76 in water-limited conditions. The expression patterns of E2F in seedling roots was significantly repressed (P ≤ 0.05) in TL compared with P76 and NC at 4 and 6 d (Fig. 5B).
The expression of SOMATIC EMBRYOGENESIS RECEPTOR KINASE1 (SERK1), a member of the Leu-rich repeat, receptor-like kinase protein family, was notable among the differentially expressed genes among the genotypes during water stress. SERK1 was up-regulated in roots and shoots of TL under water limitation compared with P76 in the array experiment (Fig. 5). Expression of SERK1 in TL was 3-fold higher than in NC under water stress. SERK1 plays a critical role in root differentiation in response to auxin in addition to being involved in somatic embryogenesis and gamete development (Walker, 1994; Schmidt et al., 1997; Somleva et al., 2000; Hecht et al., 2001). Higher expression of SERK1 in TL relative to P76 and NC was validated by qRT-PCR in roots of pretillering plants. SERK1 expression was significantly induced in 4- and 6-d TL seedling roots but not in P76 and NC (Fig. 5C). In summary, our transcriptome analysis identified several differentially regulated genes that could directly or indirectly be associated with the 1-96-1 translocation. We have focused on a small subset of genes for further characterization based on their role in growth and development in model species.
Gene Network Analysis Predicts the Differential Regulation of Brassinosteroid-Associated Genes in the A. elongatum Translocation Line during Water Stress
To further extract A. elongatum-associated genetic components involved in the water stress response from our list of differentially expressed microarray genes, we used the wheat-rice orthologous relationships to generate gene regulatory networks using a computational approach. Gene networks were constructed using the recently developed Web-based tool RiceNet to determine putative relationships among genes and predict root trait-associated genes (Lee et al., 2011). Although RiceNet was designed to predict functional relationships among rice genes, it has been shown to accurately predict functional interactions in other monocotyledonous crop species such as maize (Lee et al., 2011). Coexpression network analysis is likely to uncover some genes that are expected to be missed in transcriptome analysis due to low expression levels or lack of representation on the wheat array. RiceNet combines functional genomics, proteomics, and comparative genome-scale data sets from diverse organisms to predict functional relationships among genes using a Bayesian log likelihood scoring method (Lee et al., 2011). Comparisons of the root transcriptomes of P76 and TL under limited-water conditions resulted in the identification of 384 differentially expressed wheat transcripts. Of these, 224 were assigned to corresponding rice loci. After removal of duplicate loci, a list of 202 genes was queried in RiceNet, resulting in the construction of nine networks from 58 connected genes. Fifty genes were not found in RiceNet, while an additional 94 genes remained unlinked to other genes in the input set. We selected candidate genes with a log likelihood score of 2.0 or greater, with particular focus on genes associated with the regulation of cell division, growth, and root development.
We found a network populated by genes that are either induced by brassinosteroids (BRs) or directly involved in BR signaling, suggesting that BR-associated genes could be differentially regulated in TL (Fig. 6). This network consists of six genes identified during microarray analysis and five predicted genes. The network includes a component of the BR receptor protein complex, BRASSINOSTEROID-INSENSITIVE1 (BRI1). Although BRI1 was not identified from our microarray analysis, its expression was also up-regulated in TL compared with P76 under water-limited conditions in our real-time PCR assays (Fig. 6; Supplemental Table S4). This is consistent with the role of BR in promoting cell wall loosening, root elongation, and lateral root development (Müssig et al., 2003; Bao et al., 2004; Wolf et al., 2012). During the early seedling stage, the expression of network members CELLULOSE SYNTHASE3 (CESA3) and SERK1 was higher in TL at 4 and 6 d compared with P76 and NC. Differences in lateral root production were also observed at these time points in TL relative to the other two genotypes. The BR gene regulatory network identified from our analysis yielded other members that are listed in Supplemental Table S4. Several of these genes have been reported previously to have root-specific phenotypes when their expression is altered in mutants and/or transgenic plants in model species.
Figure 6.

Predicted root-associated gene network based on transcriptome data from the wheat experiment. The network was generated by leveraging the wheat-rice orthologous relationship. Wheat genes differentially expressed between P76 and TL were identified, and their orthologs were used to seed the network using the RiceNet network tool. The displayed network is populated by genes known to be involved in root trait regulation in model species such as Arabidopsis. New genes (square nodes) connected to the input gene set were identified based on RiceNet analysis. The network includes CESA3, CTL1, COB1, RLK902, GH9B7, BRI1, PROTEIN PHOSPHATASE2C (PP2C), ERECTA-LIKE1 (ERL1), SERK1, F-BOX21 (FBL21), and LEU-RICH REPEAT (LRR1).
Single-Feature Polymorphism Analysis to Map Wheat Orthologs to Brachypodium and Rice Genomes for Syntenic Clusters
We next explored if the root-related differentially expressed genes identified from the microarray analysis between TL, P76, and NC map to the 7DL translocation. We used the wheat array transcriptome data set to mine for polymorphisms between TL, P76, and NC using single-feature polymorphism (SFP) analysis (Cui et al., 2005; Walia et al., 2007; Kim et al., 2009). SFP analysis can utilize the transcriptome data as a proxy for DNA to identify polymorphic probes indicative of underlying sequence differences between the A. elongatum genes and cultivated wheat alleles. It is important to mention that the presence of a high SFP score probe does not imply differential regulation of the gene represented by the SFP probe. We hypothesized that if most of the SFP-based polymorphisms are due to A. elongatum introgression, then many of their orthologs should cluster together on a reference genome such as Brachypodium (Brachypodium distachyon) or rice due to the conservation of synteny. Using 19 as an arbitrary cutoff value, our analysis yielded 29 probe sets. The highest score was 42.3 (scores and BLAST hits to the Brachypodium and rice genomes are provided as Supplemental Table S5 and Supplemental File S2). Eight probe sets either did not have a BLAST match to the Brachypodium genome or the e-score for the alignment was higher than −20. Of the 20 probe sets that met the threshold criterion, eight mapped to a 7DL syntenic region spanning 2.2 Mb in the Brachypodium genome (Fig. 7). When the same threshold criterion was applied to the rice genome, five of the 18 SFP probe sets mapped to a 7DL syntenic region on rice chromosome 6 based on BLAST alignments (Supplemental Fig. S1; Sorrells et al., 2003). Although several high-score SFP calls mapped to nonsyntenic regions, none of them clustered (three or more genes within 1 Mb) in the Brachypodium or rice genome. We selected three predicted SFPs mapping to the syntenic region on the Brachypodium and rice genomes for validation by sequencing the PCR amplicons covering the region around the individual SFP probe in wheat. We were able to confirm the polymorphic probe sequences for these three probe sets (Supplemental Fig. S2).
Figure 7.

SFP analysis and in silico mapping of wheat orthologs to the Brachypodium genome. High-scoring SFP probe sets from the comparison of P76 samples with TL samples (both well watered and limited water) were BLAST aligned against the Brachypodium genome. Best gene hits to wheat probe sets are mapped to the five chromosomes of Brachypodium. Based on this analysis, we found that eight out of the 20 Brachypodium orthologs (vertical bars) map to the syntenic region on chromosome 1. No other clusters (three or more genes in a 1-Mb window) were observed.
Mapping of Root-Related Wheat Candidate Genes to Chromosome 7DL
Based on our SFP analysis, we found that two of the previously characterized candidate genes (KNAT3 and SERK1) map to the chromosome 6 region in the SFP cluster in the rice genome (Supplemental Fig. S1). Mapping results suggest that these genes are likely located on the 7DL.7EL translocation. We confirmed the genomic locations of KNAT3 and SERK1 in wheat using genomic DNA from a subset of ditelosomic and nullisomic-tetrasomic genetic stocks. The set includes six nullisomic-tetrasomic lines, which lack chromosome 7 for a given genome (A, B, or D) and carry four copies of a corresponding homeologous chromosome of another genome, and two ditelosomic lines, in which one chromosome pair is composed entirely of either short or long arms. Both SERK1 and KNAT3 mapped to 7DL (Fig. 8). Two additional differentially expressed genes (ANNEXIN and a Leu-rich repeat extensin-like gene) also mapped to the wheat 7DL (Fig. 8). Although E2F mapped to the distal segment of rice chromosome 6 in the SFP analysis, we were unable to PCR amplify the transcript in wheat for confirmation.
Figure 8.

Chromosome mapping of five root trait-associated candidate genes using the wheat genetic stocks. Using cv Chinese Spring and nullisomic-tetrasomic and ditelosomic lines for group 7, PCR-based mapping of candidate genes was performed. The representative genes are as follows: KNAT3, SERK1, ANNEXIN (ANXN), and LEU-RICH REPEAT EXTENSIN-LIKE (LRX). These four genes were selected because they were differentially regulated between TL and control genotypes and their rice orthologs mapped to chromosome 6 with a syntenic relation to the wheat chromosome 7D long arm. CS, cv Chinese Spring; N7AT7B, nullisomic 7A-tetrasomic 7B; N7AT7D, nullisomic 7A-tetrasomic 7D; N7BT7A, nullisomic 7B-tetrasomic 7D; N7BT7D, nullisomic 7B-tetrasomic 7A; N7DT7A, nullisomic 7D-tetrasomic 7B; N7DT7B, nullisomic 7D-tetrasomic 7B; 7Dt7DL, ditelosomic 7DL; 7Dt7DS, ditelosomic 7DS.
DISCUSSION
A. elongatum 7DL.7EL translocations in wheat are known to improve yield under some rain-fed and water-limiting environments. Our results suggest that the improved yield performance could be due to a more adaptive photosynthesis and root system of the translocation lines. Initial screening at the early seedling stage revealed that TL produced more seminal and lateral roots compared with P76 and NC during water deficit. Lateral root production and primary and seminal root growth were maintained at levels similar to well-watered conditions. Higher root biomass in TL was also observed in older plants at the pretillering stage when grown under moderate water stress. A more resilient photosynthesis is maintained in the pretillering TL plants under water stress, leading to higher carbon fixation compared with control genotypes. Increased availability of carbon under water stress could be partitioned for further root growth and increased water extraction. Collectively, our data suggest that the translocation from A. elongatum introduces drought-adaptive traits that involve novel cross talk between shoot and roots that is either absent or regulated differently in P76 and NC. Water stress greatly reduced stomatal conductance and transpiration in P76 and NC during water deficit, while TL maintained stomatal conductance and transpiration rates near control conditions. Chlorophyll fluorescence measurements indicated that the imposed stress was not severe enough to impair PSII photochemistry. This is evidenced by Fv′/Fm′ values, which represent the quantum efficiency of PSII photochemistry and remain nearly identical between treatments. Reductions in Fv′/Fm′ can be attributed to nonphotochemical quenching or a reduction in the fraction of PSII reaction centers capable of photochemistry (i.e. due to photoinhibition; Papageorgiou and Govindjee, 2004). Therefore, we propose that the reduction in carbon assimilation in P76 and NC under water-limited conditions is due to reduced stomatal aperture and the resulting decline in intercellular CO2. This is supported by the observed decline in Jmax and the increase in photochemical quenching, both of which may be attributed to photorespiration. During drought periods in C3 plants, stomatal closure increases the possibility of Rubisco oxygenation. The reactions of the photorespiratory and glycolate pathways require considerable amounts of ATP and NADPH. Therefore, photorespiration may compete for ATP needed for the phosphorylation of ribulose 5-phosphate and the formation of RuBP. RuBP and ATP contents have been reported to decrease early during drought periods, even as stomatal conductance remains above 100 mmol water m−2 s−1 (Flexas and Medrano, 2002). Studies by Foyer et al. (2009) reported a significant increase in photosynthetic electron transport caused by photorespiration, which would then drive up photochemical quenching, much like what was observed in P76 and NC during water deprivation.
Due to the adaptive advantage of increased root biomass under water stress, it is important to elucidate the underlying genes and pathways that are differentially regulated in the 7DL.7EL translocation line. The transcriptome study provided candidate genes and a possible link to a BR signaling pathway that could be contributing to root biomass under water stress. Although we highlight root trait-related genes and a BR-related gene network from computational analysis, there are likely to be other important genes and networks involved in root and shoot responses to water stress that were not identified. Based on our array analysis and leveraging a rice computational resource, we have identified differentially regulated genes that could be involved in root differentiation and lateral root production in TL. For instance, a lower transcript level of KNAT3, a homeobox transcription factor, was observed during the early seedling and pretillering stages in TL compared with P76 and NC under water stress. In Arabidopsis, KNAT3 has been proposed to act as a negative regulator of lateral root development (Truernit et al., 2006; Truernit and Haseloff, 2007). Notably, lower expression of KNAT3 in TL was correlated with increased lateral root formation during the early seedling stage. Repression of KNAT3 in wheat in TL, which exhibits increased lateral roots, is consistent with the previously hypothesized role of KNAT3 in negatively regulating lateral root formation. KNAT3 maps to the 7DL region in wheat, further supporting its importance as a potential candidate for root architecture.
A second transcript corresponding to the E2F-related protein showed expression patterns similar to KNAT3 in the early seedling and pretillering stages. E2F proteins belong to a family of transcription factors that regulate cell cycle progression and cell proliferation (del Pozo et al., 2002; Ramirez-Parra et al., 2004). E2FA, a group I E2F protein, promotes cell division in pericycle tissue, stimulating lateral root development in response to auxin (Berckmans et al., 2011; Magyar et al., 2012). Other E2F proteins assume an opposite role and act as negative regulators of cell cycle progression. Down-regulation of E2Fc via RNA interference increased cell proliferation in pericycle cells, resulting in increased lateral root production (del Pozo et al., 2006). Due to the lack of sequence information regarding E2F, it remains to be determined whether the identified wheat transcript corresponds to a group I or II E2F protein. Therefore, the contribution of E2F to increased lateral root production in TL will require improved access to the wheat genome sequence.
SERK1 was mapped in silico to the distal region of rice chromosome 6, and the location was confirmed to 7DL in wheat. The network analysis revealed a connection between BR signaling and cell growth. SERK1 forms a protein complex with BRI1 in Arabidopsis. The Arabidopsis bri1 mutant exhibits reduced lateral root formation (Clouse et al., 1996; Fukaki and Tasaka, 2009). Endogenous BR application is known to alter root system architecture through synergistic action with auxin (Bao et al., 2004). Arabidopsis dwarf4 mutants defective in BR biosynthesis fail to form lateral roots when exposed to exogenous indole-3-acetic acid (Yoshimitsu et al., 2011). A number of studies have associated SERK1 expression with lateral root initiation and development (Hecht et al., 2001; Kwaaitaal et al., 2005; Kwaaitaal and de Vries, 2007; Nolan et al., 2009). This is consistent with the higher expression levels of SERK1 and increased lateral root production observed in TL during the early seedling stage. Longer primary and seminal root lengths and an increase in the number of seminal roots during the early seedling stage could possibly be due to the influence of the A. elongatum translocation on embryogenesis. In this context, it is noteworthy that SERK1 expression was reported during ovule development in all the cells of the embryo sac in Arabidopsis (Albrecht et al., 2005). Based on the expression patterns of SERK1 and E2F in TL during water stress, their role in lateral root formation, and known synergism between the auxin and BR pathways, it is possible that A. elongatum translocation could be altering hormone signaling in the roots.
The coexpression network with SERK1 identified in our analysis includes several cell wall-related genes, such as CESA3, COBRA1 (COB1), GLYCOSYL HYDROLASE9B7 (GH9B7), and CHITINASE-LIKE1 (CTL1), that are linked to BRI1 (Fig. 6). BR is known to compensate for the loss of cell wall integrity by inducing the expression of genes involved in cell wall biosynthesis (Wolf et al., 2012). Network analysis also revealed a putative relationship between CESA3 and RECEPTOR-LIKE KINASE902 (RLK902). Both genes shared similar expression patterns and were up-regulated in TL (Fig. 6; Supplemental Table S4). Repression of RLK902 has been associated with reduced root growth and root meristem size (ten Hove et al., 2011). Both phenotypes were also observed in other cellulose synthase-defective mutants (Ellis et al., 2002; ten Hove et al., 2011). The expression of several genes involved with cell growth and primary cell wall formation also showed higher expression levels in TL when compared with P76 under limited-water conditions. A transcript corresponding to the CESA3 gene in Arabidopsis was up-regulated in TL (Fig. 6; Supplemental Table S4). BR is known to induce CESA genes through the BR transcription factor BRI1-EMS-SUPPRESSOR1 (Xie et al., 2011). CTL1 was up-regulated in TL compared with P76 during water deficit (Fig. 6; Supplemental Table S4). Loss-of-function ctl1 mutants have reduced root growth and cellulose deposition and increased sensitivity to drought and saline conditions (Kwon et al., 2007). Differential expression of some of the cell wall- and BR-related network members in TL relative to P76 and NC suggests that BR signaling could be a component of root biomass plasticity observed in TL during water deficits.
For the transcriptome analysis and gene discovery, our experiments relied on the representation on the wheat microarray and the orthologous relationship between rice and wheat for input into RiceNet. It is possible that our analysis could have missed some rare genes introduced from A. elongatum that confer the observed shoot- and root-related traits under water stress. Two recent reports in wheat (TaSC) and rice (Pstol1) indicate the value of such genes that are missing from commonly used germplasm and reference genomes (Gamuyao et al., 2012; Huang et al., 2012). As the wheat draft genome becomes more accessible, future experiments using the RNAseq approach can enable the discovery of novel stress tolerance genes.
A combination of whole-plant physiological assays with functional genomics and network biology approaches enabled us to better understand the adaptive advantage introduced by an alien chromatin introgression into wheat. Our results suggest that increased lateral root production displayed by introgression line TL in response to water depletion could be one of the contributing factors to improved plant performance. Future studies will determine whether phenotypic differences observed during these early stages translate to differences in grain production during moderate drought events. Future work will involve functional characterization of the candidate genes identified from the transcriptome analysis. As phenotyping technology becomes automated and allows larger populations to be screened in a noninvasive manner, we will test if allelic variants for candidate genes identified in this study correlate with phenotypic variation for drought adaptability. Should these candidate genes provide higher yields or greater yield stability, they can be valuable for wheat breeding programs in many environments.
MATERIALS AND METHODS
Plant Material
All plant materials used in this study were obtained from A.J. Lukaszewski (University of California, Riverside). These included a third-generation derivative of the original wheat (Triticum aestivum)-Agropyron elongatum translocation chromosome produced by E.R. Sears (Sears, 1978) and controls. The starting chromosome transfer 1 (Sears, 1978) was generated by ph1b-induced homeologous recombination and consists of normal 7DS, a short proximal segment of 7DL, and a long distal segment of A. elongatum chromosome 7EL. A line of wheat ‘Chinese Spring’ homozygous for transfer 1 was crossed and backcrossed three times to P76. The last two backcrosses were to a ph1b line of Pavon, resulting in several plants heterozygous for transfer 1 and homozygous for the ph1b mutation. These plants were grown and self-pollinated, and their progeny were screened to identify secondary wheat-A. elongatum recombinant chromosomes. Among many such chromosomes isolated was a chromosome labeled 1-96 (Zhang et al., 2005). Chromosome 1-96 is essentially a normal chromosome 7D of wheat with the terminal segment of the long arm, perhaps 20% in length, originating from 7E of A. elongatum. The A. elongatum segment carries Lr19 and Y. This chromosome was again combined with the ph1b mutation in P76, and a tertiary recombinant chromosome was recovered, labeled 1-96-1. This chromosome differs from 1-96 by the absence of the terminal A. elongatum segment that normally carries the Y locus. The translocated chromosome 1-96-1 has a normal 7DS arm, a long (approximately 75%) proximal segment of 7DL, a homeologous segment from 7EL of A. elongatum, and a short terminal segment of 7DL (Fig. 1). Since the chromosome was produced by crossing over, it is assumed to be fully compensating for normal 7D. No indications of reduced compensation have been observed.
After recovery, plants with chromosome 1-96-1 were backcrossed an additional three times to P76, and two sets of sister lines were isolated among progeny from self-pollinated BC3 heterozygotes: homozygotes for the 1-96-1 translocations and disomics of normal chromosomes 7D. These two are sister lines that differ by the presence/absence of the A. elongatum segment; disomics of 7D serve as additional controls for the translocation lines. Overall, the recovered lines have eight backcrosses to P76; however, it needs to be taken into account that the ph1b lines carry substantial and extensive genome rearrangements, and new ones are generated in each generation. There were only three backcrosses to normal P76 after the last round of the ph1b-induced recombination. For this reason, additional controls in the form of sister lines are highly desirable. For simplicity, the line of P76 homozygous for the 1-96-1 translocation is referred to as TL here, P76 is referred to as P76, while the sister lines of TL without the translocation are called NC. Nullisomic-tetrasomic lines for the homeologous group 7 as well as ditelosomic lines of chromosome 7D in cv Chinese Spring were used to determine and verify the chromosome locations of various candidate genes.
Cigar Roll Root Assays
For the early seedling stage root screening, we used the cigar roll method (Zhu et al., 2006). Similar-sized seeds were germinated in a petri dish with a moist paper towel for 3 d in the dark at 22°C to 25°C. Three seedlings per genotype were placed between two sheets of germination paper and rolled vertically. Three batches of 10 cigar rolls, totaling 30 plants per genotype, were soaked in tap water and placed vertically in a 1-L beaker. For well-watered conditions, the beakers were filled with 100 mL of tap water, while 50 mL of tap water was supplied for water-limited conditions. Seedlings were grown in a controlled environment using a Percival Intellus Control System incubator (model I36VLC8) set at 25°C/27°C, 11.5-h/12.5-h day/night, 50%/70% relative humidity, and illumination of 80 μmol m−2 s−1 for the duration of the experiments (Percival Scientific). Water was added to each beaker each day to maintain the volume of 50 mL. All measurements were carried until 6 d after germination. Measurements after day 6 can potentially be affected by limiting seed resources that drive seedling growth. To ensure that the observed differences in measured traits were not due to nutrient limitations, the experiment was repeated twice with a one-tenth-strength Hoagland solution (Supplemental Table S2). Root length was measured from the tip of the root to the root-shoot junction, while shoot length was measured from the tip of the longest leaf to the root-shoot junction. To calculate lateral root density, the number of lateral roots on a branch from a main axis (primary or seminal root) was divided by the length of the root. For gene expression experiments, seedlings were harvested at 2, 4, and 6 d after germination. Root tissue samples were collected and snap frozen.
Greenhouse Experiments
Seeds were germinated in glass petri dishes in the dark at 25°C. Once the coleoptiles were approximately 1 cm, uniform seedlings were selected and transplanted to polyvinyl chloride pipes (1 m × 15.5 cm [height × diameter]; NDS). Each pipe was lined with clear polyplastic bags (153 cm × 18.5 cm [length × width]; Uline) and filled with approximately 9 kg of fine silica sand (Lane Mountain). A gap was maintained between the plastic bags and the inner wall of the pipes. Small holes were made at the side and bottom of the plastic bags as well as the pipes to provide adequate aeration and drainage. For the first week after transplant, each tube was watered daily with 100 mL. After the first week, the well-watered, control plants were supplied with 50 mL of tap water and 50 mL of one-half-strength Hoagland solution twice weekly (irrigated four times per week). For the limited-water treatment, each tube received 50 mL of one-half-strength Hoagland solution twice weekly. Each treatment consisted of seven replicates per genotype with five plants per tube/replicate (35 plants per treatment). For limited-water conditions, the watering regime of 100 mL per week was based on preliminary experiments with 200, 100, and 50 mL of water twice per week for water stress. At the 200-mL watering level, we did not observe a difference in root and shoot biomass among the genotypes, and the sand column was fairly wet at 3 weeks post germination. At the 50-mL watering level, almost all plants from the three genotypes had senesced and were not suitable for photosynthetic measurements. We observed clear differences in the 100-mL treatment in root and shoot biomass. Furthermore, in the 100-mL water stress treatment, the sand column was fairly dry and all three genotypes showed a decrease in stomatal conductance indicative of successful imposition of a moderate water stress.
The pretillering stage experiment was done from July to October 2011. The greenhouse temperature was set between 26.7°C and 32.2°C during the day and 26.1°C to 29.4°C during the night, humidity ranged from 33% to 73%, and the light period was 7:00 am to 6:00 pm by Metal Halide Lamp 1,000-W bulbs (Philips Lighting). Using the LI-250A Light Meter, the average light reading was 215.8 ± 44.5 µmol m−2 s−1 (LI-COR Biosciences).
Wheat roots were harvested 18 d after germination. The plastic sleeve was carefully removed from each tube, and the plastic lining was cut gently to avoid root damage. Roots were gently removed from the sand column. Excess sand was removed using a paintbrush with soft bristles, and root and shoot lengths were recorded immediately. Shoot length was measured from the tip of the leaf to the root-shoot junction, while root length was measured from the root-shoot junction to the longest root. Root and shoot dry weights were determined after drying for 5 d at 60°C. Statistical analyses were done using the one-way ANOVA function using Tukey’s method in the R-Commander package for R (Fox, 2005).
Chlorophyll Fluorescence, Photosynthesis, and Gas-Exchange Measurements
Chlorophyll fluorescence measurements were recorded at day 18 after transplant for each treatment on the leaf below the newest fully expanded leaf using a portable photosynthesis system (LI-COR 6400xt) equipped with a leaf chamber fluorometer (LI-COR 6400-40; LI-COR Biosciences). The area of each leaf in the leaf chamber was determined, and values were entered manually into the system. Measurements were recorded between 10:00 am and 2:00 pm. Reference CO2 levels were maintained at 400 µmol s−1, and chamber flow was set at 500 µmol. Actinic light intensity was set at 1,000 µmol with 10% blue light-emitting diodes. Maximal fluorescence values of light-adapted leaves were obtained by saturating the leaf using a multiphase flash (Loriaux et al., 2006). The first phase consisted of an 8,000-µmol pulse for 300 ms followed by a 100% ramp for 400 ms and a second saturating flash of 8,000 µmol for 300 ms. The maximum quantum efficiency of PSII ( ) was calculated using the equation:
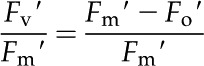 |
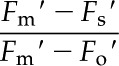
where Fv′ refers to variable fluorescence, Fm′ is maximal fluorescence, Fo′ is minimum fluorescence, and Fs is the steady-state fluorescence. Photochemical quenching was calculated using the equation:
 |
Nonphotochemical quenching was determined using the equation:
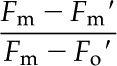 |
Maximum fluorescence in the dark-adapted state (Fm) was determined by temporarily shading leaf tissue with a black cloth for 30 min and applying a far-red pulse for 3 s to fully oxidize PSII reaction centers. After this, a single saturating flash was applied (8,000-µmol pulse for 300 ms) to obtain Fm.
Carbon Assimilation/Intercellular CO2 Curve with Chlorophyll Fluorescence
Gas-exchange and fluorescence measurements were recorded for each replicate with the LI-COR 6400xt using polyvinyl chloride-cultured wheat plants on day 18. Instrument settings were identical to those described above. Six CO2 response curves per genotype were generated for each treatment. Gas-exchange and fluorescence measurements were recorded at 13 CO2 flow rates (400, 300, 200, 100, 50, 100, 150, 200, 300, 400, 500, 600, and 800 µmol s−1). CO2 assimilation was plotted against intercellular CO2 (Ci), and the data points were fitted to the equation of Farquhar et al. (1980) using SAS and the methods described by Dubois et al. (2007).
RNA Isolation and RNA Cleanup
Eighteen days after transplanting, leaf and root tissues were collected and snap frozen in liquid nitrogen for RNA extraction. RNA was extracted using the TRIzol method. RNA concentration was quantified (1:1,000) with the DU 730 Life Science UV/Vis Spectrophotometer (Beckman Coulter). RNA cleanup was performed according to the RNeasy MinElute Cleanup kit protocol (Qiagen). The RNA was eluted with 15 µL of RNase-free water along with on-column DNase1 treatment.
First-Strand cDNA Synthesis and Quantitative Reverse Transcription-PCR
We used SuperScript VILO to synthesize complementary DNA (cDNA) for semiquantitative PCR and real-time qRT-PCR (Invitrogen). First-strand cDNA was generated for two-step reverse transcription PCR by following the protocol from the Superscript VILO cDNA synthesis kit. An amount of 2 µg of RNA was used in the 20-µL reaction mixture. For qRT-PCR, 4 µL of the diluted cDNA (1:20) was used in a 15-µL reaction mixture. In the qRT-PCR volume, 7.5 µL of iQ SYBR Green Supermix was used (Bio-Rad Laboratories). qRT-PCR was run using LightCycler 480 II with the following parameter settings (Roche Applied Science): 95°C preincubation for 10 min; amplification was done for 45 cycles at 95°C for 10 s and 60°C for 10 s; the melting curve was set for 95°C, 65°C, and 97°C; cooling was set at 40°C for 30 s. Each qRT-PCR run was performed with three independent tissue samples, each sample having two technical replicates. Two genes that showed stable expression values in a large set of microarray experiments across treatments and tissue samples were used as internal controls. A description of the genes and primer sequences is provided in Supplemental Table S4. Crossing point value, which was the point at which the fluorescence crosses the threshold, and melting curve analyses were obtained using the Roche LightCycler 480 software version 1.5. The melting curve data were collected for all samples and genes to ensure a single peak, indicating amplification of a specific region by a pair of primers.
Microarray Data Analysis
Wheat Array GeneChip data were generated using a standard Affymetrix protocol. Two independent biological replicates were used for each array experiment. CEL files were analyzed using the limma package in the R software program. Briefly, the Bioconductor affy and limma packages were used for reading CEL files and normalizing microarray data (Smyth, 2005). The raw intensity values for the GeneChip arrays were background corrected, log2 transformed, and quantile normalized with robust multiarray average within the R package affy (Irizarry et al., 2003). The statistical computation and assessment of differential expression were done with the empirical Bayes function, which moderates the se values of estimated log fold changes toward a pooled sd value. P values were adjusted to the Benjamini and Hochberg method (BH) to control the false discovery rate. The top table function was used to list the genes according to the specified P value of 0.05, log2 fold change of 1, and P value adjust = BH. The probe set annotated was generated from HarvEST: WheatChip (Close et al., 2007). The raw array data are publicly available through the National Center for Biotechnology Information Gene Expression Omnibus (GSE42214). Complete lists of differentially expressed transcripts are given in Supplemental Table S3 and Supplemental File S1.
Construction of the Coexpression Network
The coexpression network was constructed with RiceNet using rice (Oryza sativa) orthologous information from HarvEST: Wheat for differentially expressed transcripts between P76 and TL under limited-water conditions (Lee et al., 2011). A BLASTX search against the rice genome (Michigan State University version 6; January 2009) was performed to identify rice orthologs for each differentially expressed transcript. Wheat sequences without a hit or with e-values exceeding 1e−8 were excluded from analysis. Genes corresponding to ribosomal proteins were removed to reduce the occurrence of false relationships between otherwise nonconnected genes. A Bayesian log likelihood score threshold of 2 was used to reduce the number and improve the reliability of predicted connections. Predicted rice loci without a BLASTX hit to wheat Affymetrix transcripts or with e-values greater than 1e−8 were omitted from further analysis. Primers for the genes identified from the network analysis and validated with qRT-PCR are listed in Supplemental Table S6, and their relative expression is summarized in Supplemental Table S4. P76 under limited-water conditions was used as a reference for the validation of expression using qRT-PCR.
SFP Identification and in Silico Mapping of Candidate Genes
Microarray data were preprocessed as described above. To eliminate probe sets with absent transcripts, we adopted the procedure suggested by Schuster et al. (2007), making “present” and “absent” calls for each probe set. A probe set was retained and used for SFP detection if it had present calls in all biological replicates of the two genotypes under comparison. We used the robustified projection pursuit method for SFP detection (Cui et al., 2005) through pairwise comparison among parent genotype P76, TL, and NC for all samples. For each comparison, we used an arbitrary cutoff value of 19 for calling SFP-containing probe sets, within which a probe will be identified as an SFP probe if it accounts for more than 40% of the overall outlying score of its residing probe set. A BLASTX search against the Brachypodium (Brachypodium distachyon) genome (Phytozome Bradi 1; May 2009) was performed for each probe set exceeding the SFP threshold of 19. Also, sequences without a BLASTX hit or with an e-value less significant than 1e−20 were excluded from in silico mapping to the Brachypodium genome. A complete list of probe sets identified through SFP analysis is provided as Supplemental File S2.
Primers were designed so that the region flanking each probe was amplified. Sequences were amplified from cDNA using the primers listed in Supplemental Table S6 using PCR. A 25-µL reaction was prepared using GoTaq Green Master Mix (Promega) consisting of 1 µL each of forward and reverse primers at 10 µm and 2 µL of cDNA. Sequences were amplified using the following program: denaturation at 94°C for 3 min, followed by 30 cycles of amplification (30 s at 94°C, 30 s at 58°C, and 30 s at 72°C), and a final temperature of 72°C for 7 min. Prior to cloning, each reaction was purified using the GeneJET PCR Purification Kit (Thermo Scientific). Amplicons were cloned into pGEM T Easy Vector (Promega), and JM109 competent cells were transformed and cultured according to the manufacturer’s protocol. Cultures were plated on Luria-Bertani plates supplemented with 100 µg of ampicillin and 5-bromo-4-chloro-indolyl-β-D-galactopyranoside-isopropyl-β-D-1-thiogalactopyranoside. Plasmids were retrieved using the GeneJET Plasmid Miniprep Kit (Thermo Scientific) and sequenced.
PCR-Based Mapping of Genes to Wheat Chromosome 7D
A subset of microarray genes that were mapped through SFP analysis to 7DL using rice-wheat synteny maps were confirmed using a series of nullisomic-tetrasomic and ditelosomic wheat ‘Chinese Spring’ lines (Devos et al., 1999; Sorrells et al., 2003). Primers specific to 7DL were designed using probe set sequences obtained from HarvEST: WheatChip version 1.59, Grain Genes (http://wheat.pw.usda.gov/) and the National Center for Biotechnology Information BLAST (Altschul et al., 1997; Close et al., 2007). The selected 7D sequences were used to design primers using Primer3 software (Rozen and Skaletsky, 2000). PCR was performed to map the genes using genomic DNA from cv Chinese Spring, nullisomic-tetrasomic and ditelosomic 7DL, and 7DS wheat ‘Chinese Spring’ plants. PCR was performed using the following settings: 95°C preincubation for 3 min, amplification for 40 cycles at 95°C for 30 s, 58°C for 30 s, and 72°C for 1 min, and extension at 72°C for 3 min. The PCR products were run on a 2% agarose gel (molecular biology grade; Benchmark Scientific) and imaged using the BioDoc-IT Imaging system UV Transillumator (UVP).
Sequence data from this article can be found in the GenBank/EMBL data libraries under accession number GSE42214.
Supplemental Data
The following materials are available in the online version of this article.
Supplemental Figure S1. In silico mapping of wheat genes on the rice genome using SFP.
Supplemental Figure S2. Validation of polymorphic probes identified via SFP/robustified projection pursuit analysis.
Supplemental Table S1. Phenotypic data for early seedling screens using the cigar roll method with tap water.
Supplemental Table S2. Phenotypic data for early seedling screens using the cigar roll method with a one-tenth-strength Hoagland solution.
Supplemental Table S3. Subset of differentially expressed genes from a comparison of P76 with TL during water deficit.
Supplemental Table S4. Relative expression of root-associated network genes during water deficit during the pretillering stage.
Supplemental Table S5. Subset of polymorphic probe sets identified through SFP analysis.
Supplemental Table S6. List of primer sequences used for PCR and qRT-PCR.
Supplemental File S1. Complete list of differentially expressed genes identified by transcriptional profiling of wheat roots.
Supplemental File S2. Complete list of probe sets identified through SFP analysis.
Acknowledgments
We thank Dr. Adam Lukaszewski (University of Calfornia, Riverside) and Drs. Paul Staswick and James Specht (University of Nebraska) for their comments to improve the manuscript.
Glossary
- P76
Pavon76
- TL
1-96-1 translocation line
- NC
negative control
- Fv′/Fm′
maximum quantum efficiency of open PSII reaction centers
- RuBP
ribulose-1,5-bisphosphate
- Vcmax
maximum rate of carboxylation by Rubisco
- Jmax
ribulose-1,5-bisphosphate regeneration rate
- qRT-PCR
quantitative PCR
- BR
brassinosteroid
- SFP
single-feature polymorphism
- Ci
intercellular CO2
- qRT
quantitative reverse transcription
- cDNA
complementary DNA
References
- Albrecht C, Russinova E, Hecht V, Baaijens E, de Vries S. (2005) The Arabidopsis thaliana SOMATIC EMBRYOGENESIS RECEPTOR-LIKE KINASES1 and 2 control male sporogenesis. Plant Cell 17: 3337–3349 [DOI] [PMC free article] [PubMed] [Google Scholar]
- Altschul SF, Madden TL, Schäffer AA, Zhang J, Zhang Z, Miller W, Lipman DJ. (1997) Gapped BLAST and PSI-BLAST: a new generation of protein database search programs. Nucleic Acids Res 25: 3389–3402 [DOI] [PMC free article] [PubMed] [Google Scholar]
- Bao F, Shen J, Brady SR, Muday GK, Asami T, Yang Z. (2004) Brassinosteroids interact with auxin to promote lateral root development in Arabidopsis. Plant Physiol 134: 1624–1631 [DOI] [PMC free article] [PubMed] [Google Scholar]
- Berckmans B, Lammens T, Van Den Daele H, Magyar Z, Bögre L, De Veylder L. (2011) Light-dependent regulation of DEL1 is determined by the antagonistic action of E2Fb and E2Fc. Plant Physiol 157: 1440–1451 [DOI] [PMC free article] [PubMed] [Google Scholar]
- Borlaug NE (2008) Feeding a world of 10 billion people: our 21st century challenge. In Perspectives in World Food and Agriculture 2004. Iowa State Press, Ames, pp 31–56 [Google Scholar]
- Close TJ, Wanamaker S, Roose ML, Lyon M. (2007) HarvEST. Methods Mol Biol 406: 161–177 [DOI] [PubMed] [Google Scholar]
- Clouse SD, Langford M, McMorris TC. (1996) A brassinosteroid-insensitive mutant in Arabidopsis thaliana exhibits multiple defects in growth and development. Plant Physiol 111: 671–678 [DOI] [PMC free article] [PubMed] [Google Scholar]
- Cui X, Xu J, Asghar R, Condamine P, Svensson JT, Wanamaker S, Stein N, Roose M, Close TJ. (2005) Detecting single-feature polymorphisms using oligonucleotide arrays and robustified projection pursuit. Bioinformatics 21: 3852–3858 [DOI] [PubMed] [Google Scholar]
- del Pozo JC, Boniotti MB, Gutierrez C. (2002) Arabidopsis E2Fc functions in cell division and is degraded by the ubiquitin-SCFAtSKP2 pathway in response to light. Plant Cell 14: 3057–3071 [DOI] [PMC free article] [PubMed] [Google Scholar]
- del Pozo JC, Diaz-Trivino S, Cisneros N, Gutierrez C. (2006) The balance between cell division and endoreplication depends on E2FC-DPB, transcription factors regulated by the ubiquitin-SCFSKP2A pathway in Arabidopsis. Plant Cell 18: 2224–2235 [DOI] [PMC free article] [PubMed] [Google Scholar]
- Devos KM, Sorrells ME, Anderson JA, Miller TE, Reader SM, Lukaszewski AJ, Dubcovsky J, Sharp PJ, Faris J, Gale MD. (1999) Chromosome aberrations in wheat nullisomic-tetrasomic and ditelosomic lines. Cereal Res Commun 27: 231–239 [Google Scholar]
- Dubois JJB, Fiscus EL, Booker FL, Flowers MD, Reid CD. (2007) Optimizing the statistical estimation of the parameters of the Farquhar-von Caemmerer-Berry model of photosynthesis. New Phytol 176: 402–414 [DOI] [PubMed] [Google Scholar]
- Dvorák J, Edge M, Ross K. (1988) On the evolution of the adaptation of Lophopyrum elongatum to growth in saline environments. Proc Natl Acad Sci USA 85: 3805–3809 [DOI] [PMC free article] [PubMed] [Google Scholar]
- Ehdaie B, Layne AP, Waines JG. (2012) Root system plasticity to drought influences grain yield in bread wheat. Euphytica 186: 219–232 [Google Scholar]
- Ehdaie B, Whitkus RW, Waines JG. (2003) Root biomass, water-use efficiency, and performance of wheat-rye translocations of chromosomes 1 and 2 in spring bread wheat ‘Pavon.’ Crop Sci 43: 710–717 [Google Scholar]
- Ellis C, Karafyllidis I, Wasternack C, Turner JG. (2002) The Arabidopsis mutant cev1 links cell wall signaling to jasmonate and ethylene responses. Plant Cell 14: 1557–1566 [DOI] [PMC free article] [PubMed] [Google Scholar]
- Farquhar GD, von Caemmerer S, Berry JA. (1980) A biochemical model of photosynthetic CO2 assimilation in leaves of C3 species. Planta 149: 78–90 [DOI] [PubMed] [Google Scholar]
- Flexas J, Medrano H. (2002) Drought-inhibition of photosynthesis in C3 plants: stomatal and non-stomatal limitations revisited. Ann Bot (Lond) 89: 183–189 [DOI] [PMC free article] [PubMed] [Google Scholar]
- Fox J. (2005) The R Commander: a basic-statistics graphical user interface to R. J Stat Softw 14: i09 [Google Scholar]
- Foyer CH, Bloom AJ, Queval G, Noctor G. (2009) Photorespiratory metabolism: genes, mutants, energetics, and redox signaling. Annu Rev Plant Biol 60: 455–484 [DOI] [PubMed] [Google Scholar]
- Friebe B, Jiang J, Raupp WJ, McIntosh RA, Gill BS. (1996) Characterization of wheat-alien translocations conferring resistance to diseases and pests: current status. Euphytica 91: 59–87 [Google Scholar]
- Fukaki H, Tasaka M. (2009) Hormone interactions during lateral root formation. Plant Mol Biol 69: 437–449 [DOI] [PubMed] [Google Scholar]
- Gamuyao R, Chin JH, Pariasca-Tanaka J, Pesaresi P, Catausan S, Dalid C, Slamet-Loedin I, Tecson-Mendoza EM, Wissuwa M, Heuer S. (2012) The protein kinase Pstol1 from traditional rice confers tolerance of phosphorus deficiency. Nature 488: 535–539 [DOI] [PubMed] [Google Scholar]
- Gowda VRP, Henry A, Yamauchi A, Shashidhar HE, Serraj R. (2011) Root biology and genetic improvement for drought avoidance in rice. Field Crops Res 122: 1–13 [Google Scholar]
- Graybosch RA. (2001) Uneasy unions: quality effects of rye chromatin transfers to wheat. J Cereal Sci 33: 3–16 [Google Scholar]
- Hecht V, Vielle-Calzada JP, Hartog MV, Schmidt ED, Boutilier K, Grossniklaus U, de Vries SC. (2001) The Arabidopsis SOMATIC EMBRYOGENESIS RECEPTOR KINASE 1 gene is expressed in developing ovules and embryos and enhances embryogenic competence in culture. Plant Physiol 127: 803–816 [PMC free article] [PubMed] [Google Scholar]
- Hedden P. (2003) The genes of the Green Revolution. Trends Genet 19: 5–9 [DOI] [PubMed] [Google Scholar]
- Huang X, Zhang Y, Jiao B, Chen G, Huang S, Guo F, Shen Y, Huang Z, Zhao B. (2012) Overexpression of the wheat salt tolerance-related gene TaSC enhances salt tolerance in Arabidopsis. J Exp Bot 63: 5463–5473 [DOI] [PubMed] [Google Scholar]
- Irizarry RA, Hobbs B, Collin F, Beazer-Barclay YD, Antonellis KJ, Scherf U, Speed TP. (2003) Exploration, normalization, and summaries of high density oligonucleotide array probe level data. Biostatistics 4: 249–264 [DOI] [PubMed] [Google Scholar]
- Kim SH, Bhat PR, Cui X, Walia H, Xu J, Wanamaker S, Ismail AM, Wilson C, Close TJ. (2009) Detection and validation of single feature polymorphisms using RNA expression data from a rice genome array. BMC Plant Biol 9: 65. [DOI] [PMC free article] [PubMed] [Google Scholar]
- Kwaaitaal MA, de Vries SC. (2007) The SERK1 gene is expressed in procambium and immature vascular cells. J Exp Bot 58: 2887–2896 [DOI] [PubMed] [Google Scholar]
- Kwaaitaal MA, de Vries SC, Russinova E. (2005) Arabidopsis thaliana Somatic Embryogenesis Receptor Kinase 1 protein is present in sporophytic and gametophytic cells and undergoes endocytosis. Protoplasma 226: 55–65 [DOI] [PubMed] [Google Scholar]
- Kwon Y, Kim SH, Jung MS, Kim MS, Oh JE, Ju HW, Kim KI, Vierling E, Lee H, Hong SW. (2007) Arabidopsis hot2 encodes an endochitinase-like protein that is essential for tolerance to heat, salt and drought stresses. Plant J 49: 184–193 [DOI] [PubMed] [Google Scholar]
- Lee I, Seo YS, Coltrane D, Hwang S, Oh T, Marcotte EM, Ronald PC. (2011) Genetic dissection of the biotic stress response using a genome-scale gene network for rice. Proc Natl Acad Sci USA 108: 18548–18553 [DOI] [PMC free article] [PubMed] [Google Scholar]
- Loriaux SD, Burns RA, Welles JM, McDermitt DK, Genty B (2006) Determination of maximal chlorophyll fluorescence using a multiphase single flash of sub-saturating intensity. Poster Presentation, August 2006. American Society of Plant Biologists Annual Meetings, Boston, MA [Google Scholar]
- Ma J, Zhou R, Dong Y, Jia J. (2000) Control and inheritance of resistance to yellow rust in Triticum aestivum-Lophopyrum elongatum chromosome substitution lines. Euphytica 111: 57–60 [Google Scholar]
- Magyar Z, Horváth B, Khan S, Mohammed B, Henriques R, De Veylder L, Bakó L, Scheres B, Bögre L. (2012) Arabidopsis E2FA stimulates proliferation and endocycle separately through RBR-bound and RBR-free complexes. EMBO J 31: 1480–1493 [DOI] [PMC free article] [PubMed] [Google Scholar]
- McDonald MP, Galwey NW, Ellneskog-Staam P, Colmer TD. (2001) Evaluation of Lophopyrum elongatum as a source of genetic diversity to increase the waterlogging tolerance of hexaploid wheat (Triticum aestivum). New Phytol 151: 369–380 [Google Scholar]
- Monneveux P, Reynolds MP, Gonzalez-Aguilar J, Singh RP, Weber WE. (2003) Effects of the 7DL.7Ag translocation from Lophopyrum elongatum on wheat yield and related morphophysiological traits under different environments. Plant Breed 122: 379–384 [Google Scholar]
- Müssig C, Shin GH, Altmann T. (2003) Brassinosteroids promote root growth in Arabidopsis. Plant Physiol 133: 1261–1271 [DOI] [PMC free article] [PubMed] [Google Scholar]
- Nolan KE, Kurdyukov S, Rose RJ. (2009) Expression of the SOMATIC EMBRYOGENESIS RECEPTOR-LIKE KINASE1 (SERK1) gene is associated with developmental change in the life cycle of the model legume Medicago truncatula. J Exp Bot 60: 1759–1771 [DOI] [PMC free article] [PubMed] [Google Scholar]
- Papageorgiou GC, Govindjee, editors (2004) Chlorophyll a Fluorescence: A Signature of Photosynthesis. Springer, Dordrecht, The Netherlands [Google Scholar]
- Rabinovich SV. (1998) Importance of wheat-rye translocations for breeding modern cultivar of Triticum aestivum L. Euphytica 100: 323–340 [Google Scholar]
- Ramirez-Parra E, López-Matas MA, Fründt C, Gutierrez C. (2004) Role of an atypical E2F transcription factor in the control of Arabidopsis cell growth and differentiation. Plant Cell 16: 2350–2363 [DOI] [PMC free article] [PubMed] [Google Scholar]
- Reynolds M, Dreccer F, Trethowan R. (2007) Drought-adaptive traits derived from wheat wild relatives and landraces. J Exp Bot 58: 177–186 [DOI] [PubMed] [Google Scholar]
- Reynolds MP, Calderini DF, Condon AG, Rajaram S. (2001) Physiological basis of yield gains in wheat associated with the translocation from Agropyron elongatum. Euphytica 119: 139–144 [Google Scholar]
- Ribaut JM, Betran J, Monneveux P, Setter T (2009) Handbook of Maize: Its Biology. Springer, New York [Google Scholar]
- Richards R, Passioura J. (1989) A breeding program to reduce the diameter of the major xylem vessel in the seminal roots of wheat and its effect on grain yield in rain-fed environments. Aust J Agric Res 40: 943–950 [Google Scholar]
- Rozen S, Skaletsky H. (2000) Primer3 on the WWW for general users and for biologist programmers. Methods Mol Biol 132: 365–386 [DOI] [PubMed] [Google Scholar]
- Schmidt ED, Guzzo F, Toonen MA, de Vries SC. (1997) A leucine-rich repeat containing receptor-like kinase marks somatic plant cells competent to form embryos. Development 124: 2049–2062 [DOI] [PubMed] [Google Scholar]
- Schuster EF, Blanc E, Partridge L, Thornton JM. (2007) Correcting for sequence biases in present/absent calls. Genome Biol 8: R125. [DOI] [PMC free article] [PubMed] [Google Scholar]
- Sears ER (1956) The transfer of leaf-rust resistance from Aegilops umbellulata to wheat. In Genetics in Plant Breeding: Brook-Haven Symposia in Biology No. 9, Brookhaven National Laboratory, Upton, New York. pp 1–22 [Google Scholar]
- Sears ER (1978) Analysis of wheat-Agropyron recombinant chromosomes: interspecific hybridization in plant breeding. In Proceedings of the Eighth Congress of Eucarpia, Madrid, Spain, pp 63–72 [Google Scholar]
- Sharma H, Ohm H, Goulart L, Lister R, Appels R, Benlhabib O. (1995) Introgression and characterization of barley yellow dwarf virus resistance from Thinopyrum intermedium into wheat. Genome 38: 406–413 [DOI] [PubMed] [Google Scholar]
- Sharma S, Demason DA, Ehdaie B, Lukaszewski AJ, Waines JG. (2010) Dosage effect of the short arm of chromosome 1 of rye on root morphology and anatomy in bread wheat. J Exp Bot 61: 2623–2633 [DOI] [PMC free article] [PubMed] [Google Scholar]
- Singh RP, Huerta-Espino J, Rajaram S, Crossa J. (1998) Agronomic effects from chromosome translocations 7DL.7Ag and 1BL.1RS in spring wheat. Crop Sci 38: 27–33 [Google Scholar]
- Smyth GK (2005) Limma: linear models for microarray data. In R Gentleman, V Carey, S Dudoit, R Irizarry, W Huber, eds, Bioinformatics and Computational Biology Solutions Using R and Bioconductor. Springer, New York, pp 397–420 [Google Scholar]
- Somleva MN, Schmidt EDL, de Vries SC. (2000) Embryogenic cells in Dactylis glomerata L. (Poaceae) explants identified by cell tracking and by SERK expression. Plant Cell Rep 19: 718–726 [DOI] [PubMed] [Google Scholar]
- Sorrells ME, La Rota M, Bermudez-Kandianis CE, Greene RA, Kantety R, Munkvold JD, Miftahudin, Mahmoud A, Ma X, Gustafson PJ, et al. (2003) Comparative DNA sequence analysis of wheat and rice genomes. Genome Res 13: 1818–1827 [DOI] [PMC free article] [PubMed] [Google Scholar]
- ten Hove CA, de Jong M, Lapin D, Andel A, Sanchez-Perez GF, Tarutani Y, Suzuki Y, Heidstra R, van den Ackerveken G. (2011) Trans-repression of gene activity upstream of T-DNA tagged RLK902 links Arabidopsis root growth inhibition and downy mildew resistance. PLoS ONE 6: e19028. [DOI] [PMC free article] [PubMed] [Google Scholar]
- Truernit E, Haseloff J. (2007) A role for KNAT class II genes in root development. Plant Signal Behav 2: 10–12 [DOI] [PMC free article] [PubMed] [Google Scholar]
- Truernit E, Siemering KR, Hodge S, Grbic V, Haseloff J. (2006) A map of KNAT gene expression in the Arabidopsis root. Plant Mol Biol 60: 1–20 [DOI] [PubMed] [Google Scholar]
- Waines JG, Ehdaie B. (2007) Domestication and crop physiology: roots of Green-Revolution wheat. Ann Bot (Lond) 100: 991–998 [DOI] [PMC free article] [PubMed] [Google Scholar]
- Walia H, Wilson C, Condamine P, Ismail AM, Xu J, Cui X, Close TJ. (2007) Array-based genotyping and expression analysis of barley cv. Maythorpe and Golden Promise. BMC Genomics 8: 87. [DOI] [PMC free article] [PubMed] [Google Scholar]
- Walker JC. (1994) Structure and function of the receptor-like protein kinases of higher plants. Plant Mol Biol 26: 1599–1609 [DOI] [PubMed] [Google Scholar]
- Wang RR, Zhang XY. (1996) Characterization of the translocated chromosome using fluorescence in situ hybridization and random amplified polymorphic DNA on two Triticum aestivum-Thinopyrum intermedium translocation lines resistant to wheat streak mosaic or barley yellow dwarf virus. Chromosome Res 4: 583–587 [DOI] [PubMed] [Google Scholar]
- Wolf S, Mravec J, Greiner S, Mouille G, Höfte H. (2012) Plant cell wall homeostasis is mediated by brassinosteroid feedback signaling. Curr Biol 22: 1732–1737 [DOI] [PubMed] [Google Scholar]
- Xie L, Yang C, Wang X. (2011) Brassinosteroids can regulate cellulose biosynthesis by controlling the expression of CESA genes in Arabidopsis. J Exp Bot 62: 4495–4506 [DOI] [PMC free article] [PubMed] [Google Scholar]
- Yediay F, Baloch F, Kilian B, Ozkan H. (2010) Testing of rye-specific markers located on 1RS chromosome and distribution of 1AL.RS and 1BL.RS translocations in Turkish wheat (Triticum aestivum L. durum Desf.) varieties and landraces. Genet Resour Crop Evol 57: 119–129 [Google Scholar]
- Yoshimitsu Y, Tanaka K, Fukuda W, Asami T, Yoshida S, Hayashi K, Kamiya Y, Jikumaru Y, Shigeta T, Nakamura Y, et al. (2011) Transcription of DWARF4 plays a crucial role in auxin-regulated root elongation in addition to brassinosteroid homeostasis in Arabidopsis thaliana. PLoS ONE 6: e23851. [DOI] [PMC free article] [PubMed] [Google Scholar]
- Zeller FJ (1973) 1B/1R wheat-rye chromosome substitutions and translocations. In ER Sears, LM Sears, eds, Proceedings of the 4th International Wheat Genetics Symposium. University of Missouri, Columbia, MO, pp 209–221 [Google Scholar]
- Zhang W, Lukaszewski AJ, Kolmer J, Soria MA, Goyal S, Dubcovsky J. (2005) Molecular characterization of durum and common wheat recombinant lines carrying leaf rust resistance (Lr19) and yellow pigment (Y) genes from Lophopyrum ponticum. Theor Appl Genet 111: 573–582 [DOI] [PubMed] [Google Scholar]
- Zhu J, Mickelson SM, Kaeppler SM, Lynch JP. (2006) Detection of quantitative trait loci for seminal root traits in maize (Zea mays L.) seedlings grown under differential phosphorus levels. Theor Appl Genet 113: 1–10 [DOI] [PubMed] [Google Scholar]
- Zu-Jun Y, Zheng-Long R. (2001) Chromosomal distribution and genetic expression of Lophopyrum elongatum (Host) A. Löve genes for adult plant resistance to stripe rust in wheat background. Genet Resour Crop Evol 48: 183–187 [Google Scholar]