Time-lapse x-ray tomography uncovers the importance of intervessel connections in the xylem network in drought-induced embolism.
Abstract
Long-distance water transport through plant xylem is vulnerable to hydraulic dysfunction during periods of increased tension on the xylem sap, often coinciding with drought. While the effects of local and systemic embolism on plant water transport and physiology are well documented, the spatial patterns of embolism formation and spread are not well understood. Using a recently developed nondestructive diagnostic imaging tool, high-resolution x-ray computed tomography, we documented the dynamics of drought-induced embolism in grapevine (Vitis vinifera) plants in vivo, producing the first three-dimensional, high-resolution, time-lapse observations of embolism spread. Embolisms formed first in the vessels surrounding the pith at stem water potentials of approximately –1.2 megapascals in drought experiments. As stem water potential decreased, embolisms spread radially toward the epidermis within sectored vessel groupings via intervessel connections and conductive xylem relays, and infrequently (16 of 629 total connections) through lateral connections into adjacent vessel sectors. Theoretical loss of conductivity calculated from the high-resolution x-ray computed tomography images showed good agreement with previously published nuclear magnetic resonance imaging and hydraulic conductivity experiments also using grapevine. Overall, these data support a growing body of evidence that xylem organization is critically important to the isolation of drought-induced embolism spread and confirm that air seeding through the pit membranes is the principle mechanism of embolism spread.
Water is transported through the xylem under tension and in a metastable state, making it inherently vulnerable to cavitation, the rapid phase change of liquid water to vapor (Dixon and Joly, 1895; Hayward, 1971; Tyree and Sperry, 1989). The resulting gas embolisms block water transport in the affected xylem vessel. It is widely accepted that embolisms spread between adjacent conduits when the pressure differential between gas-filled and water-filled conduits reaches a critical point where water vapor is aspirated through the pit membrane from the neighboring conduit (Tyree and Sperry, 1989; Tyree and Zimmermann, 2002). The resulting spread of embolisms through the xylem effectively reduces the hydraulic conductivity of the network, impairing the capacity to replace transpired water. The consequences of embolism formation can be dramatic, and it is now considered to be one of the major physiological factors driving reductions in forest primary productivity and drought-induced mortality in woody plants (Anderegg et al., 2012; Choat et al., 2012).
Embolism spread between conduits is necessarily dependent on the number and orientation of the interconduit connections, but little is known about the organization of those connections or the spatial dynamics of embolism spread in vivo (Tyree and Zimmermann, 2002; Brodersen et al., 2010). This knowledge gap is largely due to the lack of a nondestructive visualization tool with sufficient resolution to study the propagation and spread of embolism. Previous efforts to visualize embolism in vivo utilized either cryo-scanning electron microscopy (cryo-SEM) or NMR imaging. Cryo-SEM yields fine resolution of frozen plant tissue, revealing the functional status of xylem conduits (i.e. water- or air-filled) at the time of freezing (Canny, 1997; Melcher et al., 2003; Cobb et al., 2007; Mayr et al., 2007; Johnson et al., 2012). Both transverse (Hukin et al., 2005; Sun et al., 2007; Johnson et al., 2012) and longitudinal (Utsumi et al., 1999) cryo-SEM sections have been prepared, but only provide a snapshot of a single point in time and in a single, two-dimensional plane. Similarly, NMR imaging was used in several studies as a nondestructive visualization tool to study the functional status of the xylem in vivo (Holbrook et al., 2001; Clearwater and Clark, 2003). However, the resulting images are typically of insufficient resolution to determine anything other than whether xylem conduits were filled with water or air. Three-dimensional (3D) imaging with NMR is challenging and is not frequently employed (Kuroda et al., 2006). Despite the availability of NMR, studies using this technology are largely focused to the spread of embolism over long periods of time (e.g. weeks [Umebayashi et al., 2011] or months [Pérez-Donoso et al., 2007]) rather than the short-term dynamics of embolism spread over the course of a few hours.
Recently, high-resolution x-ray computed tomography (HRCT), a nondestructive diagnostic imaging tool, has been successfully used to study plant tissue in vivo (Brodersen et al., 2010, 2011). Synchrotron-based HRCT is based on the same principles as medical computed tomography systems but yields data with a spatial resolution of less than 5 µm and a temporal resolution of less than 30 min. Brodersen et al. (2011) expanded on this technology to study and map the 3D organization of grapevine (Vitis vinifera) stems and found that the functional status of the xylem could be determined in vivo. Brodersen et al. (2010) visualized the dynamics of embolism repair (i.e. the metabolically active refilling of embolized xylem conduits) in live plants using HRCT, including the growth of water droplets emerging from xylem parenchyma surrounding embolized vessels that eventually led to the dissolution of trapped gas inside the vessels. While we now have a better understanding of embolism repair and the physiological consequences of embolism spread are well documented (Tyree and Zimmermann, 2002; McDowell et al., 2008; Cochard et al., 2009; Zwieniecki and Holbrook, 2009; Choat et al., 2012), the spatial dynamics and biophysics of embolism formation and spread in vivo have yet to be fully explored. Clearly, the spatial organization of xylem conduits plays a critical role in embolism repair and is likely even more influential in embolism spread, as direct connections between conduits are the most likely pathway through the network. Building on these findings and new techniques, we aimed to take advantage of HRCT imaging to provide the first high-resolution visualization of the spread of drought-induced embolism.
RESULTS
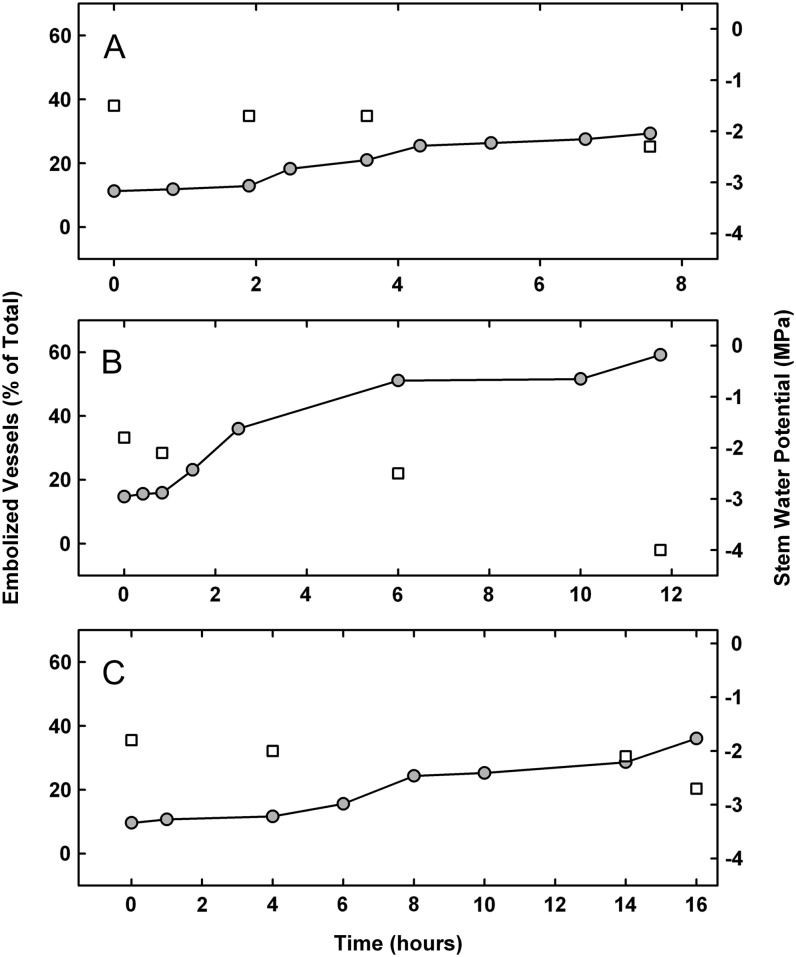
Plants entered the experiment with a stem water potential (ψstem) of –1.4, –1.7, and –1.8 MPa (Fig. 1), with a range of 11% to 18% embolized vessels at that time. Over the time course of each experiment, plants were allowed to desiccate to a ψstem of –2.3, –2.7, and –4.1 MPa, respectively. All plants showed increasing embolism formation corresponding to decreasing ψstem values. Although all plants were under the same environmental conditions, plant B decreased to –4.1 MPa and lost 61% of its vessels to cavitation, while plants A and C lost only 29% and 36%, respectively, but only reached a ψstem of –2.3 and –2.7 MPa, respectively (Fig. 1). Plant B’s large decrease in ψstem occurred over 12 h, while plant C maintained higher ψstem for 16 h.
Figure 1.
Change in the percentage of embolized vessels (circles) and change in ψstem (squares) in three separate plants during simulated drought experiments.
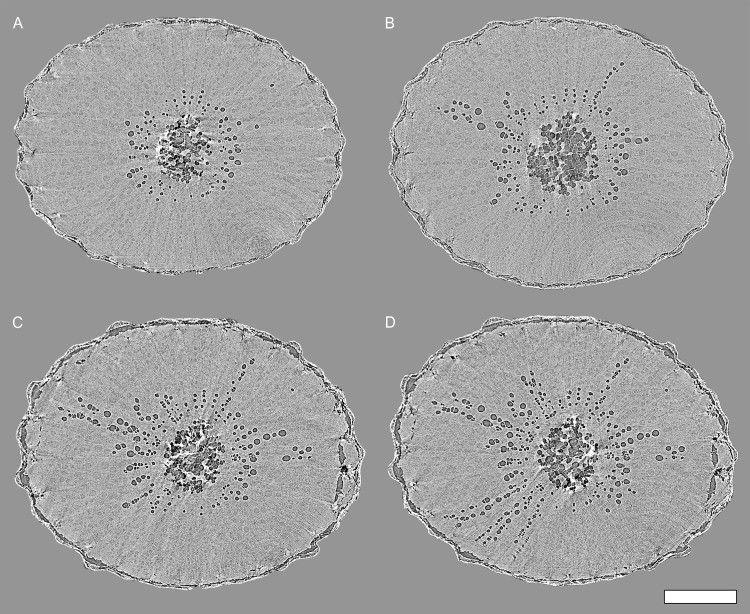
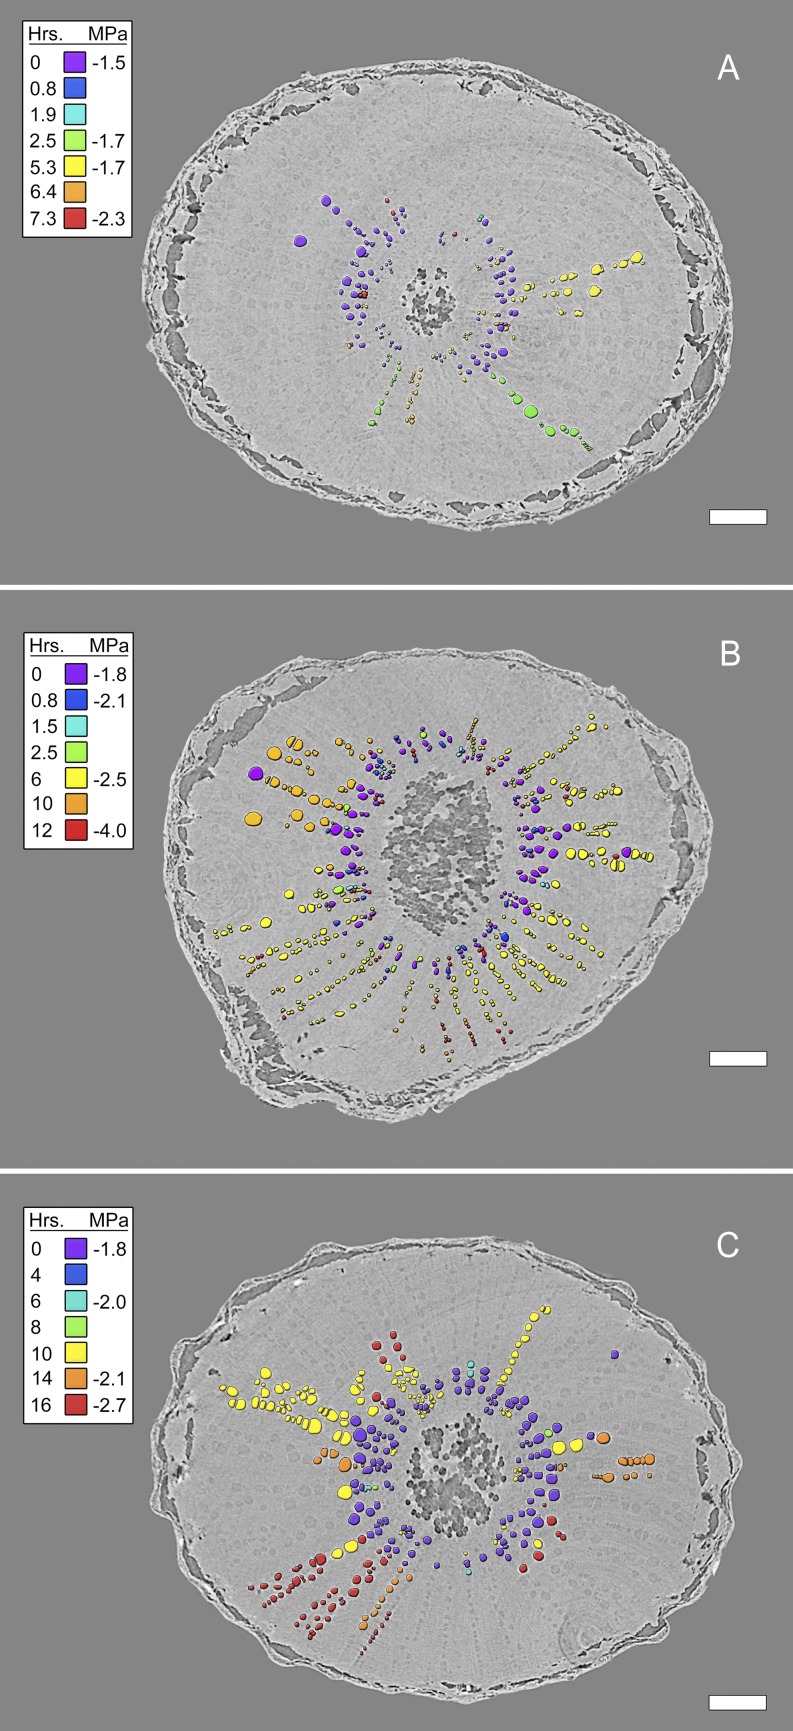
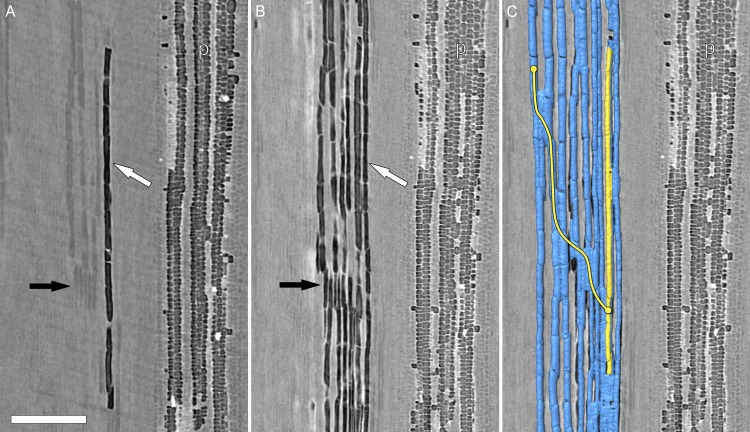
Transverse HRCT images showed that embolisms formed first in vessels immediately surrounding the pith (Figs. 2A and 3). As ψstem decreased over time, embolisms spread radially outward toward the epidermis (Figs. 2, B–D, and 3, A–C). The progression of embolism spread was overwhelmingly radial (97.5% of the 629 total connections between embolized vessels were in the radial direction), consistent with the orientation of most intervessel connections in grapevine (Brodersen et al., 2011). Most embolisms spread through vessel-vessel connections within a sector (i.e. vessel groups delineated by two rays). In one plant, we observed an isolated embolism (i.e. a gas bubble) within a vessel spread through radial intervessel connections to ultimately embolize the entire sector (Fig. 4). The gas-filled vessel was clearly distinguishable from the surrounding water-filled tissue at the beginning of the experiment (Fig. 4A). Multiple longitudinal image slices on either side of the image displayed in Figure 4A confirmed that the air bubble was isolated to a single vessel. Over 8.5 h, ψstem decreased from –1.5 to –2.4 MPa, and the gas spread through direct vessel-vessel connections, as seen in the longitudinal HRCT sections (Fig. 4, A and B). Viewing these HRCT data with multiple longitudinal and transverse sections and reconstructing 3D volume renderings of the vessel lumen (Fig. 3C), it was possible to trace the exact pathway that the embolisms spread through the xylem. In this case, the embolisms spread through a conductive xylem relay similar to those documented in grapevine by Brodersen et al. (2013).
Figure 2.
Transverse HRCT micrographs through a grapevine stem (plant B in Fig. 1) showing the representative pattern of embolism spread in grapevine. A, Initial scans revealed air-filled vessels surrounding the pith and also clearly showed water-filled vessels. C to D, Embolisms then spread radially through adjacent vessels toward the epidermis as ψstem decreased over time. ψstem = –1.7 (A), –1.9 (B), –2.1 (C), and –4.0 MPa (D). Bar = 1 mm.
Figure 3.
Transverse HRCT micrographs through three grapevine stems showing the radial, sectored spread of embolisms during the simulated drought experiments as ψstem declined (MPa, legend inset). Vessel lumen color denotes the time point (hours [Hrs.], legend inset) at which gas was first observed inside the vessel. Bars = 1 mm.
Figure 4.
Longitudinal HRCT micrographs (plant A in Fig. 1) early (0 h; A) and late (8.5 h; B and C) during a drought experiment. Prior to extensive embolism spread, a solitary embolized vessel is visible (A, white arrow) near the pith. Surrounding water-filled vessels (A, black arrow) were visible. Embolisms then spread via intervessel connections to other vessels in the same sector (i.e. vessel relays between rays). C, The 3D HRCT volume renderings show the isolated embolized vessel (yellow) and the vessels that subsequently embolized (blue). A clear radial pathway (yellow line) exists between the embolism origin and the other vessels within the sector. p, Pith. Bar = 500 µm.
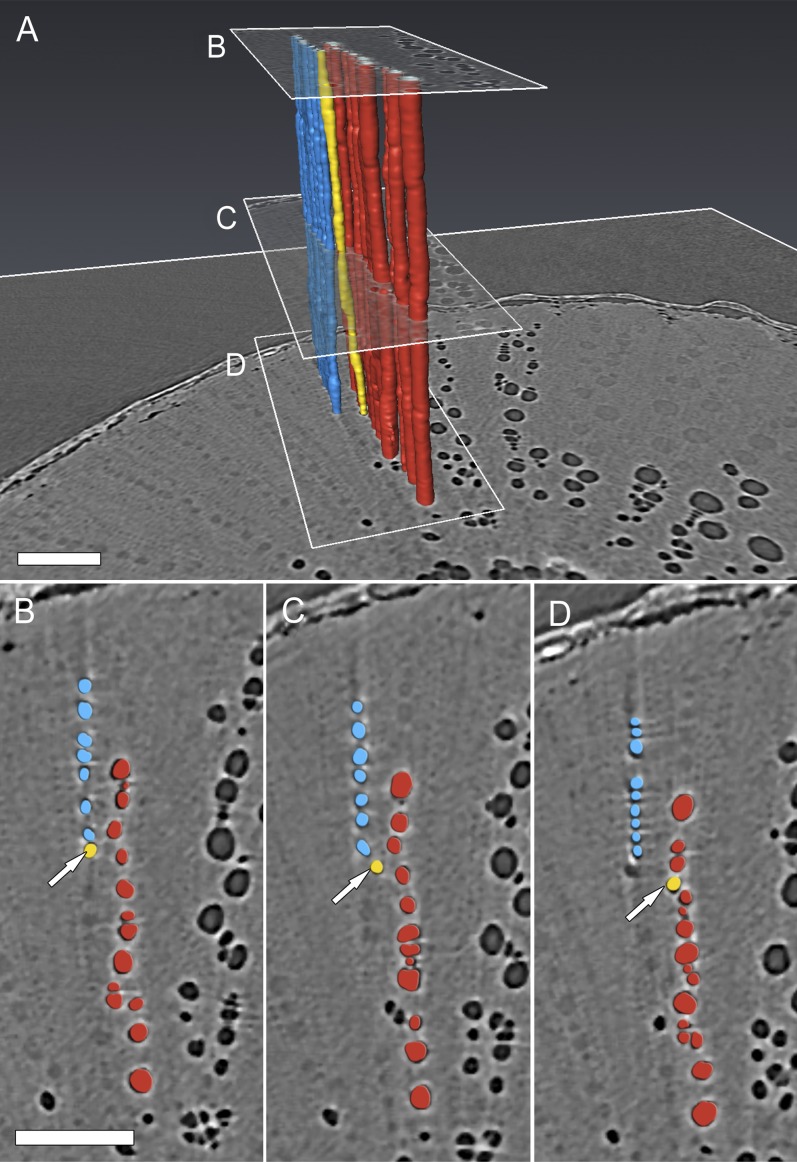
Occasionally, we observed tangential embolism spread, where embolisms moved between vessel sectors (Fig. 5). In tangential embolism spread, vessels within one sector were embolized at a prior time point, which was the result of radial spread through intervessel connections in shared vessel walls. At the next time point, the gas spread to a functional (i.e. water-filled) vessel group through a vessel that drifted between sectors, presumably through perforated ray cells (Fig. 5, B–D).
Figure 5.
A, Transverse HRCT micrographs and volume renderings of grapevine vessels showing a pathway for embolism spread between sectors (magnified view of Fig. 2D). B to D, Transverse views through the vessel group. Vessels in the red sector embolized first and then spread through a vessel (yellow) that drifted tangentially from the red sector to the blue sector. Bars = 250 µm.
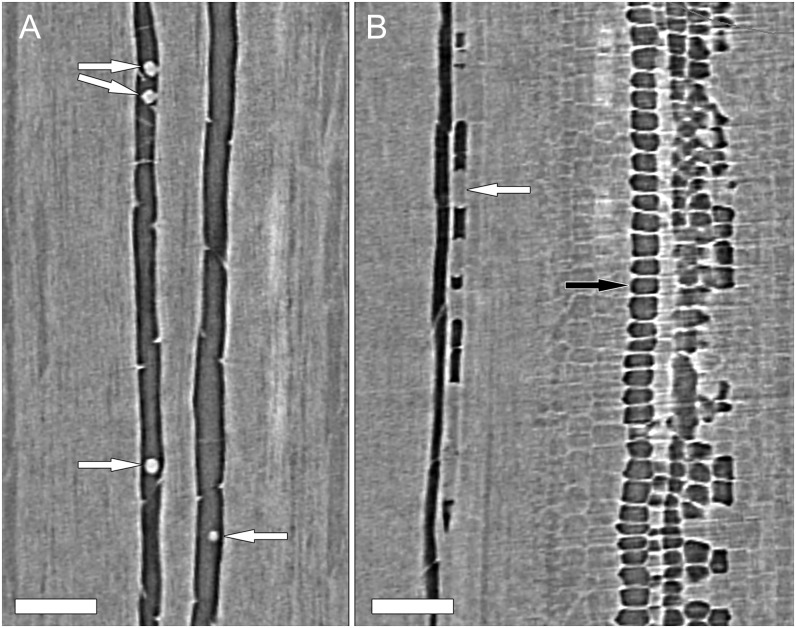
Evidence for embolism repair was observed in plant A at the beginning of the experiment, which started with the highest ψstem value (i.e. under the least water stress). We observed both droplets and broken water columns within vessels (Fig. 6, A and B), phenomena indicative of embolism repair for this species (Brodersen et al., 2010). The observed droplets, however, were few in number and did not persist in subsequent scans as ψstem decreased.
Figure 6.
Longitudinal HRCT micrographs from two separate locations within a single plant (plant A in Fig. 1) showing water droplets (A, arrows) and isolated columns of water (B, white arrow) adhering to vessel walls at the beginning of the experiment. Air- and water-filled pith cells are clearly visible in B (black arrow); however, there were no direct connections between pith cells and the neighboring vessels. After this time point (0 h), droplets were not visible in any vessel in any plant, and water columns were rare. Bars = 250 µm.
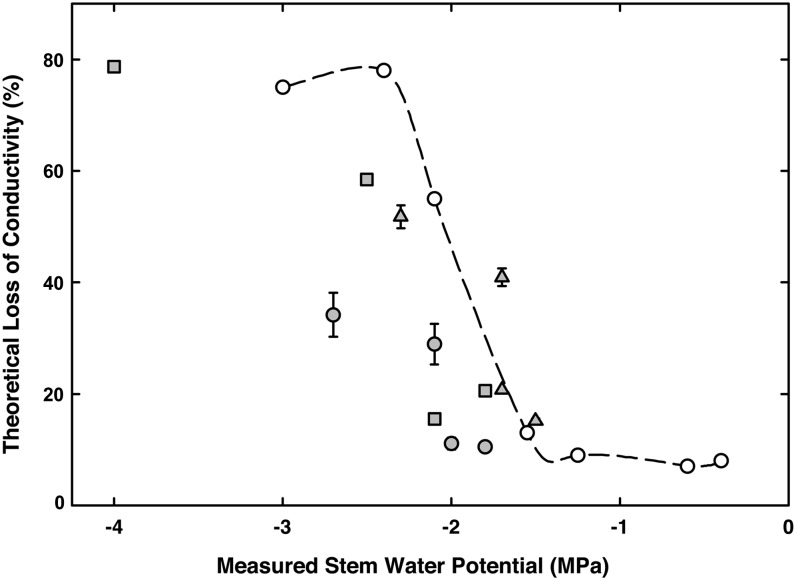
Calculations of percent loss of conductivity (PLC) based on the number and diameter of embolized vessels at measured ψstem showed increasing PLC with decreasing ψstem during the experiments (Fig. 7). The potential error in PLC calculations resulting from adding or subtracting 1 voxel width for each measured vessel diameter was minor (Fig. 7). These data showed good agreement with both previously published theoretical and measured PLC values from another noninvasive study of embolism spread using NMR imaging (Holbrook et al., 2001; Choat et al., 2010). Both data sets show the greatest losses in conductivity between –1.5 and –2.5 MPa, and we estimated 50% loss of hydraulic conductivity at –2.2 MPa ψstem, based on a Weibull function fit to these data (Neufeld et al., 1992).
Figure 7.
Theoretical loss of hydraulic conductivity of three grapevine plants (gray symbols) calculated from the diameters of embolized vessels during drought experiments. Superimposed are data (white symbols, dashed line) from Choat et al. (2010), where loss of conductivity was measured and paired with NMR imaging. Bars indicate predicted error generated by adding or subtracting 4.5 µm from the vessel diameter measurements.
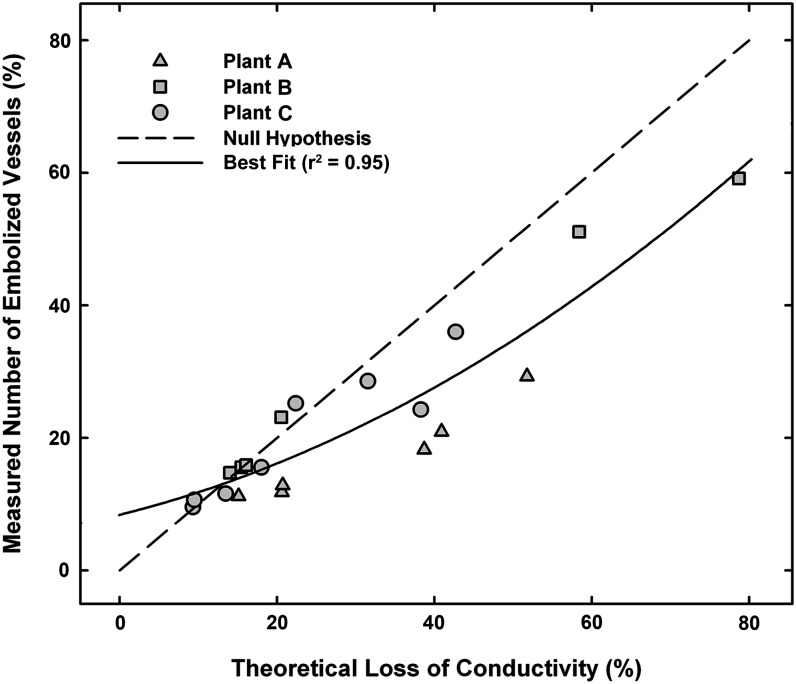
We then compared the percentage loss of conducting vessels from embolism to the theoretical PLC and found the slope to be less than 1:1 (Fig. 8). A null hypothesis would predict that all vessels are of equal diameter, or an equal range and frequency distribution of vessel diameters, and that vessels embolize at the same rate regardless of diameter. As drought stress progressed in these plants, the embolisms spread outward from the center of the stem starting near the pith. In all three plants, vessel diameter increased, reaching a maximum near the midpoint between the stem center and the epidermis (Supplemental Fig. S1), and over time, the number of larger diameter vessels that embolized increased (Supplemental Fig. S2).
Figure 8.
Theoretical loss of hydraulic conductivity versus the measured loss of vessels to embolism for three plants during drought experiments. The 1:1 line represents the predicted loss of vessels and the associated hydraulic conductivity if (1) all vessels are of equal diameter or an equal range and frequency distribution of vessel diameters or (2) the vessels embolized at the same rate regardless of diameter.
Using HRCT imaging, we were unable to determine whether the gas inside glass capillary tubes was air or water vapor (Supplemental Fig. S3). The mass attenuation coefficients for air, water, and water vapor were 0.17 ± 0.05 sd, 1.51 ± 0.06 sd, and 0.21 ± 0.05 sd absorption cm–1, respectively. The mean value for water was significantly different from air and water vapor (P < 0.05); however, mean values for water vapor and air were not significantly different. Our mass attenuation coefficient for water was similar to data previously reported by Henke et al. (1993).
DISCUSSION
The data presented in this manuscript provide strong evidence that the connections between vessels do facilitate embolism spread and that xylem organization plays an important role in embolism isolation (air-seeding hypothesis). Intervessel connections bound by pit membranes have long been thought of as the most likely pathway for embolism spread through xylem networks (Sperry and Tyree, 1988; Tyree and Zimmermann, 2002; Wheeler et al., 2005; Choat et al., 2008). The observations presented here provide the first visualization of this process occurring in real time in an intact plant. These data provide further support that air seeding through pit membranes is the most likely mechanism of embolism spread through the xylem, as opposed to homogenous nucleation or nucleation from hydrophobic wall surfaces. As the study of xylem connectivity continues, the ability to quantify and categorically define exactly where vessel connections exist will improve to the point where embolism spread can be studied using predictive models (Loepfe et al., 2007; Brodersen et al., 2011).
Holbrook et al. (2001) used NMR imaging to provide the first in vivo images of embolism formation and repair in grapevine. They observed patchy embolism formation or isolated vessels embolizing at random in the single grapevine plant used in the study. All three plants in this study showed at least one isolated embolized vessel surrounded by water-filled vessels and far from the pith early on in the experiments (0 h; Fig. 3, A–C). These isolated embolized vessels are similar to those observed by Holbrook et al. (2001) and occurred in plants at comparable ψstem. However, it remains unclear whether these vessels spontaneously embolized through homogenous bubble nucleation prior to visualization or whether those vessels simply failed to refill as observed by Brodersen et al. (2010). The radial patterns of embolism spread presented here closely match those observed by Choat et al. (2010) in grapevine visualized with NMR imaging, where plants under mild water stress showed embolisms in vessels surrounding the pith and embolism formation in discrete sectors following increased water stress. Clearly, the spatial resolution of HRCT has a significant advantage over current NMR imaging to resolve the functional status of xylem networks (particularly small diameter vessels), but the two methods appear to yield similar results.
Why embolisms first formed in vessels surrounding the pith is unclear, but may be the result of the accumulation of repeated stress to the pit membranes in the oldest vascular tissue (i.e. vessels immediately surrounding the pith), and our experiments support the idea of cavitation fatigue, where vessels that embolize once are more susceptible to future embolism than younger xylem conduits (Hacke et al., 2001; Stiller and Sperry, 2002). In addition, the xylem conduits closest to the pith are generally primary xylem with only partial wall thickenings (Evert, 2006), making them less structurally sound than secondary xylem. Choat et al. (2005) showed that air-seeding thresholds are lower in primary xylem conduits compared with secondary xylem and suggested that the differences resulted from thinner and weaker primary cell walls between helical thickenings. As a consequence, pit membranes in the primary xylem have a higher probability of rupturing because of both age (repeated stress) and structural integrity (Tyree and Sperry, 1989).
Based on previous research (Choat et al., 2010; McElrone et al., 2012) and our observations of embolism at ψstem of –1.4 MPa and below, embolism formation in grapevine likely starts between ψstem of –0.8 and –1.2 MPa (Fig. 1; Brodersen et al., 2010; McElrone et al., 2012). With limited access to the HRCT instrument, it was critical to have plants at ψstem values known to induce embolism and subsequent spread. Visualizations of embolism repair in plants grown using identical methods (Brodersen et al., 2010) showed almost no embolism in well-watered plants (e.g. ψstem of –0.6 MPa); however, not all vessels refilled. These solitary, gas-filled vessels may act as a source of future embolism once ψstem declines during subsequent drought, thereby contributing to cavitation fatigue (Hacke et al., 2001).
Longitudinal imaging of plant A (Fig. 4) provided strong evidence that air not eliminated from the xylem during refilling can lead to future spread. The isolated embolism visible in Figure 4A fits entirely within the field of view of our HRCT scan, but it was unclear whether pit membranes prevented the expansion of the gas bubble or if it was held in place inside the vessel by water under positive pressure. The concave upper meniscus seen in Figure 4A suggests the latter explanation, and because this plant was within the range of ψstem where embolism repair is known to occur, it is possible that the vessel was refilling above and below the scanned area. However, there was no visible droplet formation as observed by Brodersen et al. (2010), and the surrounding vessels were water filled and presumably under tension. Regardless, we were able to visualize the radial spread of an isolated gas bubble into the surrounding tissue as ψstem decreased during the experiment (Fig. 4).
An alternative hypothesis is that the pith acts as a source of gas for seeding the embolisms. In our images, gas-filled pith cells were clearly visible in each plant (Fig. 2), and Brodersen et al. (2010) also observed gas-filled pith cells in refilling grapevine using the same imaging technique (HRCT). Using NMR imaging, Choat et al. (2010) and Holbrook et al. (2001) visualized the functional status of grapevine in vivo and also observed that the pith was largely devoid of water compared with the surrounding xylem. Air seeding from the pith would require direct connections between those cells and the vessels. While the two cell types were in close proximity, the HRCT images did not show any clear connections, shared cell walls, or air bubbles spanning from pith to vessels. Transverse light micrographs through the same area also showed several parenchyma cell layers between vessels and pith cells. Our scans covered 5 mm of stem tissue, and we cannot rule out the pith as a potential source for air entry into the neighboring vessels. However, based on our observations that the pith cells within close proximity to the vessels were typically filled with fluid, this pathway and hypothesis are unlikely (Fig. 6B). We also cannot rule out that homogenous bubble nucleation from the gas dissolved in the xylem sap acts as the air-seeding source without more observations (Scholander, 1955; Pickard, 1981; Tyree and Zimmermann, 2002; Konrad and Roth-Nebelsick, 2003; Sevanto et al., 2012).
In grapevine, we observed that in addition to the orientation of intervessel connections in the radial dimension and the limited tangential space for intervessel connections between rays, the ray parenchyma might act as a physical barrier preventing intervessel contact between sectors. This anatomical arrangement could therefore limit embolisms originating to only the other vessels within the same sector where connections permit radial spread but little tangential movement of embolisms. As seen in this study, only vessels with radial contact were compromised by subsequent embolism spread (Figs. 2–4). Lateral embolism spread between sectors was rare and typically occurred through vessels drifting between sectors (Fig. 5), almost certainly passing through perforated ray parenchyma. These instances always occurred in sectors within close proximity and when the band of ray parenchyma was narrow. As a consequence, each vessel sector effectively acts as a discrete modular unit. When one sector is compromised, the neighboring sectors remain functional, and this xylem organization acts as a safety mechanism preventing systemic embolism spread. While this study was focused solely on current year shoots in young plants, which shared similar xylem organization to new growth on field-grown plants (Brodersen et al., 2011), different patterns may exist in other parts of the plant. Both Choat et al. (2005) and McElrone et al. (2004) showed that resistance to cavitation increased with increasing distance from the soil. Because xylem organization is linked to embolism spread, selection for more resistant xylem networks at the site of the greatest xylem sap tension is likely to be a more successful strategy for preventing xylem embolism.
Throughout these drought experiments, we observed few signs of embolism repair. Only in plant A were droplets and broken water columns visible within the vessels (Fig. 6). Plant A showed evidence of embolism repair but likely had insufficient stored water (i.e. capacitance) or stored carbohydrates to complete the task, as the droplets and water inside the vessels did not persist in subsequent scans. It is also possible that the tension within the surrounding tissue decreased such that the water was pulled out of the embolized vessel into the functional vessels nearby (Brodersen et al., 2010). Plant A started the experiment at –1.4 MPa and, based on the vulnerability curve in Figure 7, should have had approximately the same amount of embolized vessels as a plant at –0.8 MPa. These observations give further support that supplemental water is necessary to initiate and sustain the refilling mechanism, where ψstem must increase to above –0.8 MPa before refilling occurs (Brodersen et al., 2010).
The theoretical vulnerability curve generated from the HRCT images showed good agreement with previously reported data, although the slope of the curve is not as steep as the Choat et al. (2010) data set (Fig. 7). The plants used in Choat et al. (2010) were large, 1-year-old canes from field-grown plants and up to 1 cm in diameter. In this study, stem diameters were roughly one-half that diameter. As a consequence, vessel diameters were smaller in these plants compared with older stems (Supplemental Fig. S1; Brodersen et al., 2011). We predict that the larger diameter vessels in the older plants used by Choat et al. (2010) would lead to more significant losses in conductivity as they embolize. Furthermore, several studies show that smaller diameter conduits are more resistant to cavitation than large conduits (Cochard and Tyree, 1990; Davis et al., 1999), which would also contribute to a steeper vulnerability curve in older stems with larger diameter vessels. Overall, the two different methods (NMR and HRCT) show good agreement despite the range in stem size and age.
In Figure 8, the deviation from a 1:1 ratio of vessels lost to embolism versus theoretical PLC was likely due to larger vessels embolizing at later time points, a consequence of their position in the stem. As ψstem decreased during the experiments, embolism started in the small diameter vessels and spread radially outward toward the older, wider vessels. As seen in the frequency distribution of embolized vessels at various time points during the experiments (Supplemental Fig. S2), larger diameter vessels embolized later during the experiment, with few vessels greater than 75 µm in diameter embolized at the beginning time points. Vessel diameter reached a maximum near the midpoint between the stem center and the pith (Supplemental Fig. S1; Brodersen et al., 2011), and as embolisms reached that midpoint, the greatest losses in conductivity were also observed. This coincidence likely plays an important role in steepness of the calculated vulnerability curve in Figure 7, particularly because the number of vessels within a sector does not appear to increase dramatically from the midpoint of the stem to the epidermis. As flow through vessels is strongly influenced by lumen diameter, small changes in diameter result in large increases in flow (Tyree and Zimmermann, 2002). Loss of large diameter vessels as the embolisms spread outward caused greater loss of conductivity than if all vessels were of equal diameter.
CONCLUSION
To our knowledge, these data provide the most detailed in vivo visualization of embolism spread to date and confirm that embolisms spread as previously thought, through the pit membranes in the shared walls of adjacent xylem conduits via the air-seeding mechanism (Tyree and Zimmermann, 2002; Loepfe et al., 2007). Because this technology reports on both structure and function, future applications should help fulfill the long-standing desire of plant biologists in general, and the vision of Zimmermann and Tomlinson (1966) in particular, to reveal the complex organization and function of xylem networks.
MATERIALS AND METHODS
Grapevines (Vitis vinifera var Chardonnay) were grown from 5-cm-long cuttings bearing two nodes, one developing into roots and one into a single shoot. The cuttings were sterilized in a 3% (v/v) sodium hypochlorite solution and dipped in wax to prevent desiccation. They were then placed in a plastic tray filled with a 1:1 ratio of perlite and vermiculite. The cuttings were watered daily until the first leaf was fully expanded and there was evidence of new root growth. Cuttings were then transplanted into 0.7-L plastic pots (#AB45, Stuewe and Sons) and filled with montmorillonite fritted clay (Turface MVP, Profile Products), such that the 5-cm cutting was below the soil surface and only the new growth from one node would be used for the HRCT scans. The plants were then grown to a height of approximately 50 cm in a greenhouse. Plants were watered twice daily and fertilized weekly with one-half-strength Hoagland solution.
Three to 5 d prior to HRCT imaging, the irrigation was removed to induce drought stress and cavitation. Plants were then transported by car from the University of California, Davis to the x-ray microtomography facility at the Lawrence Berkeley National Laboratory Advanced Light Source (Beamline 8.3.2). Measurements of pot weight and ψstem were used to monitor plant water status as the plants dried out. Leaves were placed in a Mylar-wrapped plastic bag for 15 min, excised with a razor blade, and then measured for ψstem with a Scholander-style pressure chamber (#3000; SoilMoisture Equipment). Plants were chosen for HRCT imaging when they reached a ψstem of approximately –1.5 MPa, the ψstem known to be close to the air-seeding threshold of grapevine pit membranes established by Sperry et al. (1987) and previously confirmed with HRCT imaging (Brodersen et al., 2010).
Three plants were imaged following the methods of Brodersen et al. (2010, 2011) for the visualization of live plant tissue using HRCT. Plants were placed in a custom-built aluminum cage and mounted on an air-bearing stage. The leaves and stem were covered in plastic wrap and inserted into a 10-cm-diameter plexiglass cylinder to reduce vibrations and stem movement during the scans. The plant was rotated in the 15-keV synchrotron x-ray beam in 0.25° increments over 180° yielding 720 two-dimensional projection images with a 4.5-µm voxel resolution captured on a 4,008- × 2,672-pixel CCD camera (#PCO 4000, Cooke Corporation). Approximately 5 mm of stem tissue was scanned from a region located 3 cm above the soil surface. The time required to complete a single scan was approximately 25 min. Plants were repeatedly scanned every 30 to 120 min to capture eight to nine time points during the drying period, with periodic ψstem measurements. The two-dimensional projection images were then reconstructed into a 3D data set using Octopus 8.3 software (Institute for Nuclear Sciences). The HRCT images were then analyzed using Avizo 6.2 software (VSG).
Following the final scan, the scanned stem tissue was excised with a razor blade, sectioned, stained with Safranin-O, and mounted in a 1:1 solution of glycerol and 50% (v/v) ethanol. Transverse sections were then imaged at 40× magnification with an Olympus Vanox microscope and imaged using a digital camera.
To determine the total number of vessels within the section, the number of cavitated vessels at each time point, and the diameter of each vessel, we used a semiautomated routine within Fiji image-processing freeware (www.fiji.sc, a Java-based distribution of ImageJ). First, the images were cropped to exclude everything in the image but the transverse section. Next, the brightness and contrast were adjusted to maximize the contrast between plant tissue and vessel lumen. The image was then converted to a binary format and then processed with noise reduction filters to eliminate any spots on the image smaller than 10 µm. In this way, only the vessel lumens remained in the image. Finally, the Analyze Particles tool was used to identify each vessel and determine the lumen area in micrometers squared. Using this method, we calculated the percentage of the total number of vessels that were embolized at each time point. Using the vessel lumen diameter data, we then approximated the volumetric flow rate (Jv) through the stems based on the remaining functional vessels using the Hagen-Poiseuille equation and following the methods of Lewis and Boose (1995):
 |
where D is the conduit diameter, µ is the viscosity of water, and Δp/Δx′ is the pressure gradient. Next, we calculated a theoretical PLC based on the approximated maximum hydraulic conductivity of the entire population of vessels and then calculated the number of remaining functional vessels at each time point. PLC was calculated by:
 |
where kmax is the calculated maximum hydraulic conductivity and ki is the calculated hydraulic conductivity at a given time point. Next, we determined the position of each vessel with respect to the stem center using TANAX software (Brodersen et al., 2011).
To determine whether the content of cavitated vessels could be determined, two sets of glass capillary tubes (#1B100-4, 0.58 mm, World Precision Instruments) were filled with water, water vapor, and air, sealed at each end with Parafilm, and scanned using the same parameters used for live plant imaging. Following HRCT image reconstruction, the voxels inside the capillary tubes were analyzed with Octopus 8.3 software to determine the mass attenuation coefficient of the liquid or gas. Ten mass attenuation coefficient values were measured for each capillary tube at 10 points along the vertical axis of the capillary tube and were then tested for significant differences using ANOVA and post hoc Student’s t tests with Bonferroni correction using SPSS 20.0.0 software.
Supplemental Data
The following materials are available in the online version of this article.
Supplemental Figure S1. Average vessel diameter at different positions from the stem center.
Supplemental Figure S2. Embolized vessel diameter distribution for three grapevine plants during drought experiments.
Supplemental Figure S3. Transverse HRCT micrograph showing glass capillary tubes filled with water vapor, water, and air.
Acknowledgments
We thank D. Parkinson and A. MacDowell for their assistance at the Lawrence Berkeley National Laboratory Advanced Light Source beamline 8.3.2 microtomography facility.
Glossary
- cryo-SEM
cryo-scanning electron microscopy
- 3D
three-dimensional
- HRCT
high-resolution x-ray computed tomography
- PLC
percentage loss of conductivity
- ψstem
stem water potential
References
- Anderegg WRL, Berry JA, Smith DD, Sperry JS, Anderegg LDL, Field CB. (2012) The roles of hydraulic and carbon stress in a widespread climate-induced forest die-off. Proc Natl Acad Sci USA 109: 233–237 [DOI] [PMC free article] [PubMed] [Google Scholar]
- Brodersen CR, Choat B, Chatelet DS, Shackel KA, Matthews MA, McElrone AJ. (2013) Xylem vessel relays contribute to radial connectivity in grapevine stems (Vitis vinifera and V. Arizonica; Vitaceae). Am J Bot 100: 314–321 [DOI] [PubMed] [Google Scholar]
- Brodersen CR, Lee EF, Choat B, Jansen S, Phillips RJ, Shackel KA, McElrone AJ, Matthews MA. (2011) Automated analysis of three-dimensional xylem networks using high-resolution computed tomography. New Phytol 191: 1168–1179 [DOI] [PubMed] [Google Scholar]
- Brodersen CR, McElrone AJ, Choat B, Matthews MA, Shackel KA. (2010) The dynamics of embolism repair in xylem: in vivo visualizations using high-resolution computed tomography. Plant Physiol 154: 1088–1095 [DOI] [PMC free article] [PubMed] [Google Scholar]
- Canny M. (1997) Vessel contents during transpiration - embolisms and refilling. Am J Bot 84: 1223–1223 [PubMed] [Google Scholar]
- Choat B, Cobb AR, Jansen S. (2008) Structure and function of bordered pits: new discoveries and impacts on whole-plant hydraulic function. New Phytol 177: 608–625 [DOI] [PubMed] [Google Scholar]
- Choat B, Drayton WM, Brodersen C, Matthews MA, Shackel KA, Wada H, McElrone AJ. (2010) Measurement of vulnerability to water stress-induced cavitation in grapevine: a comparison of four techniques applied to a long-vesseled species. Plant Cell Environ 33: 1502–1512 [DOI] [PubMed] [Google Scholar]
- Choat B, Jansen S, Brodribb TJ, Cochard H, Delzon S, Bhaskar R, Bucci SJ, Feild TS, Gleason SM, Hacke UG, et al. (2012) Global convergence in the vulnerability of forests to drought. Nature 491: 752–755 [DOI] [PubMed] [Google Scholar]
- Choat B, Lahr EC, Melcher PJ, Zwieniecki MA, Holbrook NM. (2005) The spatial pattern of air seeding thresholds in mature sugar maple trees. Plant Cell Environ 28: 1082–1089 [Google Scholar]
- Clearwater M, Clark C. (2003) In vivo magnetic resonance imaging of xylem vessel contents in woody lianas. Plant Cell Environ 26: 1205–1214 [Google Scholar]
- Cobb AR, Choat B, Holbrook NM. (2007) Dynamics of freeze-thaw embolism in Smilax rotundifolia (Smilacaceae). Am J Bot 94: 640–649 [DOI] [PubMed] [Google Scholar]
- Cochard H, Hölttä T, Herbette S, Delzon S, Mencuccini M. (2009) New insights into the mechanisms of water-stress-induced cavitation in conifers. Plant Physiol 151: 949–954 [DOI] [PMC free article] [PubMed] [Google Scholar]
- Cochard H, Tyree MT. (1990) Xylem dysfunction in Quercus: vessel sizes, tyloses, cavitation and seasonal changes in embolism. Tree Physiol 6: 393–407 [DOI] [PubMed] [Google Scholar]
- Davis SD, Sperry JS, Hacke UG. (1999) The relationship between xylem conduit diameter and cavitation caused by freezing. Am J Bot 86: 1367–1372 [PubMed] [Google Scholar]
- Dixon HH, Joly J. (1895) On the ascent of sap. Proc R Soc Lond 57: 3–5 [Google Scholar]
- Evert RF. (2006) Esau’s Plant Anatomy: Meristems, Cells, and Tissues of the Plant Body: Their Structure, Function, and Development. Wiley-Liss, Hoboken, NJ [Google Scholar]
- Hacke UG, Stiller V, Sperry JS, Pittermann J, McCulloh KA. (2001) Cavitation fatigue. embolism and refilling cycles can weaken the cavitation resistance of xylem. Plant Physiol 125: 779–786 [DOI] [PMC free article] [PubMed] [Google Scholar]
- Hayward A. (1971) Negative pressure in liquids; can it be harnessed to serve man? Am Sci 59: 434–443 [Google Scholar]
- Henke B, Gullikson E, Davis JCX. (1993) X-ray interactions: photoabsorption, scattering, transmission, and reflection at E = 50–30,000 eV, Z = 1–92. At Data Nucl Data Tables 54: 181–342 [Google Scholar]
- Holbrook NM, Ahrens ET, Burns MJ, Zwieniecki MA. (2001) In vivo observation of cavitation and embolism repair using magnetic resonance imaging. Plant Physiol 126: 27–31 [DOI] [PMC free article] [PubMed] [Google Scholar]
- Hukin D, Cochard H, Dreyer E, Le Thiec D, Bogeat-Triboulot MB. (2005) Cavitation vulnerability in roots and shoots: does Populus euphratica Oliv., a poplar from arid areas of Central Asia, differ from other poplar species? J Exp Bot 56: 2003–2010 [DOI] [PubMed] [Google Scholar]
- Johnson DM, McCulloh KA, Woodruff DR, Meinzer FC. (2012) Evidence for xylem embolism as a primary factor in dehydration-induced declines in leaf hydraulic conductance. Plant Cell Environ 35: 760–769 [DOI] [PubMed] [Google Scholar]
- Konrad W, Roth-Nebelsick A. (2003) The dynamics of gas bubbles in conduits of vascular plants and implications for embolism repair. J Theor Biol 224: 43–61 [DOI] [PubMed] [Google Scholar]
- Kuroda K, Kanbara Y, Inoue T, Ogawa A. (2006) Magnetic resonance micro-imaging of xylem sap distribution and necrotic lesions in tree stems. IAWA J 27: 3–17 [Google Scholar]
- Lewis AM, Boose ER. (1995) Estimating volume flow rates through xylem conduits. Am J Bot 82: 1112–1116 [Google Scholar]
- Loepfe L, Martinez-Vilalta J, Piñol J, Mencuccini M. (2007) The relevance of xylem network structure for plant hydraulic efficiency and safety. J Theor Biol 247: 788–803 [DOI] [PubMed] [Google Scholar]
- Mayr S, Cochard H, Améglio T, Kikuta SB. (2007) Embolism formation during freezing in the wood of Picea abies. Plant Physiol 143: 60–67 [DOI] [PMC free article] [PubMed] [Google Scholar]
- McDowell N, Pockman T, Allen C, Breshears D, Cobb N, Kolb T, Plaut J, Sperry J, West A, Williams D, Yepez E. (2008) Mechanisms of plant survival and mortality during drought why do some plants survive while others succumb to drought? New Phytol 178: 719–739 [DOI] [PubMed] [Google Scholar]
- McElrone AJ, Brodersen CR, Alsina M, Drayton W, Matthews MA, Shackel KA, Wada H, Zufferey V, Choat B. (2012) Centrifuge technique consistently overestimates vulnerability to water-stress induced cavitation in grapevines as confirmed with high-resolution computed tomography. New Phytol 196: 661–665 [DOI] [PubMed] [Google Scholar]
- McElrone AJ, Pockman WT, Martinez-Vilalta J, Jackson RB. (2004) Variation in xylem structure and function in stems and roots of trees to 20 m depth. New Phytol 163: 507–517 [DOI] [PubMed] [Google Scholar]
- Melcher PJ, Zwieniecki MA, Holbrook NM. (2003) Vulnerability of xylem vessels to cavitation in sugar maple. Scaling from individual vessels to whole branches. Plant Physiol 131: 1775–1780 [DOI] [PMC free article] [PubMed] [Google Scholar]
- Neufeld HS, Grantz DA, Meinzer FC, Goldstein G, Crisosto GM, Crisosto C. (1992) Genotypic variability in vulnerability of leaf xylem to cavitation in water-stressed and well-irrigated sugarcane. Plant Physiol 100: 1020–1028 [DOI] [PMC free article] [PubMed] [Google Scholar]
- Pérez-Donoso AG, Greve LC, Walton JH, Shackel KA, Labavitch JM. (2007) Xylella fastidiosa infection and ethylene exposure result in xylem and water movement disruption in grapevine shoots. Plant Physiol 143: 1024–1036 [DOI] [PMC free article] [PubMed] [Google Scholar]
- Pickard WF. (1981) The ascent of sap in plants. Prog Biophys Mol Biol 37: 181–229 [Google Scholar]
- Rood SB, Patino S, Coombs K, Tyree MT. (2000) Branch sacrifice: cavitation-associated drought adaptation of riparian cottonwoods. Trees 14: 248–257 [Google Scholar]
- Scholander PF, Bradstreet ED, Hemmingsen EA, Hammel HT. (1965) Sap pressure in vascular plants: negative hydrostatic pressure can be measured in plants. Science 148: 339–346 [DOI] [PubMed] [Google Scholar]
- Sevanto S, Holbrook NM, Ball MC. (2012) Freeze/thaw-induced embolism: probability of critical bubble formation depends on speed of ice formation. Front Plant Sci 3: 107. [DOI] [PMC free article] [PubMed] [Google Scholar]
- Sperry JS, Holbrook NM, Zimmermann MH, Tyree MT. (1987) Spring filling of xylem vessels in wild grapevine. Plant Physiol 83: 414–417 [DOI] [PMC free article] [PubMed] [Google Scholar]
- Sperry JS, Tyree MT. (1988) Mechanism of water stress-induced xylem embolism. Plant Physiol 88: 581–587 [DOI] [PMC free article] [PubMed] [Google Scholar]
- Stiller V, Sperry JS. (2002) Cavitation fatigue and its reversal in sunflower (Helianthus annuus L.). J Exp Bot 53: 1155–1161 [DOI] [PubMed] [Google Scholar]
- Sun Q, Rost TL, Reid MS, Matthews MA. (2007) Ethylene and not embolism is required for wound-induced tylose development in stems of grapevines. Plant Physiol 145: 1629–1636 [DOI] [PMC free article] [PubMed] [Google Scholar]
- Tyree M, Zimmermann M. (2002) Xylem Structure and the Ascent of Sap. Springer Verlag, Berlin [Google Scholar]
- Tyree MT, Sperry JS. (1989) Vulnerability of xylem to cavitation and embolism. Annu Rev Plant Biol 40: 19–36 [Google Scholar]
- Umebayashi T, Fukuda K, Haishi T, Sotooka R, Zuhair S, Otsuki K. (2011) The developmental process of xylem embolisms in pine wilt disease monitored by multipoint imaging using compact magnetic resonance imaging. Plant Physiol 156: 943–951 [DOI] [PMC free article] [PubMed] [Google Scholar]
- Utsumi Y, Sano Y, Funada R, Fujikawa S, Ohtani J. (1999) The progression of cavitation in earlywood vessels of Fraxinus mandshurica var japonica during freezing and thawing. Plant Physiol 121: 897–904 [DOI] [PMC free article] [PubMed] [Google Scholar]
- Wheeler JK, Sperry JS, Hacke UG, Hoang N. (2005) Inter-vessel pitting and cavitation in woody Rosaceae and other vesselled plants: a basis for a safety versus efficiency trade-off in xylem transport. Plant Cell Environ 28: 800–812 [Google Scholar]
- Zimmermann MH, Tomlinson PB. (1966) Analysis of complex vascular systems in plants: optical shuttle method. Science 152: 72–73 [DOI] [PubMed] [Google Scholar]
- Zwieniecki MA, Holbrook NM. (2009) Confronting Maxwell’s demon: biophysics of xylem embolism repair. Trends Plant Sci 14: 530–534 [DOI] [PubMed] [Google Scholar]


