Abstract
The calcineurin inhibitors (CNIs) [cyclosporin A (CsA) and tacrolimus (Tac)] are currently the most widely prescribed drugs for maintenance of immunosuppression after renal transplantation. These immunosuppressants are associated with side effects such as hyperlipidemia. We evaluated the differential effects of different CNIs on serum lipid parameters in renal transplant patients. Moreover, the aim of this study is to investigate the relationships between doses and blood levels of CNIs, and blood levels of CNIs and lipid parameters retrospectively. Two groups of 98 non-diabetic renal transplant patients, each treated with different CNIs, were studied: group A (n = 50, mean age: 31 ± 10 years), CsA, mycophenolate mofetil/azathioprin, steroid; group B (I = 48, mean age: 34 ± 12 years), Tac, mycophenolate mofetil/azathioprin, steroid. In renal transplant patients, CNIs blood levels and doses were examined at 1, 3, 6, 9, and 12 months after transplantation. Biochemical laboratory parameters including plasma lipids [total-cholesterol (CHOL), low-density lipoprotein (LDL)–CHOL, high-density lipoprotein (HDL)–CHOL, and triglycerides (TG)], CNI levels and doses were examined at 1, 3, 6, 9, and 12 months after transplantation. None of the patients received anti-lipidemic drugs during the study period. Blood levels of CNIs were detectable in all whole-blood samples by Cloned- Enzyme-Donor Immunoassay (CEDIA). The relationship between CNIs blood levels and CHOL, (LDL)–CHOL, HDL–CHOL, TG were evaluated. The mean serum CHOL levels and LDL–CHOL levels of patients in group A were found significantly higher than the patients in group B during the 12 month of follow up (p < 0.05). There was no significant difference in TG and HDL–CHOL plasma levels between group A and group B (p > 0.005). In group A the daily dose of CsA was significantly correlated with the mean blood levels of CsA at the 1st and 3rd months (r = 0.387, p = 0.005; r = 0.386, p = 0.006), respectively. In group A, the daily dose of CsA was significantly correlated with the mean serum TG levels during the 12 month of follow up (r = 0.420, p = 0.003). In group B, the daily dose of Tac was significantly correlated with the mean blood level of Tac (r = 0.335, p = 0.020) at the 1st month. No correlation was found between mean Tac blood levels and lipid parameters during the 12-month of follow up (p > 0.05). Significant positive correlation was observed between the CsA blood levels and LDL–CHOL levels (r = 0.338, p = 0.027) at the 3rd month. In the renal transplant patients with well functioning grafts, CsA therapy is associated with increased CHOL and LDL–CHOL ratio which represents an increased atherogenic risk tended to be associated with CsA. Serum LDL–CHOL levels may be effected by blood CsA levels.
Keywords: Calcineurin inhibitors, Renal transplantation, Lipid metabolism, Cardiovascular diseases
Introduction
Clinical application of immunosuppressants has significantly improved patient survival in renal transplant—with first-year survival of up to 90 %. With the introduction of CsA into clinical practice in the 1980s, therapeutic drug monitoring (TDM) of CsA and other more recently introduced immunosuppressants has become an indispensable adjunct for the effective treatment of transplant patients [1–3]. CsA and Tac, the most potent immunosuppressants are termed CNIs due to their ability to inhibit this ubiquitous phosphatase [4]. CsA is a cyclic, 11-membered peptide of fungal origin, “Tolypocladium inflatum” gams. The mechanism of action of CsA has been attributed to inhibition of T cell-mediated responses, reduction in interleukin-2 synthesis, and inhibition of interferon-γ synthesis [4]. Tac, a macrolide lactone immunosuppressant from the fungus “Streptomyces tsukubaensis”, is used in combination with other immunosuppressants such as mycophenolic acid in the prophylaxis of renal transplant rejection [5, 6]. The outcome of renal transplantation is improved by CsA and Tac. However, its success is limited by drug-induced nephrotoxicity. With regard to renal function, the side effects profile and toxicity are similar to those of CsA; however, gingivitis and hirsutism are not frequently observed. The toxicity CsA side effects include: nephrotoxicity, neurotoxicity, hepatic toxicity, hiperlipidemia, risk of lymphoma, hypertension, gingival hyperplasia, and hirsutism. Dyslipidemia is commonly found in patients after renal transplantation and it is associated with cardiovascular complications. Renal transplant patients suffer high mortality due to cardiovascular diseases [7, 8]. Some of the side effects may be dose related. CNIs have a narrow therapeutic window. Hence, monitoring their levels is important for their administration [9]. In this study, we aimed to evaluate the differential effects of different CNIs on serum lipid parameters in renal transplant patients.
Materials and Methods
Materials
We retrospectively evaluated the records of 98 patients between 2001 and 2010. Two groups comprising 98 non-diabetic renal transplant patients, each treated with different CNIs, were studied: group A (n = 50, mean age: 31 ± 10 years), containing CsA, mycophenolate mofetil/azathioprin, steroid; and group B (n = 48, mean age: 34 ± 12 years), containing Tac, mycophenolate mofetil/azathioprin, steroid.
Study Design
Biochemical laboratory parameters including plasma lipids CHOL, LDL–CHOL, HDL–CHOL, and TG, CNIs levels and the doses were examined at the 1, 3, 6, 9 and 12 months after transplantation. None of the patients received anti-lipidemic agents during the study period. Blood levels of CNIs were measured in the whole blood using CEDIA method using the microgenics MGC240.
Statistical Analysis
In the data analysis, we used the SPSS version 16.0 for Microsoft Windows. The data were presented as mean SD for the parametrical data and as median for the non-parametrical. The Kolmogrov Smirnov test was done. The linear correlation of determination was used to determine the correlation between the CNIs dose and the blood level. The statistical analysis was performed by the one-way ANOVA for repeated measurements. A p value of 0.05 was considered significant.
Results
The demographic characteristics of ninety-eight renal transplant patients have been presented given in Table 1.
Table 1.
Demographic characteristics of patients
| Patients | CsA (group A) (n = 50) | Tac (group B) (n = 48) | p |
|---|---|---|---|
| Age ± SD (year) | 31 ± 10 | 34 ± 12 | 0.24 |
| Number (gender F/M) | 12/38 | 26/22 | 0.002* |
| Body-weight index(kg/m2) | 22.1 ± 3.9 | 21.3 ± 3.8 | 0.34 |
| Dialysis (month) | 41.5 ± 37.6 | 39.7 ± 38.1 | 0.45 |
| Other therapy | |||
| AZA/steroid | 13 (25 %) | 6 (12 %) | 0.06 |
| MMF/steroid | 38 (75 %) | 43 (88 %) | 0.06 |
| Systolic BP | 125 ± 22 | 123 ± 23 | 0.43 |
| Diastolic BP | 75 ± 17 | 78 ± 13 | 0.79 |
| Post-tx time (month) | 12 | 12 | – |
* Statistically significant difference
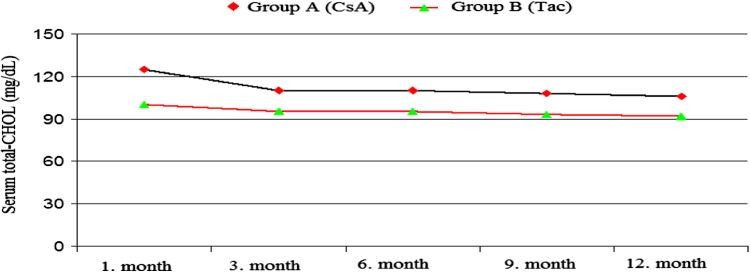
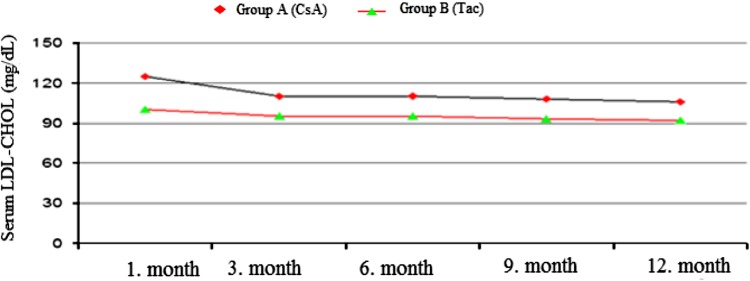
The mean CHOL levels were found to be considerably higher in the CsA group than in the Tac group at the 1st, 6th and 9th months. At the 1st, 3rd, 6th and 12th months, the serum LDL–CHOL levels were found to be higher in the CsA group than in the Tac group [(124 ± 44 and 99 ± 28 mg/dl, p = 0.003), (108 ± 31 and 94 ± 22 mg/dl p = 0.022), (109 ± 33 and 94 ± 27 mg/dl, p = 0.015), (105 ± 32 and 92 ± 27 mg/dl, p = 0.044)] (Figs. 1, 2).
Fig. 1.
Serum total CHOL (mg/dL) levels during treatment with both CsA and Tac
Fig. 2.
Serum LDL–CHOL (mg/dL) levels during treatment with both CsA and Tac
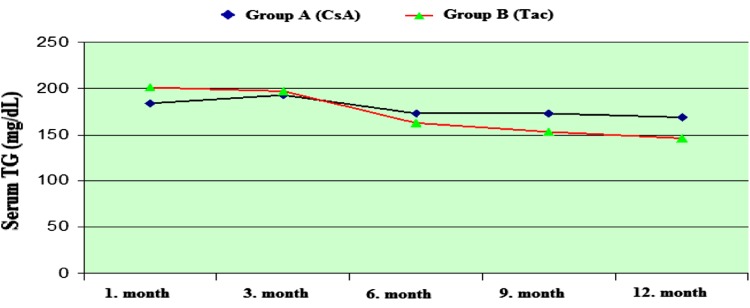
There was no significant difference in TG and HDL–CHOL serum levels between the CsA and the Tac groups (Figs. 3, 4).
Fig. 3.
Serum TG (mg/dL) levels during treatment with both CsA and Tac
Fig. 4.
Serum HDL–CHOL (mg/dL) levels during treatment with both CsA and Tac
In group A, the dose of CsA was found to be correlated with the mean blood levels of CsA at the 9th month (r = 0.675, p = 0.005). In group B, the dose of Tac was found to be correlated with the mean blood level of Tac (r = 0.557, p = 0.008) at the 9th month (Table 2).
Table 2.
Doses and blood levels in renal transplant patients receiving CsA and Tac treatment
| 1 month |
r p |
3 months |
r p |
6 months |
r p |
9 months |
r p |
12 months |
r p |
|
|---|---|---|---|---|---|---|---|---|---|---|
| CsA dosage (mg/day) | 270 ± 101.6 | 0.387 0.005 |
220 ± 67.5 | 0.386 0.005 |
210 ± 58.1 | 0.300 0.040 |
158 ± 65.1 | 0.675 0.005 |
186 ± 50.3 | 0.521 0.006 |
| CsA blood level (ng/ml) | 251 ± 115.8 | 199 ± 96.1 | 174 ± 73.7 | 158 ± 65.1 | 153 ± 57.1 | |||||
| Tac dosage (mg/day) | 6.78 ± 3.77 | 0.335 0.009 |
5.01 ± 3.11 | 0.126 0.690 |
4.71 ± 3.09 | 0.118 0.411 |
7.31 ± 2.82 | 0.557 0.008 |
4.63 ± 2.80 | 0.461 0.007 |
| Tac blood level (ng/ml) | 13.3 ± 5.36 | 10.93 ± 5.48 | 9.01 ± 3.15 | 8.31 ± 32.82 | 7.41 ± 2.71 |
A significant positive correlation was observed between the CsA blood levels and the LDL–CHOL levels (r = 0.338, p = 0.027) at the 3rd month. The mean blood CsA blood levels of the patients were significantly correlated with the mean serum LDL–CHOL levels during the 12-month follow-up (r = 0.326, p = 0.05). No correlation was found between the mean serum Tac levels and the lipid parameters during the 12-month follow-up. In group A, the daily dose of CsA was found to be significantly correlated with the mean serum TG levels at the 12-month follow-up (r = 0.420, p = 0.003) (Table 3).
Table 3.
Lipid profiles in renal transplant patients receiving CsA and Tac treatment
| 1 month | p | 3 months | p | 6 months | p | 9 months | p | 12 months | p | |
|---|---|---|---|---|---|---|---|---|---|---|
| Total CHOL in CsA patients (mg/dl) | 212 ± 52.1 | 0.12 | 201 ± 76.2 | 0.061 | 195 ± 76.2 | 0.052 | 190 ± 36.2 | 0.18 | 183 ± 47.2 | 0.24 |
| Total CHOL in Tac patients (mg/dl) | 199 ± 101.2 | 185 ± 42.9 | 177 ± 34.2 | 176 ± 29.2 | 176 ± 31.2 | |||||
| LDL -CHOL in CsA patients (mg/dl) | 124 ± 44* | 0.003* | 108 ± 31* | 0.022* | 109 ± 33* | 0.015* | 100 ± 28.4 | 0.51 | 105 ± 32.2* | 0.044* |
| LDL–CHOL in Tac patients (mg/dl) | 99 ± 28.3 | 94 ± 22.6 | 94 ± 27.1 | 92 ± 26.2 | 92 ± 27.1 | |||||
| HDL-CHOL in CsA patients (mg/dl) | 54 ± 24.6 | 0.57 | 46 ± 13.5 | 0.46 | 51 ± 20.2 | 0.56 | 47 ± 13.2 | 0.52 | 48 ± 15.2 | 0.41 |
| HDL–CHOL in Tac patients (mg/dl) | 60 ± 18.2 | 50 ± 15.2 | 53 ± 16.2 | 51 ± 16.8 | 51 ± 16.2 | |||||
| TG in CsA patients | 185 ± 100.1 | 0.053 | 193 ± 66.2 | 0.84 | 173 ± 81.2 | 0.85 | 173 ± 65.2 | 0.06 | 168 ± 64.2 | 0.56 |
| TG in Tac patients | 200 ± 104.2 | 195 ± 101.2 | 162 ± 80.0 | 155 ± 91.3 | 147 ± 73.2 |
* Statistically significant difference
Discussion
Renal transplant patients suffer mortality and morbidity due to cardiovascular diseases as a result of the high incidence of cardiovascular risk factors such as hypertension, diabetes mellitus, smoking and dyslipidemia. Retrospective studies have demonstrated that high concentrations of CHOL, TG, and LDL–CHOL levels are related to cardiovascular diseases [10]. Lipid disorders are commonly reported in renal transplant patients. Following renal transplantation, dyslipidemia may be associated with immunosuppressive therapy with CsA, Tac, mycofenolate mofetil, azathioprine and corticosteroids or combinations these drugs [11]. Furthermore, it has been reported that dyslipidemia may be related with lower allograft survival. Several studies have shown that Tac has less effect on lipid profile than CsA [7, 10, 11]. Colak et al. reported that Tac does not affect the CHOL, LDL–CHOL, TG and HDL-–CHOL [12]. Ligtenberg et al. demonstrated that the LDL–CHOL levels increased in patients treated with CsA [8]. In our study, we evaluated retrospectively the serum lipid profile and TGs in treatment with CsA and Tac after renal transplantation at the first postoperative year. In this study, they indicated that total CHOL and LDL–CHOL levels increased during treatment with CsA. The effects on HDL–CHOL and TG are similar in immunosuppressive treatment. CsA increases the serum LDL cholesterol level by inhibiting the synthesis of LDL receptors [7]. Following transplantation, dyslipidemia appears to be dependent on the immunosuppressant and the dose. The effect of CsA seems to be dose-dependent, since there is a rough correlation between blood CsA blood levels and the degree of hypercholesterolemia [13]. Our study showed that a significant positive correlation was determined between the CsA blood levels and the LDL–CHOL levels at the 3rd month. No correlation was found between the mean serum Tac levels and the lipid parameters during the 12-month follow-up. This study demonstrated that the daily dose of CsA was significantly correlated with serum TG levels. In conclusion, monitoring of CNIs and serum lipids is very important for individual choice and dosage of immunosuppressants after renal transplantation. These results show that the benefits include a lower risk of rejection, and enhance graft and patient survival.
Contributor Information
Hayriye Senturk Ciftci, Phone: 00905323164576, FAX: 00902126351168, Email: hayriyesenturk@gmail.com.
Tulay Kilicaslan Ayna, Email: tulayayna@gmail.com.
Yasar Kerem Calıskan, Email: ykcaliskan@yahoo.com.
Aydin Turkmen, Email: turkmenaydin@yahoo.com.
Mehmet Gurtekin, Email: mgurtek@istanbul.edu.tr.
References
- 1.Thomson W, Starzl TE Immunosuppressive drugs: developments in anti-rejection. London: Edward Arnold; 1994. p. 235.
- 2.Thomson W. FK 506-How much potential? Immunol Today. 1989;10:6–10. doi: 10.1016/0167-5699(89)90057-1. [DOI] [PubMed] [Google Scholar]
- 3.Calne RY. Immunosuppression in liver transplantation. N Engl J Med. 1994;331:1154–1155. doi: 10.1056/NEJM199410273311711. [DOI] [PubMed] [Google Scholar]
- 4.Kapturczak MH, Meier-Kriesche HU, Kaplan B. Pharmacology of calcineurin antagonists. Transplant Proc. 2004;36(2):25–32. doi: 10.1016/j.transproceed.2004.01.018. [DOI] [PubMed] [Google Scholar]
- 5.Goto T, Kino T, Hatanaka H, Nishiyama M, Okuhara M, Kohsaka M, et al. Discovery of FK 506, a novel immunosuppressant isolated from Streptomyces tsukabaensis. Transplant Proc. 1987;6(91):4–8. [PubMed] [Google Scholar]
- 6.Kino T, Hatanaka H, Hashimoto M, Nishiyama M, Goto T, Okuhara M, et al. FK 506, a novel immunosuppressant isolated from a Streptomyces:I. Fermentation, isolation, and physico-chemical and biological characteristics. J Antibiot (Tokyo) 1987;40:1249–1255. doi: 10.7164/antibiotics.40.1249. [DOI] [PubMed] [Google Scholar]
- 7.Wanner C, Quaschning T. Abnormal lipid metabolism after renal transplantation. Ann Transplant. 2001;6(1):5–8. [PubMed] [Google Scholar]
- 8.Ligtenberg G, Hene RJ, Blankestıjn PJ, Koomans HA. Cardiovascular risk factors in renal transplant patients: cyclosporin A versus tacrolimus. J Am Soc Nephrol. 2001;12:368–373. doi: 10.1681/ASN.V122368. [DOI] [PubMed] [Google Scholar]
- 9.Nemati E, Einollahi B, Taheri S, Moghani LM, Kalantar E, Simforoosh N, et al. Cyclosporine trough (C0) and 2-hour postdose (C2) levels: which one is a predictor of graft loss? Transplant Proc. 2007;39(4):1223–1224. doi: 10.1016/j.transproceed.2007.02.005. [DOI] [PubMed] [Google Scholar]
- 10.Badiou S, Cristol JP, Mourad G. Dyslipidemia following kidney transplantation: diagnosis and treatment. Curr Diab Rep. 2009;9:305–311. doi: 10.1007/s11892-009-0047-0. [DOI] [PubMed] [Google Scholar]
- 11.Quaschning T, Mainka T, Nauck M, Christian LR, Wanner C, Kramer-Guth A. Immunosuppression enhances atherogenicity of lipid profile after transplantation. Kidney Int. 1999;56(71):235–237. doi: 10.1046/j.1523-1755.1999.07162.x. [DOI] [PubMed] [Google Scholar]
- 12.Colak T, Karakayali, Yagmurdur MC, Moray G. Effect of conversion from cyclosporine to tacrolimus on lipid profiles in renal transplant recipients. Transplant Proc. 2002;34:2081–2082. doi: 10.1016/S0041-1345(02)02859-2. [DOI] [PubMed] [Google Scholar]
- 13.Kuster GH, Bartucci MR, Mayes JT, Schulac JA. The effects of cyclosporine and prednisone on serum lipid and (apo) lipoprotein levels in renal transplant recipients. J Am Soc Nephrol. 1995;5:2077. doi: 10.1681/ASN.V5122073. [DOI] [PubMed] [Google Scholar]


