

Abstract
Dynamic shifts in transcription factor binding are central to the regulation of biological processes by allowing rapid changes in gene transcription. However, very few genome-wide studies have examined how transcription factor occupancy is coordinated temporally in vivo in higher animals. Here, we quantified the genome-wide binding patterns of two key hepatocyte transcription factors, CEBPA and CEBPB (also known as C/EBPalpha and C/EBPbeta), at multiple time points during the highly dynamic process of liver regeneration elicited by partial hepatectomy in mouse. Combining these profiles with RNA polymerase II binding data, we find three temporal classes of transcription factor binding to be associated with distinct sets of regulated genes involved in the acute phase response, metabolic/homeostatic functions, or cell cycle progression. Moreover, we demonstrate a previously unrecognized early phase of homeostatic gene expression prior to S-phase entry. By analyzing the three classes of CEBP bound regions, we uncovered mutually exclusive sets of sequence motifs, suggesting temporal codes of CEBP recruitment by differential cobinding with other factors. These findings were validated by sequential ChIP experiments involving a panel of central transcription factors and/or by comparison to external ChIP-seq data. Our quantitative investigation not only provides in vivo evidence for the involvement of many new factors in liver regeneration but also points to similarities in the circuitries regulating self-renewal of differentiated cells. Taken together, our work emphasizes the power of global temporal analyses of transcription factor occupancy to elucidate mechanisms regulating dynamic biological processes in complex higher organisms.
Most biological processes—such as embryonic development, differentiation, or cellular responses to external stimuli—are in essence dynamic, which requires the underlying transcriptional networks to be tightly temporally coordinated. Several large-scale temporal studies have focused on the comprehensive mapping of dynamic changes of gene expression but have not revealed how coordination is achieved on the transcriptional level (e.g., van Wageningen et al. 2010). To address this question globally, the binding of regulatory proteins has been examined using methods such as chromatin immunoprecipitation with microarrays (ChIP-chip) or sequencing (ChIP-seq) (e.g., Sandmann et al. 2006a; Johnson et al. 2007; Vogel et al. 2007). Still, many such studies have operated with just one or two conditions. The exceptions include temporal examinations in the model systems Drosophila and yeast (Sandmann et al. 2006b; Jakobsen et al. 2007; Ni et al. 2009; Zinzen et al. 2009). So far, very few in vivo, multi-time point investigations of transcription factor (TF) binding have been undertaken in higher vertebrates.
Mammalian liver regeneration is a well-studied process, in which the large majority of mature hepatocytes rapidly and in a highly synchronized manner re-enter the cell cycle upon injury (Fausto et al. 2006; Michalopoulos 2007; Malato et al. 2011). Serial transplantation of liver tissue has demonstrated a very high “repopulating” capacity of hepatocytes (Overturf et al. 1997), which lends hope to using these cells in regenerative medicine. The ability of mature liver cells to proliferate is reminiscent of specific, differentiated cells of the immune system (naive T cells, B cells) that are kept in quiescence until exposed to specific stimuli (Glynne et al. 2000; Yusuf and Fruman 2003; Feng et al. 2008). However, it remains open whether similar programs control the proliferation of hepatocytes and immune cells. In the liver, a number of studies have mapped temporal changes in mRNA levels during regeneration (e.g., White et al. 2005). This, coupled with functional studies, has led to the identification of several TFs involved in the regenerative response (for review, see Kurinna and Barton 2011). Still, knowledge about how these factors are coordinated temporally throughout the regenerative process is limited.
CEBPA (C/EBPalpha) and CEBPB (C/EBPbeta) are two key hepatocyte TFs known to have divergent roles in liver function and regeneration. The two factors belong to the same basic region leucine zipper-family (bZIP), and several studies have shown that they bind the same core DNA sequence, acting as either homo- or heterodimers (Diehl and Yang 1994; Rana et al. 1995; Osada et al. 1996). While CEBPA is highly expressed in the quiescent condition (before injury) and regulates many metabolic liver genes, CEBPB is up-regulated during liver regrowth and is required for a full regenerative response (Greenbaum et al. 1995; Wang et al. 1995). In many tissues, CEBPA is observed to be an anti-proliferative factor facilitating differentiation, while CEBPB has been found to be either pro- or anti-proliferative in different settings (Porse et al. 2001; Nerlov 2007). In the skin, the two factors appear to act redundantly to limit epidermal stem cell activity (Lopez et al. 2009).
In the current study, we have examined dynamic TF binding during liver regeneration in the mouse by performing a time course of ChIP-seq experiments to map and quantify binding of CEBPA and CEBPB on a genome-wide scale at a high level of temporal resolution. We find that CEBPA and CEBPB generally occupy the same positions in the genome of hepatocytes in vivo, but they do so with quantitatively divergent temporal patterns during regeneration.
To further dissect the dynamic transcriptional network behind liver regeneration, we interrogated the temporally defined groups of CEBP-bound elements for regulatory properties, both with respect to sequence composition and differential expression of associated genes.
Results
A time course of CEBPA and CEBPB in vivo ChIP experiments reveals three distinct patterns of binding
Liver regeneration in rodents has been studied in detail using partial hepatectomy, in which three of five lobes of the liver are resected. The hepatocytes in the remaining liver lobes undergo up to two cell cycles during the first week of liver regeneration, hereby reestablishing presurgical liver mass (for reviews, see Fausto et al. 2006; Michalopoulos 2007). To examine the binding dynamics of CEBPA and CEBPB during liver regeneration, we harvested regenerating liver tissue at eight time points (0, 3, 8, 16, 24, 36, 48, and 168 h; Methods). These time points cover the quiescent state (G0), several stages of the first cell cycle growth phase (G1), the G1–S-phase transition at 36 h, a later time point at 48 h, as well as the terminal phase point of 168 h (Fig. 1A; Matsuo et al. 2003; Fausto et al. 2006). Livers from five mice for each time point were subjected to ChIP using specific CEBPA or CEBPB antibodies (Methods) (Fig. 1B). We confirmed antibody specificity by doing ChIP in mice deficient for Cebpa or Cebpb or by including epitope blocking peptides (Supplemental Fig. S1). To minimize experimental variation, we pooled DNA precipitated from each of the five mice in equal amounts and sequenced the combined material. We mapped the sequences to the mouse genome (mm9) and determined base pair coverage after internal normalization to the total mapped read count for each antibody (Supplemental Methods; Supplemental Fig. S2; Supplemental Table S1). Genomic regions bound by either CEBPA or CEBPB were identified with the Useq peak-finder algorithm using a mock immunoprecipitation (IP) control (Supplemental Methods, Supplemental Table S2). We validated IP consistency of two series of three independent ChIPs at four different CEBP bound genomic locations (Supplemental Fig. S3). For further validation, we performed de novo motif searches on several data sets and a conservation score analysis centering on CEBP motifs, all of which confirmed the quality of our ChIP-seq data (Supplemental Fig. S4).
Figure 1.

A ChIP-seq time course of mouse liver regeneration. (A) Overview of the experimental time course. Eight time points covering the full week of the regenerative response; phases of the first cell cycle indicated. Previous studies show a prolonged decrease in the CEBPA to CEBPB ratio. (B) Experimental outline for ChIP experiments. Partial hepatectomy was carried out on five mice for each time point. The regenerating liver tissue was harvested after variable time intervals, fixed, and subjected to ChIP-seq. (C) Normalized coverage maps of four gene proximal regions with ChIP-seq peaks, marked by dashed vertical lines. Each row represents a time point for either CEBPA (top eight rows, dark purple) or CEBPB (bottom eight rows, dark pink). Gene loci are shown in black below. (D) CEBPA and CEBPB temporal binding profiles based on genomic coverage, generated from the peaks in the C. (Alb-enh) Albumin proximal region; (Mdc1) mediator of DNA damage checkpoint 1; (Orm1) orosomucoid 1; (Cps1) carbamoyl-phosphate synthetase 1.
Next, CEBPA or CEBPB peaks for each time point were used to construct a sum list of all enriched regions. Four examples of enriched regions located just upstream of gene loci are shown in Figure 1, depicting genomic coverage for the CEBPA and CEBPB ChIP time series (Fig. 1C).
After applying a stringent filtering regimen, we identified a total of 11,314 high-confidence regions bound by CEBPA or CEBPB, many of which show highly dynamic occupancy during the course of regeneration (for full peak calling numbers and region coverage, see Supplemental Tables S2, S3; for filtering, see Supplemental Methods). We assembled temporal binding profiles for all bound regions based on maximal genomic coverage. As illustrated in Figure 1 for the four regions mentioned above, distinct profile patterns can be observed (Fig. 1D).
The high temporal resolution of the obtained binding profiles allowed us to query for groups of putative cis-regulatory regions with similar occupancy dynamics. By hierarchical clustering, we identified three prevalent clusters (Fig. 2A), containing roughly equal numbers of bound regions (3549, 2818, and 3034 for the A, B, and C clusters, respectively). Two clusters (A and B) were defined by strong CEBPB binding, with maxima either at the 3- and 36-h (A) or at the 3-h (B) time points, which is also evident in a summed profile of temporal coverage (Fig. 2B). As opposed to the A and B clusters, the C cluster was characterized by a high degree of temporal correspondence between the CEBPA and CEBPB binding levels, with maxima at the quiescent state 0-h time point and at 24 h (Fig. 2A,B). The detected robust binding of CEBPA at the 16- and 24-h time points was unexpected, as previous studies have reported decreased protein levels for this TF throughout the regenerative process (Greenbaum et al. 1995, 1998). To clarify this, we examined the protein levels for CEBPA and CEBPB until the first round of replication (time points, 0–36 h) by Western blotting (Fig. 2C). This highlighted a clear correlation between the CEBPA to CEBPB protein level ratios and the observed binding patterns. Specifically, we detected high levels of CEBPB at the 3- and 36-h time points, high CEBPA levels at the quiescent state (0 h), and a return of CEBPA predominance at 16- and 24-h time points (Fig. 2C,D).
Figure 2.

Three distinct temporal binding patterns reflect the CEBPA and CEBPB protein level ratios. (A) Heatmap of hierarchical clustering on CEBPA and CEBPB binding profiles, based on genomic coverage in each region (row) and time point (column). White signifies low binding level (coverage 0); dark blue, high (cut-off at coverage 120). The most prominent clusters are marked A, B, and C. (B) Summarized coverage profiles of the three clusters. For each profile, summed time point levels are shown as normalized to the highest point (set to 1). (C) Western blot showing CEBPA and CEBPB levels through the first 36 h of liver regeneration. Isoforms indicated (CEBPA: p42 and p30; CEBPB: LAP*, LAP, and LIP). Loading control is histone H3. Experiment is representative of three independent repeats. (D) Representative quantification of protein levels based on signal intensities (using ImageJ). All isoforms included for protein level determination, normalized to a maximum value of 1.
The three binding pattern clusters are associated with specific functional classes of genes
The temporally distinct CEBP binding patterns of putative cis-regulatory regions belonging to the three clusters suggest divergent regulatory roles through the regenerative process. To address this possibility, we investigated whether each cluster was associated with specific sets of differentially expressed genes. To this end, we performed ChIP-seq experiments with liver tissue from the eight time points outlined above with an antibody specific to RNA polymerase II (POL2). In contrast to examining steady-state mRNA levels, this allowed us to directly measure the transcriptional activity at any given time point as POL2 binding to each gene body (Supplemental Methods; Sandoval et al. 2004). To pinpoint genes regulated by CEBPA and/or CEBPB, a single putative target gene was assigned to each bound region, based on proximity to the transcription start site (TSS) of neighboring genes (Supplemental Methods). Genes associated with regions belonging to one of the three binding profile clusters (A, B, or C cluster genes) were inspected for differential expression (for a full target gene list, see Supplemental Table S4).
For an initial overview, we counted differentially expressed genes from each cluster, defined as genes with a change in POL2 gene body coverage above twofold, comparing each time point to 0 h (Fig. 3A). This revealed that all clusters are associated with prominent gene expression changes at the 3-h time point. The C cluster was associated with a large group of down-regulated genes at 3 h and, furthermore, displayed up-regulation of many genes at 24 h. In contrast, the A and B clusters mostly exhibit down-regulation at the 24-h time point and up-regulation early in the time course (3 and 8 h), as well as a resurge at 36 h (mainly the A cluster).
Figure 3.

The A, B, and C cluster regions target distinct sets of genes. (A) Heatmap of gene expression changes through liver regeneration. “Up” and “down” bins count genes associated with a CEBP cluster (A, B, or C), exceeding a 2.0-fold change threshold (POL2 binding level change relative to 0 h). Blue color intensity indicates number of genes going up; gray intensity, genes going down. (B) Representative examples of transcriptional activity (polymerase II [POL2] binding) of putative target genes. CEBPB binding illustrates gene association with either the C (Cps1) or A (Mdc1) cluster exclusively (upper left and right panel, respectively) or association with peaks belonging to both B and C clusters (Adh7 and Orm1; bottom panels). Gene loci are shown in black below; binding levels for CEBPB and POL2, in dark pink and red, respectively. Black numbers indicate POL2 gene body coverage for time point comparison. (Adh7) Alcohol dehydrogenase 7; for additional gene symbols, see Figure 1.
Next, we focused the analysis on the 0-, 3-, 24-, and 36-h time points, as these displayed the most pronounced TF binding differences between the three clusters and therefore are likely to represent the most distinct regulatory states. Groups of genes, up- or down-regulated from one time point to the next (i.e., from 0–3 h, 3–24 h, and 24–36 h), were subjected to gene ontology (GO) analysis with the online DAVID tool (Supplemental Methods) (Huang da et al. 2009). As summarized in Table 1, we observed extensive differences in functional classes (GO terms, Biological Process) of differentially expressed genes associated with the three binding patterns (for full GO analysis lists, see Supplemental Table S5).
Table 1.
Target gene GO categories define distinct regulatory roles for the A, B, and C binding clusters
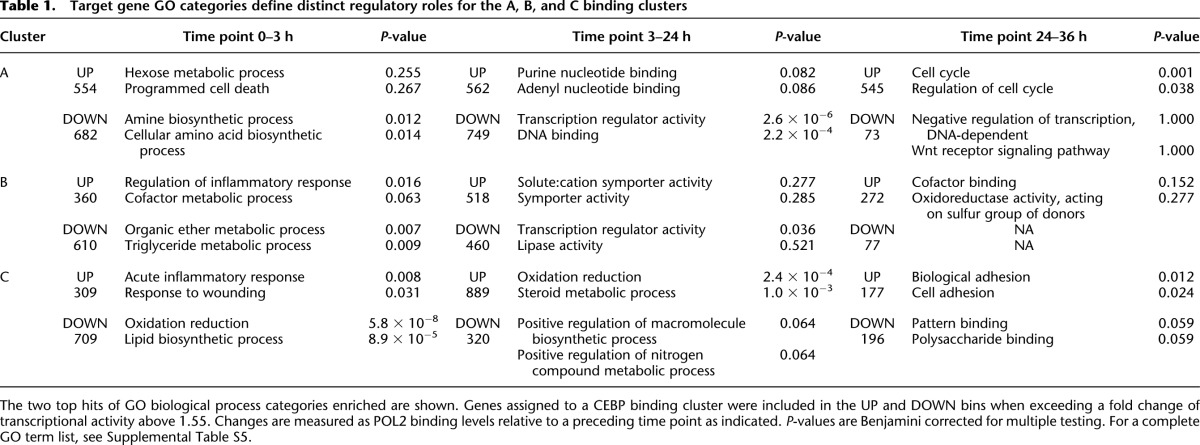
At the 0- to 3-h transition, the A cluster displays almost equal numbers of genes up- and down-regulated (554 vs. 682) (Table 1). In contrast, the B and C clusters showed mainly decreased target gene activity, with 610 and 709 down-regulated genes (63% and 70% of total regulated genes, respectively). The down-regulated genes associated with both B and C regions are annotated with lipid metabolism or oxidation-reduction terms, while the activated genes are associated with acute phase or inflammatory response. This shift of gene activity is expected, as the liver shifts from a quiescent, homeostatic state to an acute stage as a response to injury. By inspection of shared B and C target gene loci, we found several examples of B and C peaks in close proximity to each other. These often bind CEBPs at mutually exclusive time points, as exemplified in Figure 3B (lower panels). This observation suggests that CEBP complexes, possibly via interaction with specific co-activators or repressors at B or C regions, could have opposing actions on transcription, leading to timed fine-tuning of gene activity.
Prominent gene expression changes from 3 to 24 h include a significant down-regulation of A cluster genes with the term “transcriptional regulatory activity,” a shift that is paralleled by a decrease of A cluster CEBPA and CEBPB occupancy. This may suggest that the expression of these regulatory factors is dependent on CEBP binding. Another finding was the up-regulation of genes targeted by C cluster regulatory regions (889 of 1209 differentially expressed genes). Enriched C cluster GO terms were consistent with a resurge of homeostatic and metabolic gene activity before S-phase entry (Table 1). One notable example is Cps1, carbamoyl-phosphate synthetase 1, which encodes a rate-limiting enzyme in the urea-cycle (Jones 1965) and displays a pronounced up-regulation at the 24-h time point (Fig. 3B, upper left panel).
At the 36-h time point, the A cluster associated genes displayed a strong bias toward increased transcriptional activity, with 545 up-regulated against only 73 down-regulated, in contrast to the C group target genes with 177 up and 196 down. In the large set of up-regulated A cluster genes, we found a strong overrepresentation of cell cycle GO terms (Table 1). An example of a cell cycle regulator gene (Mdc1) targeted by an A cluster enhancer is shown in Figure 3 (Fig. 3B, upper right panel). The B cluster shows association with relatively few regulated genes at this time point (272 up and 77 down).
These data collectively show the three clusters to be associated with defined sets of genes with distinct biological functions and timing of expression.
Motif analysis identifies specific and mutually exclusive sets of regulatory code
The targeting of distinct sets of genes and the distinct binding patterns suggest the presence of divergent regulatory features in the regions constituting the three temporal clusters. Combinatorial binding of multiple TFs has been proposed to explain dynamic changes in occupancy and gene regulation during development (e.g., Zinzen et al. 2009).
To examine this possibility in our system, we carried out an analysis of the collective set of sequences of each binding cluster (A, B, or C) versus a background set. We counted instances of known TF cognate sequences to generate probability scores using the ASAP software (Marstrand et al. 2008). In order to attain comprehensive coverage with minimal redundancy, the analysis was performed using a condensate of three publicly available databases of TF binding sequences or position weight matrixes (PWMs) (Supplemental Methods; Supplemental Table S6). Probability Z-scores for all 246 condensed PWMs with representation above a threshold were used for hierarchical clustering to examine the general differences among the three clusters (Fig. 4A). Key examples are shown with full Z-score information (Fig. 4B).
Figure 4.

The CEBP temporal binding patterns display two sets of cis-regulatory code. (A) Representation of motif frequencies in each temporal cluster. Hierarchical clustering based on Z-scores of 210 position weight matrices (PWMs). Each row indicates a specific motif (PWM), while columns represent each binding cluster (A, B, or C). Color scale indicates representation relative to background set (overrepresented, dark blue; underrepresented, dark gray; no difference, white). Z-score scale is cut off at ±40 for clarity. Example PWMs are shown in black text. (B) Selected transcription factors with clear binding sequence overrepresentation in A and B clusters (upper six), all clusters (middle three), or only the C cluster (lower seven). Clusters are denoted by color. (C) Expression level frequency distribution (POL2 gene body read coverage) of all genes (reads per kilobase, sum of eight time points, normalized, above 0.5) with candidate transcription factors indicated. (D) Distances from A, B, and C cluster peak summits or random positions to the most proximal RefSeq transcription start site (TSS). (E) External ChIP-seq data peak regions (yellow bars) showing overlaps with CEBP A and C cluster regions (white numbers indicate proportions) and P-value of hypergeometric test (Fisher's one-tailed) of overlap similarity. (F) Sequential ChIP (reChIP) assessing co-occupancy at A and C cluster regions. Anti-CEBP was used as first-round antibody (recognizing both CEBPA and CEBPB), with second-round IgG or antibody against indicated TFs. Enrichments are normalized to IgG levels. N = 2–5. Error bars, SEM. (*) P < 0.05; (**) P < 0.01, t-test versus IgG enrichments. For gene names, see Supplemental Table S10.
As expected, we found CEBP motifs to be among the most enriched for all of the binding profile clusters (Fig. 4A,B; Supplemental Table S6). From the hierarchical clustering, it was evident that the majority of motifs found in the A set were shared with the B set, while a small group of motifs was found to have robust overrepresentation in all the three clusters (Fig. 4A). Prominent among these were motifs recognized by CREB and HNF4A (Fig. 4A,B), two TFs known to have a wide set of target genes in hepatocytes and central roles in liver metabolism and development (Costa et al. 2003; Montminy et al. 2004; Bolotin et al. 2010).
Notably, many motifs displayed a clear mutually exclusive pattern of overrepresentation (Fig. 4A). Specifically, many motifs found in the A and B clusters of cis-regulatory elements were underrepresented in the C cluster and vice versa. Binding sequences of the A and B regions belong to TFs related to stress response, proliferation, or cell cycle regulation, such as E2F, EGR1 and MYC (c-myc), the hypoxia response factor HIF1A, the metal response factor MTF1, and Kruppel-like factors (KLFs) (Fig. 4B; Supplemental Table S6; Lichtlen and Schaffner 2001; Blais and Dynlacht 2004; Liao et al. 2004; Eilers and Eisenman 2008; Majmundar et al. 2010; McConnell and Yang 2010; Zwang et al. 2011). The C regions, on the other hand, contain matches to PWMs of liver-specific TFs—such as FOXA2, ONECUT1 (previously known as HNF6), and HNF1A (Costa et al. 2003; Guillaumond et al. 2010)—or factors found to be associated with a quiescent state (G0), e.g., MAFB and FOXO3A (Greer and Brunet 2005; Sarrazin et al. 2009). Additionally, several different SOX motifs were identified as strongly overrepresented within this cluster (Fig. 4B; Supplemental Table S6).
Overall, these observations suggest significant differences in the regulatory mechanics of the A/B clusters versus the C cluster of putative cis-regulatory elements. Moreover, the data point to sets of specific, dynamic TF binding partners of CEBPs, defining a temporal regulatory code.
Multi-level support of temporal cis-regulatory code predictions
To assess if the TFs predicted to interact with A or C cluster regions are present in the liver, we examined their expression levels (POL2 gene body reads) against all genes (Fig. 4C; Supplemental Table S7). This revealed that the majority are highly expressed, being represented by either direct matches or top protein family members (e.g., Klf10, -13, -15 or Sox13, -15, -18). Strikingly, Cebpa, Cebpb, and Mafb are at the top of the list (rank positions of 107, 21, and 61, respectively).
We further examined the indicated differences of the three clusters by interrogating their genomic position relative to the nearest TSS (Fig. 4D). The three clusters clearly diverge in this respect, as the C cluster regions are distinct from A (or B) regions by showing no proximity to TSSs. Several studies have shown differences in preferred genomic positioning of TFs (e.g., Gerstein et al. 2012). This suggests, based solely on the genomic difference in position, that C cluster regions recruit other cobinding factors than the A (or B) regions. Specifically, E2Fs and MYC have been shown to bind at positions similar to the A regions, supporting the relevancy of enrichment for E2F and MYC cognate sequences in the A cluster (e.g., Eilers and Eisenman 2008).
Next, we took advantage of published mouse ChIP-seq data sets (Chen et al. 2008; Hoffman et al. 2010; Laudadio et al. 2012) to test if a panel of factors bound to A versus C regions as predicted by our computational analysis. We find our analysis to be supported as the E2F1, KLF4, and MYC factor bound regions overlap significantly more with A regions, while FOXA2 and ONECUT1 preferentially bind C regions (Fig. 4E; Supplemental Methods).
Finally, we tested co-occupancy of CEBPs and several putative cofactors by performing sequential ChIP (Methods). This shows that the factor E2F3 binds to the two A regions Slbp and Cbx5 simultaneously with CEBP factors, but none of the examined C regions, in accordance with our predictions. In contrast, the C cluster–associated factors ONECUT1, HNF1A, and MAFB interact with several C regions also occupied by CEBPs (Fig. 4F). Noticeably, a number of target regions are shared among the three C region factors.
Two modes of transcriptional regulation by EGR1
EGR1 has been shown to be essential for a timely regenerative response in the mouse liver (Liao et al. 2004) and represents a classical “immediate early TF,” which is up-regulated upon a growth stimulus (for review, see Thiel and Cibelli 2002). Recently, it was found to be part of a growth-signal discriminatory circuit together with TP53 (Zwang et al. 2011). Canonical EGR1 cognate sequences are among the most highly enriched in the “cell cycle” or “proliferation” set of CEBP bound regulatory regions (the A cluster), together with E2F and MYC motifs (Supplemental Table S6).
To investigate the role of EGR1 in liver regeneration in vivo, we performed ChIP-seq experiments with EGR1-specific antibodies at the 24- and 36-h time points. Unexpectedly, we observed a preference of EGR1 for the C set over the A set regions (Fig. 5A). Accordingly, A and EGR1 peak summits were generally positioned further apart than C and EGR1 peaks (Fig. 5B). Moreover, a GO analysis of putative target genes suggested that EGR1 may be involved in all aspects of liver regeneration, as acute phase genes, metabolic genes, and cell cycle genes are found proximal to EGR1 bound regions (Supplemental Table S9; data not shown).
Figure 5.

Two modes of EGR1 cobinding at A and C cluster regions. (A) Bar diagram displaying overlap between peaks defined by EGR1 binding (24 h or 36 h, yellow bars) and CEBP binding. A or C cluster CEBP peak overlaps are shown (white numbers indicate proportions) with P-values of hypergeometric tests (Fisher's one-tailed) of similarity. (B) Diagram showing the distribution of distances between CEBP peak summits and the closest EGR1 (36-h) peak. A (gray) and C (blue) cluster peaks and a randomly distributed set (dashed line) are included. (C) CEBP and EGR1 ChIP read coverage and PWM hit tracks from representative A (top panels) and C (bottom panels) cluster regions. Vertical red bars indicate CEBP and EGR1 PWM hits; height of bars identity score; and transparent black bars show position of peak summits. (D) EGR1-ChIP using livers of mice deficient for Cebpb and wild-type livers. (Y-axis) Ratio of enrichment for Cebpb-null versus wild-type experiments. EGR1 bound regions overlapping with CEPB A cluster (gray) and C cluster (blue) peaks are shown. N = 3–4. Error bars, SEM. (**) P < 0.01, Mann-Whitney test, two-tailed. For gene names, see Supplemental Table S10.
By manual inspection of tightly overlapping EGR1 and C regions bound by CEBPs, we found many peaks positioned precisely at a CEBP sequence but lacking EGR1 cognate sequence (Fig. 5C, bottom panels). Conversely, EGR1 peaks that possessed EGR1 cognate sequences did not overlap exactly with the CEBP peaks, and these peaks were consistently associated with A cluster regions (Fig. 5C, top panels). Sequences of target regions with positions of CEBP and EGR1 PWM hits and logos of used PWMs can be found in Supplemental Figure S5.
To test if EGR1 depends on CEBPs for interacting with DNA at C regions (lacking EGR1 sequences), we performed EGR1-specific ChIP with liver tissue from wild-type and Cebpb knockout mice. Our results show that EGR1 binding depends significantly more on CEBPB at C regions than at A regions, suggesting that EGR1 could bind DNA in two modes, indirectly (via CEBPs) at C regions and directly at A regions (Fig. 5D).
Differential sets of transcriptional regulators targeted by the three clusters of cis-regulatory regions
To further explore the transcriptional network of liver regeneration, we focused on the 120 most highly expressed CEBP target genes annotated with the “transcriptional regulator, DNA-dependent” GO term (Supplemental Table S8). These we represent as targets of either A, B, or C cluster regions or of any combination hereof (Fig. 6A).
Figure 6.

The A, B, and C cluster regions target distinct sets of transcriptional regulator encoding genes. (A) Regulatory network showing transcription factors targeted by CEBP-bound regions belonging to the A, B, or C clusters. The total number of connections (peaks associated with a gene) is indicated by color scale (white is one, and dark blue is 11, the maximum), and the relative, total expression (POL2 binding throughout the eight time points) is indicated by circle size. (B) CEBPB 3-h ChIP genomic coverage in the vicinity of three putative targets. Jun, Id2, and Egr1 loci display several CEBP peaks, i.e., “connections” in A. (C) Examples of putative feed-forward loops in the network. Arrows point from the transcription factor to the regulated gene. For clarity, the gene product level of CEBP targets has been left out. “A” and “C” are cis-regulatory elements belonging to the A or C cluster.
We find that the large majority of regulators (110 of 120) are targeted by either the A or B cluster regions, while the C cluster targets much fewer (38), suggesting a massive shift at the transcriptional network level upon transition from a quiescent to a regenerative state. Moreover, the injury response clusters (A/B) also impinge on many of the regulators targeted at the quiescent stage (29 of 38 bound by the C cluster), hinting at tight integration of the genetic programs at successive stages of the complex regenerative process.
A number of genes are associated with a high number of CEBP bound regions belonging to two or three clusters (Fig. 6A), suggesting a complex cis-regulatory structure. This may suggest that they are important components, or “hubs,” of the network. Prominent examples are the genes for the bHLH DNA-binding dominant repressor, ID2, as well as the cell cycle regulators JUN and EGR1 (Fig. 6A,B). Also Cebpa and Cebpb themselves are targets of multiple bound regions, as are Mafb, Hnf4a, and several Klf genes (Fig. 6A).
Several genes of regulatory factors are targeted by regions of which they may be coregulators based on the binding motif analysis (Figs. 4B, 6A). This can be interpreted as network feed-forward or auto-regulatory loops (Fig. 6C). Examples include genes encoding E2Fs and KLFs for the A and B cluster regions and FOX factors for the C regions. Hnf4a is a shared target of regions from all three clusters, and the HNF4A binding sequence is also enriched in all clusters (Fig. 6A; Supplemental Tables S6, S7). These regulatory loops may be involved in adding robustness to the network as suggested for other transcriptional hierarchies (Lee et al. 2002).
We detect the cholesterol Nr1h3 (also known as Lxr) and bile acid Nr1h4 (also known as Fxr) metabolism regulatory genes to be A and C cluster targets, respectively (Fig. 6A; Supplemental Table S8; Kalaany and Mangelsdorf 2006). We also find the gene encoding RXRA, the obligate binding partner of both TFs, to be targeted by multiple CEBP bound elements. This suggests that these factors may be interconnected with the CEBPs in regulation of cholesterol and bile metabolism during liver regeneration.
Finally, we note that almost all core members of the circadian clock system (Zhang and Kay 2010) turn out to be putative CEBP targets (Fig. 6A; Supplemental Table S8), e.g., the core TF genes Clock and Bmal1 (also known as Arntl), as well as the downstream effectors encoded by Per1/2/3 and Cry1/2, and secondary component genes Rora, Rorc, Nr1d2 (also known as Rev-erb beta), Dbp, and Nfil3 (also known as E4bp4). This points to a high level of cross-talk between circadian clock and regenerative response regulation.
Discussion
The multi-time point global quantification of TF occupancy enabled us to study the temporal dynamics of regulation in vivo. We find that the two central transcriptional regulators CEBPA and CEBPB interact with a large group of cis-regulatory elements in a highly dynamic manner through the progressive phases of liver regeneration. This group of genomic regions can be subdivided by CEBP binding dynamics into three clusters with distinctly enriched sets of sequence motifs, pointing to molecular mechanisms governing differential CEBP binding. Guided by this observation, we validate the predicted binding preference of several key cobinding TFs with sequential ChIP and published ChIP-seq data.
An important aspect of our study is the integration of observed TF binding dynamics and expression of putative target genes. We find that each of the three binding clusters is associated with distinct sets of regulated target genes, i.e., acute phase genes, metabolic/homeostatic genes, and cell cycle–related genes (Table 1). This demonstrates the possibility of linking dynamic TF occupancy patterns with the shifting phases of the regenerative program (Fig. 7A). Moreover, the concomitant resurge of CEBP binding to the C cluster regions and metabolic gene activity at 24 h provides evidence for a previously uncharacterized, early “homeostatic” phase of liver regeneration, taking place before the first round of replication.
Figure 7.

Protein level ratios of CEBPA versus CEBPB may define a dynamic transcriptional switch. (A) Schematic diagram showing the divergent binding patterns and biological roles of the A, B, and C cluster cis-regulatory elements through the first cell cycle of liver regeneration. A previously uncharacterized early resurge of metabolic/homeostatic genes, associated with C cluster regions with binding peaking at 24 h, was observed. (B) Model of a transcriptional switch centered on the relative ratio of CEBPA and CEBPB determining the composition of the CEBP complex pool (homo- or heterodimers). Gene activating or repressive actions are indicated, as well as sets of transcription factors found to be associated with A or C putative enhancers. Metabolic genes are induced and acute phase genes repressed by binding in a CEBPA-high setting (C regions), while the opposite is true for the CEBPB-high setting (B regions). A-type regions are only targeted by CEBPs when the CEBPB form is abundant.
The observed shifting phases of CEBP binding is closely temporally coupled to the dynamic ratio of CEBPA to CEBPB (Fig. 2C,D). One possible interpretation is that this ratio is involved in dictating enhancer occupancy by CEBP complexes. As such, a high ratio of CEBPA to CEBPB would lead to binding of C cluster cis-regulatory elements enhancing metabolic and repressing acute phase response genes. Conversely, a low ratio would direct binding of B cluster elements that repress metabolic or activate acute phase genes or of A cluster elements that activate cell cycle genes. This differential recruitment of CEBPs could be explained by interaction with distinct sets of TFs, depending on CEBP complex composition. This model is summarized in Figure 7B. Our observations and model contradict the conventional view that CEBPA levels are low while CEBPB levels are high throughout the regenerative process (Greenbaum et al. 1995, 1998), and emphasizes the requirement for a high degree of temporal resolution in studies of dynamic biological processes.
Many cognate sequences associated with TFs not previously known to be involved in liver regeneration were found to be overrepresented in the CEBP bound regions (Supplemental Table S6). In the C cluster regions, motifs of several SOX factors were abundant (Fig. 4B). Recent findings implicate SOX factors in hepatocyte differentiation and stem cell biology (Duan et al. 2010; Furuyama et al. 2011). Our data find Sox18, -13, and -15 to be highly expressed (Fig. 4C; Supplemental Table S7), but exactly which SOX factors cooperate with CEBPs in the liver remains to be determined. In the A cluster, we found overrepresented KLF factor motifs, and several highly expressed Klfs (e.g., Klf10, -13, and -15) are targets of CEBP A cluster enhancers (Figs. 4B,C, 6A; Supplemental Table S8). Liver functions were recently identified for KLF15 and KLF10 (Guillaumond et al. 2010; Takashima et al. 2010). Moreover, KLF factors are central for self-renewal programs in embryonic stem cells (Takahashi and Yamanaka 2006; Jiang et al. 2008), which suggests that they may play similar roles in the self-renewal circuitry of fully differentiated hepatocytes, very likely as both binding partners and targets of CEBPs.
An unexpected observation of this study was that EGR1 binding preferentially colocalizes with the C cluster regions (Fig. 5A), which are almost depleted of EGR1 cognate sequence (Fig. 4B; Supplemental Table S6). Our data support a model of indirect or “assisted” EGR1 binding to explain this observation (Fig. 5C,D). Only one example of indirect EGR1 binding via CEBPB has been published (Zhang et al. 2003), but our genome-wide observations indicate that EGR1 targeting of metabolic gene promoters (C cluster regions) via CEBPs could be a general phenomenon in the liver. EGR1 has also been found to be important for interpretation of mitogenic signals (Zwang et al. 2011) and targets A cluster regions in this study (Fig. 5A,D; Supplemental Table S9). Hence, the observed CEBPA-to-CEBPB shift in the CEBP pool could regulate EGR1 recruitment to A or C cluster cis-regulatory elements and thus ensure a tight temporal control of EGR1 action in line with the progressive phases of liver regeneration.
In essence, liver regeneration upon partial hepatectomy is compensatory growth, as the cells proliferating are fully differentiated hepatocytes. Previous studies have shown that liver regeneration does not involve loss of hepatocyte differentiation state (e.g., Malato et al. 2011; for reviews, see Fausto et al. 2006; Michalopoulos 2007). This is consistent with our finding that many hepatocyte-specific genes, e.g., involved in metabolic functions, are up-regulated rather than down-regulated. (Fig. 3B; Table 1). Only few examples are known of differentiated cells capable of hepatocyte-like “self-renewal” in the adult mammalian organism. It has recently been shown that the quiescence of naïve T cells is actively enforced by a balance between FOXP1 and FOXO1, allowing swift expansion upon external cues (Feng et al. 2011). Similarly, deficiency of just two TFs lends long-term, nontumorigenic expansion capacity to mature macrophages (Aziz et al. 2009). These two factors are MAF (c-maf) and MAFB, both of which we find to be putative CEBP targets in the liver (Fig. 6A; Supplemental Table S8). MAFB is among the most highly expressed TFs in the quiescent condition and is strongly down-regulated from the 8-h time point (Supplemental Tables S4, S8). Furthermore, we find MAFB and MAFK binding sequences enriched in the quiescence/metabolism-associated C cluster of enhancers, predominantly bound by CEBPs at the 0- and 24-h time points. In the proliferation-associated A cluster, we find KLF and MYC sequences (Fig. 4B; Supplemental Table S6); KLF4 and MYC were demonstrated to be required for expansion of the differentiated macrophages (Aziz et al. 2009). Moreover, CEBPA is a key determinant of macrophage as well as liver cell differentiation (e.g., Feng et al. 2008). These observations may suggest that similar transcriptional networks centered on a CEBP/MAF axis are enforcing quiescence in both fully differentiated hepatocytes and macrophages. Understanding this circuitry has the potential to be of use in regenerative medicine as a step toward manipulation of hepatocytes or other fully differentiated cells for therapeutic purposes.
In conclusion, the present work shows how time-resolved analysis of two core TFs of liver regeneration can reveal specific aspects of the regulation operating at distinct phases during the process. In a broader sense, our approach of analyzing dynamic TF occupancy globally in vivo should be applicable to other experimental systems and holds promise to aid in the elucidation of complex transcriptional networks in higher vertebrates.
Methods
Mouse work
The partial hepatectomy was performed on wild-type mice (C57BL6/J, male, 7 wk old) by removing three of five liver lobes according to the method described earlier (Thoren et al. 2010). Mice were culled after varying amounts of time covering the regrowth phase of liver regeneration (0, 3, 8, 16, 24, 36, 48, and 168 h) (Fig. 1A,B). Livers from five individual mice for each time point were harvested, generating 40 samples; directly snap-frozen in liquid nitrogen; and stored at −80°C. Animal experiments conformed to institutional as well as Danish national guidelines.
Chromatin immunoprecipitation
After thawing, tissue samples were homogenized by douncing (loose pestle, Wheaton 15-mL douncer) in cold PBS, and were cross-linked for 10 min in 1% formaldehyde using a rotator. Chromatin was fragmented by sonication (Bioruptor, Diagenode). The 40 samples were used in ChIP-seq experiments with antibodies against CEBPA, CEBPB, EGR1 (Santa Cruz: sc-61, sc-150, sc-110x), RNA-POL2 subunit B1 antibody (AC-055-100, Diagenode), and Mock IgG (Sigma I8140). ChIP was performed according to the method described earlier (Sandmann et al. 2006a). Sequential ChIP was done according to the method described previously (Truax and Greer 2012), with the modification of cross-linking antibody–Protein A beads (www.neb.com). Santa Cruz antibodies as above were used for sequential CEBPA-CEBPB ChIP (Supplemental Fig. S6). An in-house CEBP antibody (JSJ#1052) recognizing both CEBPA and CEBPB was used in the first round in sequential ChIP with antibodies against ONECUT1 (HNF6), HNF1A, E2F3, MAFB, or IgG for the second round (Santa Cruz: sc-13050x, sc-8986x, sc-878x; Novus Bio: nb600-266). All sequential ChIP enrichments were normalized to IgG ratios. Enrichment was validated by qPCR (ABI Prism 7000 or Roche Lightcycler 480), using ratios of a positive detector primer set versus a negative (Mamstr, Chr_12_desert1 or Sfi2). All primer sets are listed in Supplemental Table S10.
Clustering of CEBPA and CEBPB peaks
Consensus regions for CEBPA and CEBPB peaks for all time points were defined by merging overlapping regions between sets, requiring a called peak in at least one sample, producing a total of 87,049 consensus regions. Subsequently, coverage, defined as the maximal coverage level for each region, was determined using the normalized counts (Supplemental Material). Filtering was applied, requiring normalized coverage of a minimum of 50 reads in at least one sample for any given region, reducing the set to 11,314. Hierarchical clustering was performed in MeV (http://www.tm4.org/mev/) (Saeed et al. 2006), and three predominant clusters were identified: A (3449 regions), B (2818), and C (3034). The remaining 2013 regions were excluded from further analysis. Coverage reads were summed for each time point/cluster, normalized, and used for displaying sum coverage tracks (Fig. 2B). Consensus region coverage data can be found in Supplemental Table S3.
Data access
The timeseries ChIP-seq data generated for this work have been deposited in the NCBI Gene Expression Omnibus (GEO) (http://www.ncbi.nlm.nih.gov/geo/) and are accessible through GEO Series accession number GSE42321.
Acknowledgments
We thank Claus Nerlov and Agnes Zay for Cebpb knockout mouse livers, Mie Poulsen and Bjørg Krog for expert help in performing the partial hepatectomy, and Thomas Sandmann, Federico De Masi, and members of the Porse laboratory for critical reading of the manuscript. This study was supported by grants from The Novo Foundation and the Danish Cancer Society.
Footnotes
[Supplemental material is available for this article.]
Article published online before print. Article, supplemental material, and publication date are at http://www.genome.org/cgi/doi/10.1101/gr.146399.112.
References
- Aziz A, Soucie E, Sarrazin S, Sieweke MH 2009. MafB/c-Maf deficiency enables self-renewal of differentiated functional macrophages. Science 326: 867–871 [DOI] [PubMed] [Google Scholar]
- Blais A, Dynlacht BD 2004. Hitting their targets: An emerging picture of E2F and cell cycle control. Curr Opin Genet Dev 14: 527–532 [DOI] [PubMed] [Google Scholar]
- Bolotin E, Liao H, Ta TC, Yang C, Hwang-Verslues W, Evans JR, Jiang T, Sladek FM 2010. Integrated approach for the identification of human hepatocyte nuclear factor 4α target genes using protein binding microarrays. Hepatology 51: 642–653 [DOI] [PMC free article] [PubMed] [Google Scholar]
- Chen X, Xu H, Yuan P, Fang F, Huss M, Vega VB, Wong E, Orlov YL, Zhang W, Jiang J, et al. 2008. Integration of external signaling pathways with the core transcriptional network in embryonic stem cells. Cell 133: 1106–1117 [DOI] [PubMed] [Google Scholar]
- Costa RH, Kalinichenko VV, Holterman AX, Wang X 2003. Transcription factors in liver development, differentiation, and regeneration. Hepatology 38: 1331–1347 [DOI] [PubMed] [Google Scholar]
- Diehl AM, Yang SQ 1994. Regenerative changes in C/EBPα and C/EBPβ expression modulate binding to the C/EBP site in the c-fos promoter. Hepatology 19: 447–456 [PubMed] [Google Scholar]
- Duan Y, Ma X, Zou W, Wang C, Bahbahan IS, Ahuja TP, Tolstikov V, Zern MA 2010. Differentiation and characterization of metabolically functioning hepatocytes from human embryonic stem cells. Stem Cells 28: 674–686 [DOI] [PubMed] [Google Scholar]
- Eilers M, Eisenman RN 2008. Myc's broad reach. Genes Dev 22: 2755–2766 [DOI] [PMC free article] [PubMed] [Google Scholar]
- Fausto N, Campbell JS, Riehle KJ 2006. Liver regeneration. Hepatology 43: S45–S53 [DOI] [PubMed] [Google Scholar]
- Feng R, Desbordes SC, Xie H, Tillo ES, Pixley F, Stanley ER, Graf T 2008. PU.1 and C/EBPα/β convert fibroblasts into macrophage-like cells. Proc Natl Acad Sci 105: 6057–6062 [DOI] [PMC free article] [PubMed] [Google Scholar]
- Feng X, Wang H, Takata H, Day TJ, Willen J, Hu H 2011. Transcription factor Foxp1 exerts essential cell-intrinsic regulation of the quiescence of naive T cells. Nat Immunol 12: 544–550 [DOI] [PMC free article] [PubMed] [Google Scholar]
- Furuyama K, Kawaguchi Y, Akiyama H, Horiguchi M, Kodama S, Kuhara T, Hosokawa S, Elbahrawy A, Soeda T, Koizumi M, et al. 2011. Continuous cell supply from a Sox9-expressing progenitor zone in adult liver, exocrine pancreas and intestine. Nat Genet 43: 34–41 [DOI] [PubMed] [Google Scholar]
- Gerstein MB, Kundaje A, Hariharan M, Landt SG, Yan KK, Cheng C, Mu XJ, Khurana E, Rozowsky J, Alexander R, et al. 2012. Architecture of the human regulatory network derived from ENCODE data. Nature 489: 91–100 [DOI] [PMC free article] [PubMed] [Google Scholar]
- Glynne R, Ghandour G, Rayner J, Mack DH, Goodnow CC 2000. B-lymphocyte quiescence, tolerance and activation as viewed by global gene expression profiling on microarrays. Immunol Rev 176: 216–246 [DOI] [PubMed] [Google Scholar]
- Greenbaum LE, Cressman DE, Haber BA, Taub R 1995. Coexistence of C/EBPα, β, growth-induced proteins and DNA synthesis in hepatocytes during liver regeneration. Implications for maintenance of the differentiated state during liver growth. J Clin Invest 96: 1351–1365 [DOI] [PMC free article] [PubMed] [Google Scholar]
- Greenbaum LE, Li W, Cressman DE, Peng Y, Ciliberto G, Poli V, Taub R 1998. CCAAT enhancer-binding protein β is required for normal hepatocyte proliferation in mice after partial hepatectomy. J Clin Invest 102: 996–1007 [DOI] [PMC free article] [PubMed] [Google Scholar]
- Greer EL, Brunet A 2005. FOXO transcription factors at the interface between longevity and tumor suppression. Oncogene 24: 7410–7425 [DOI] [PubMed] [Google Scholar]
- Guillaumond F, Grechez-Cassiau A, Subramaniam M, Brangolo S, Peteri-Brunback B, Staels B, Fievet C, Spelsberg TC, Delaunay F, Teboul M 2010. Kruppel-like factor KLF10 is a link between the circadian clock and metabolism in liver. Mol Cell Biol 30: 3059–3070 [DOI] [PMC free article] [PubMed] [Google Scholar]
- Hoffman BG, Robertson G, Zavaglia B, Beach M, Cullum R, Lee S, Soukhatcheva G, Li L, Wederell ED, Thiessen N, et al. 2010. Locus co-occupancy, nucleosome positioning, and H3K4me1 regulate the functionality of FOXA2-, HNF4A-, and PDX1-bound loci in islets and liver. Genome Res 20: 1037–1051 [DOI] [PMC free article] [PubMed] [Google Scholar]
- Huang da W, Sherman BT, Lempicki RA 2009. Systematic and integrative analysis of large gene lists using DAVID bioinformatics resources. Nat Protoc 4: 44–57 [DOI] [PubMed] [Google Scholar]
- Jakobsen JS, Braun M, Astorga J, Gustafson EH, Sandmann T, Karzynski M, Carlsson P, Furlong EE 2007. Temporal ChIP-on-chip reveals Biniou as a universal regulator of the visceral muscle transcriptional network. Genes Dev 21: 2448–2460 [DOI] [PMC free article] [PubMed] [Google Scholar]
- Jiang J, Chan YS, Loh YH, Cai J, Tong GQ, Lim CA, Robson P, Zhong S, Ng HH 2008. A core Klf circuitry regulates self-renewal of embryonic stem cells. Nat Cell Biol 10: 353–360 [DOI] [PubMed] [Google Scholar]
- Johnson DS, Mortazavi A, Myers RM, Wold B 2007. Genome-wide mapping of in vivo protein-DNA interactions. Science 316: 1497–1502 [DOI] [PubMed] [Google Scholar]
- Jones ME 1965. Amino acid metabolism. Annu Rev Biochem 34: 381–418 [DOI] [PubMed] [Google Scholar]
- Kalaany NY, Mangelsdorf DJ 2006. LXRS and FXR: The yin and yang of cholesterol and fat metabolism. Annu Rev Physiol 68: 159–191 [DOI] [PubMed] [Google Scholar]
- Kurinna S, Barton MC 2011. Cascades of transcription regulation during liver regeneration. Int J Biochem Cell Biol 43: 189–197 [DOI] [PMC free article] [PubMed] [Google Scholar]
- Laudadio I, Manfroid I, Achouri Y, Schmidt D, Wilson MD, Cordi S, Thorrez L, Knoops L, Jacquemin P, Schuit F, et al. 2012. A feedback loop between the liver-enriched transcription factor network and miR-122 controls hepatocyte differentiation. Gastroenterology 142: 119–129 [DOI] [PubMed] [Google Scholar]
- Lee TI, Rinaldi NJ, Robert F, Odom DT, Bar-Joseph Z, Gerber GK, Hannett NM, Harbison CT, Thompson CM, Simon I, et al. 2002. Transcriptional regulatory networks in Saccharomyces cerevisiae. Science 298: 799–804 [DOI] [PubMed] [Google Scholar]
- Liao Y, Shikapwashya ON, Shteyer E, Dieckgraefe BK, Hruz PW, Rudnick DA 2004. Delayed hepatocellular mitotic progression and impaired liver regeneration in early growth response-1-deficient mice. J Biol Chem 279: 43107–43116 [DOI] [PubMed] [Google Scholar]
- Lichtlen P, Schaffner W 2001. Putting its fingers on stressful situations: The heavy metal-regulatory transcription factor MTF-1. Bioessays 23: 1010–1017 [DOI] [PubMed] [Google Scholar]
- Lopez RG, Garcia-Silva S, Moore SJ, Bereshchenko O, Martinez-Cruz AB, Ermakova O, Kurz E, Paramio JM, Nerlov C 2009. C/EBPα and β couple interfollicular keratinocyte proliferation arrest to commitment and terminal differentiation. Nat Cell Biol 11: 1181–1190 [DOI] [PubMed] [Google Scholar]
- Majmundar AJ, Wong WJ, Simon MC 2010. Hypoxia-inducible factors and the response to hypoxic stress. Mol Cell 40: 294–309 [DOI] [PMC free article] [PubMed] [Google Scholar]
- Malato Y, Naqvi S, Schurmann N, Ng R, Wang B, Zape J, Kay MA, Grimm D, Willenbring H 2011. Fate tracing of mature hepatocytes in mouse liver homeostasis and regeneration. J Clin Invest 121: 4850–4860 [DOI] [PMC free article] [PubMed] [Google Scholar]
- Marstrand TT, Frellsen J, Moltke I, Thiim M, Valen E, Retelska D, Krogh A 2008. Asap: A framework for over-representation statistics for transcription factor binding sites. PLoS One 3: e1623. [DOI] [PMC free article] [PubMed] [Google Scholar]
- Matsuo T, Yamaguchi S, Mitsui S, Emi A, Shimoda F, Okamura H 2003. Control mechanism of the circadian clock for timing of cell division in vivo. Science 302: 255–259 [DOI] [PubMed] [Google Scholar]
- McConnell BB, Yang VW 2010. Mammalian Kruppel-like factors in health and diseases. Physiol Rev 90: 1337–1381 [DOI] [PMC free article] [PubMed] [Google Scholar]
- Michalopoulos GK 2007. Liver regeneration. J Cell Physiol 213: 286–300 [DOI] [PMC free article] [PubMed] [Google Scholar]
- Montminy M, Koo SH, Zhang X 2004. The CREB family: Key regulators of hepatic metabolism. Ann Endocrinol 65: 73–75 [DOI] [PubMed] [Google Scholar]
- Nerlov C 2007. The C/EBP family of transcription factors: A paradigm for interaction between gene expression and proliferation control. Trends Cell Biol 17: 318–324 [DOI] [PubMed] [Google Scholar]
- Ni L, Bruce C, Hart C, Leigh-Bell J, Gelperin D, Umansky L, Gerstein MB, Snyder M 2009. Dynamic and complex transcription factor binding during an inducible response in yeast. Genes Dev 23: 1351–1363 [DOI] [PMC free article] [PubMed] [Google Scholar]
- Osada S, Yamamoto H, Nishihara T, Imagawa M 1996. DNA binding specificity of the CCAAT/enhancer-binding protein transcription factor family. J Biol Chem 271: 3891–3896 [DOI] [PubMed] [Google Scholar]
- Overturf K, al-Dhalimy M, Ou CN, Finegold M, Grompe M 1997. Serial transplantation reveals the stem-cell-like regenerative potential of adult mouse hepatocytes. Am J Pathol 151: 1273–1280 [PMC free article] [PubMed] [Google Scholar]
- Porse BT, Pedersen TA, Xu X, Lindberg B, Wewer UM, Friis-Hansen L, Nerlov C 2001. E2F repression by C/EBPα is required for adipogenesis and granulopoiesis in vivo. Cell 107: 247–258 [DOI] [PubMed] [Google Scholar]
- Rana B, Xie Y, Mischoulon D, Bucher NL, Farmer SR 1995. The DNA binding activity of C/EBP transcription factor is regulated in the G1 phase of the hepatocyte cell cycle. J Biol Chem 270: 18123–18132 [DOI] [PubMed] [Google Scholar]
- Saeed AI, Bhagabati NK, Braisted JC, Liang W, Sharov V, Howe EA, Li J, Thiagarajan M, White JA, Quackenbush J 2006. TM4 microarray software suite. Methods Enzymol 411: 134–193 [DOI] [PubMed] [Google Scholar]
- Sandmann T, Jakobsen JS, Furlong EE 2006a. ChIP-on-chip protocol for genome-wide analysis of transcription factor binding in Drosophila melanogaster embryos. Nat Protoc 1: 2839–2855 [DOI] [PubMed] [Google Scholar]
- Sandmann T, Jensen LJ, Jakobsen JS, Karzynski MM, Eichenlaub MP, Bork P, Furlong EE 2006b. A temporal map of transcription factor activity: mef2 directly regulates target genes at all stages of muscle development. Dev Cell 10: 797–807 [DOI] [PubMed] [Google Scholar]
- Sandoval J, Rodriguez JL, Tur G, Serviddio G, Pereda J, Boukaba A, Sastre J, Torres L, Franco L, Lopez-Rodas G 2004. RNAPol-ChIP: A novel application of chromatin immunoprecipitation to the analysis of real-time gene transcription. Nucleic Acids Res 32: e88. [DOI] [PMC free article] [PubMed] [Google Scholar]
- Sarrazin S, Mossadegh-Keller N, Fukao T, Aziz A, Mourcin F, Vanhille L, Kelly Modis L, Kastner P, Chan S, Duprez E, et al. 2009. MafB restricts M-CSF-dependent myeloid commitment divisions of hematopoietic stem cells. Cell 138: 300–313 [DOI] [PubMed] [Google Scholar]
- Takahashi K, Yamanaka S 2006. Induction of pluripotent stem cells from mouse embryonic and adult fibroblast cultures by defined factors. Cell 126: 663–676 [DOI] [PubMed] [Google Scholar]
- Takashima M, Ogawa W, Hayashi K, Inoue H, Kinoshita S, Okamoto Y, Sakaue H, Wataoka Y, Emi A, Senga Y, et al. 2010. Role of KLF15 in regulation of hepatic gluconeogenesis and metformin action. Diabetes 59: 1608–1615 [DOI] [PMC free article] [PubMed] [Google Scholar]
- Thiel G, Cibelli G 2002. Regulation of life and death by the zinc finger transcription factor Egr-1. J Cell Physiol 193: 287–292 [DOI] [PubMed] [Google Scholar]
- Thoren LA, Norgaard GA, Weischenfeldt J, Waage J, Jakobsen JS, Damgaard I, Bergstrom FC, Blom AM, Borup R, Bisgaard HC, et al. 2010. UPF2 is a critical regulator of liver development, function and regeneration. PLoS ONE 5: e11650. [DOI] [PMC free article] [PubMed] [Google Scholar]
- Truax AD, Greer SF 2012. ChIP and Re-ChIP assays: Investigating interactions between regulatory proteins, histone modifications, and the DNA sequences to which they bind. Methods Mol Biol 809: 175–188 [DOI] [PubMed] [Google Scholar]
- van Wageningen S, Kemmeren P, Lijnzaad P, Margaritis T, Benschop JJ, de Castro IJ, van Leenen D, Groot Koerkamp MJ, Ko CW, Miles AJ, et al. 2010. Functional overlap and regulatory links shape genetic interactions between signaling pathways. Cell 143: 991–1004 [DOI] [PMC free article] [PubMed] [Google Scholar]
- Vogel MJ, Peric-Hupkes D, van Steensel B 2007. Detection of in vivo protein-DNA interactions using DamID in mammalian cells. Nat Protoc 2: 1467–1478 [DOI] [PubMed] [Google Scholar]
- Wang ND, Finegold MJ, Bradley A, Ou CN, Abdelsayed SV, Wilde MD, Taylor LR, Wilson DR, Darlington GJ 1995. Impaired energy homeostasis in C/EBPα knockout mice. Science 269: 1108–1112 [DOI] [PubMed] [Google Scholar]
- White P, Brestelli JE, Kaestner KH, Greenbaum LE 2005. Identification of transcriptional networks during liver regeneration. J Biol Chem 280: 3715–3722 [DOI] [PubMed] [Google Scholar]
- Yusuf I, Fruman DA 2003. Regulation of quiescence in lymphocytes. Trends Immunol 24: 380–386 [DOI] [PubMed] [Google Scholar]
- Zhang EE, Kay SA 2010. Clocks not winding down: Unravelling circadian networks. Nat Rev Mol Cell Biol 11: 764–776 [DOI] [PubMed] [Google Scholar]
- Zhang F, Lin M, Abidi P, Thiel G, Liu J 2003. Specific interaction of Egr1 and c/EBPβ leads to the transcriptional activation of the human low density lipoprotein receptor gene. J Biol Chem 278: 44246–44254 [DOI] [PubMed] [Google Scholar]
- Zinzen RP, Girardot C, Gagneur J, Braun M, Furlong EE 2009. Combinatorial binding predicts spatio-temporal cis-regulatory activity. Nature 462: 65–70 [DOI] [PubMed] [Google Scholar]
- Zwang Y, Sas-Chen A, Drier Y, Shay T, Avraham R, Lauriola M, Shema E, Lidor-Nili E, Jacob-Hirsch J, Amariglio N, et al. 2011. Two phases of mitogenic signaling unveil roles for p53 and EGR1 in elimination of inconsistent growth signals. Mol Cell 42: 524–535 [DOI] [PMC free article] [PubMed] [Google Scholar]