

Abstract
Most of what is presently known about how miRNAs regulate gene expression comes from studies that characterized the regulatory effect of miRNA binding sites located in the 3′ untranslated regions (UTR) of mRNAs. In recent years, there has been increasing evidence that miRNAs also bind in the coding region (CDS), but the implication of these interactions remains obscure because they have a smaller impact on mRNA stability compared with miRNA-target interactions that involve 3′ UTRs. Here we show that miRNA-complementary sites that are located in both CDS and 3′-UTRs are under selection pressure and share the same sequence and structure properties. Analyzing recently published data of ribosome-protected fragment profiles upon miRNA transfection from the perspective of the location of miRNA-complementary sites, we find that sites located in the CDS are most potent in inhibiting translation, while sites located in the 3′ UTR are more efficient at triggering mRNA degradation. Our study suggests that miRNAs may combine targeting of CDS and 3′ UTR to flexibly tune the time scale and magnitude of their post-transcriptional regulatory effects.
MicroRNAs (miRNAs) are ∼21 nt (nucleotide)-long regulatory RNAs that are encoded in the genomes of species ranging from viruses to human. They form miRNA-induced silencing complexes (miRISCs) with Argonaute proteins which they guide, through hybridization, to target mRNAs whose expression is subsequently down-regulated (Bushati and Cohen 2007; Bartel 2009). In plants, miRNAs typically trigger the endonucleolytic cleavage of their targets through perfect or near-perfect complementarity interactions with transcript coding regions (CDS) (Jones-Rhoades et al. 2006). In contrast, in mammals they have been shown to interact predominantly through their “seed region” (nucleotides 2–8 from the 5′ end of the miRNA) with 3′ untranslated regions (3′ UTRs) of mRNAs (Lewis et al. 2005), inducing their destabilization and translational inhibition (Filipowicz et al. 2008). In recent years, the distinction between the mode of action of plant and animal miRNAs has become less clear. There is growing evidence that plant miRNAs can induce translational repression via imperfect complementarity interactions with target sites in CDS and 3′ UTRs (Brodersen et al. 2008; Lanet et al. 2009). Likewise, increasingly many miRNA target sites are discovered in coding regions of mammalian transcripts (Forman et al. 2008; Huang et al. 2010; Qin et al. 2010; Ott et al. 2011). Application of high-throughput approaches for isolating Argonaute-bound target sites indicates that CDS sites are as numerous as those located in 3′ UTRs (Chi et al. 2009; Hafner et al. 2010), though the density of Argonaute-bound sites is higher in 3′ UTR compared with CDS (Hafner et al. 2010).
If CDS sites are as common as Argonaute cross-linking and immunoprecipitation (CLIP) studies indicate (Chi et al. 2009; Hafner et al. 2010), one wonders why there are relatively few reports on their involvement in gene regulation and why the studies that have been so far published suggest that CDS sites are much less effective in down-regulating mRNA levels upon miRNA transfection (Baek et al. 2008; Hafner et al. 2010; Fang and Rajewsky 2011; Schnall-Levin et al. 2011). A reason may be that CDS sites function in specific contexts, in which coding regions are accessible to the miRNA-loaded silencing complex, while under normal conditions the process of translation hinders miRNA binding to these sites (Bartel 2009; Gu et al. 2009). Alternatively, it may be that only a specific subset of miRNAs targets coding regions. For instance, it has recently been found that hsa-miR-181a targets multiple members of the C2H2 zinc finger domain family, through multiple CDS sites that occur precisely in the regions of the transcripts that encode the C2H2 domains (Schnall-Levin et al. 2011). However, the CDS sites that have been isolated in CLIP experiments do not seem to correspond to a restricted subset of miRNAs, and they also did not require that the cells were treated in some specific way to expose the use of CDS sites. Thus, none of the hypotheses mentioned above can explain the discrepancy between the apparent abundance of CDS sites and the paucity of reports about their function.
Evolutionary conservation has been successfully employed to predict regulatory elements, including binding sites for miRNAs in 3′ UTRs (Krek et al. 2005; Lewis et al. 2005; Gaidatzis et al. 2007). Hurst (2006) used a limited experimentally verified data set that was available at the time to demonstrate that miRNA target sites located in coding regions exhibit significantly low evolutionary rates in mammals. Evolutionary conservation-based approaches to predict miRNA target sites in coding regions followed. Forman et al. (2008) used alignments of CDS regions in 17 species to identify conserved miRNA-complementary sites in 700 human genes. Among the miRNAs with the most predicted CDS sites were hsa-let-7a-5p, hsa-miR-9-5p, hsa-miR-125a-5p, and hsa-miR-153. These authors further demonstrated experimentally that hsa-let-7b-5p down-regulates the miRNA-processing enzyme Dicer, whose transcript carries multiple complementarities to let-7 in its coding region. Schnall-Levin et al. (2010) allowed for the possibility that sites are not perfectly conserved among “all” genomes used in the inference to show that miRNA targeting in CDS is as common as in the 3′ UTRs in Drosophila species. They further predicted 26,000 and 14,000 sites in human 3′ UTR and CDS regions, respectively. Finally, Fang and Rajewsky (2011) found evidence that mRNAs that are simultaneously targeted in the CDS and in the 3′ UTR are slightly more destabilized than mRNA targeted only in the 3′ UTR, while Schnall-Levin et al. (2011) showed that mRNAs with several miRNA binding sites in the CDS can effectively be degraded.
In the present study we analyzed putative miRNA target sites that are located in coding regions, with the aim of uncovering the function of such sites by comparison with sites that are located in 3′ UTRs. The target sites that we used in our analysis were either predicted computationally or inferred on the basis of transcript- or protein-level changes following miRNA transfections. Our results indicate that CDS and 3′ UTR target sites co-evolved, have similar sequence and structure properties, and may have similar efficiency in inducing translational repression of the transcripts in which they reside. On the other hand, sites located in 3′ UTR are much more effective at inducing mRNA degradation, as reported before (Baek et al. 2008; Guo et al. 2010; Hafner et al. 2010; Fang and Rajewsky 2011).
Results
Both CDS and 3′ UTR sites are under evolutionary selection
The application of the ElMMo model to miRNA target prediction in 3′ UTRs was described before (Gaidatzis et al. 2007) and recent assessments indicate that ElMMo is among the most accurate miRNA target prediction methods available (Alexiou et al. 2009; Hafner et al. 2010; Sturm et al. 2010). ElMMo is parameter-free and, by building its background model from the appropriate type of regions, it can in principle predict miRNA target sites in transcript or genomic regions that do not correspond to 3′ UTRs. Here we applied ElMMo to predict miRNA target sites in coding regions. To determine whether the ElMMo-predicted CDS sites are functional we analyzed eight published data sets (listed in Table 1) that compared mRNA expression before and after transfections of individual miRNAs. In each of these experiments, we identified all mRNAs that carried precisely one 2–8 seed match to the transfected miRNA, and we selected 250 transcripts that were most down-regulated and 250 that responded least to transfection. We separated each of these sets in two subsets: transcripts in which the site was located in the CDS, and transcripts in which the site was located in the 3′ UTR. We then computed the t-values comparing the ElMMo scores of the sites that induced an effect with those that did not induce an effect and we computed the overall t-value over the data sets. As Figure 1A (and Supplemental Fig. 1) shows, both CDS and 3′ UTR sites that are located in down-regulated transcripts have a higher probability to be under selection compared with sites that are located in transcripts that do not respond to transfection. We further asked whether miRNA-complementary sites that are isolated in Argonaute CLIP experiments also have higher ElMMo scores compared with those that are not isolated (Fig. 1A). We used the Argonaute CLIP data of Kishore et al. (2011) (Table 1) and identified all matches to the 2–8 seed of the top 10 expressed miRNA families in transcripts from which CLIP reads were obtained. In principle, these transcripts were expressed and bound by Argonaute proteins, so the transfected miRNAs should have had access to all seed-matching sites in these transcripts. We separated the set of seed matches into those that were the most enriched in CLIP and those that were least enriched in CLIP and compared the distributions of ElMMo scores of the two subsets of sites. As shown in Figure 1A (and Supplemental Fig. 1), we found that CLIPed CDS sites had a significantly higher score compared with non-CLIPed sites. These results indicate that ElMMo predicts functional sites not only in 3′ UTRs but also in CDSs.
Table 1.
The data sets that we used to identify properties of functional miRNA binding sites in the 3′ UTR and in the CDS
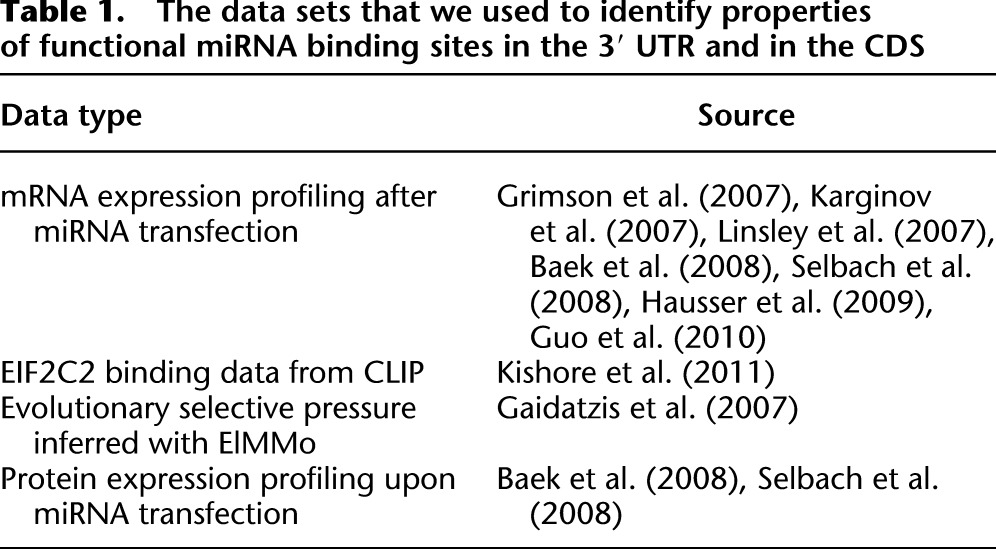
Figure 1.

(A) CDS- and 3′ UTR-located miRNA binding sites that induce mRNA degradation or are isolated in EIF2C2 CLIP experiments are under stronger selection pressure compared with miRNA-complementary sites that were not functional in these experiments; 2274 CDS- and 3956 3′ UTR-located sites that induce mRNA degradation are compared with 3513 CDS- and 3268 3′ UTR-located sites that do not induce mRNA degradation; 751 CDS- and 786 3′ UTR-located sites isolated in EIF2C2 CLIP experiments are compared with 1059 CDS- and 956 3′ UTR-located sites that do not induce EIF2C2 binding. (B) Scatter plot of the inferred probabilities that CDS- and 3′ UTR-located sites complementary to individual miRNAs are under selection. (Dashed red line) First principal component of the scatter.
ElMMo further estimates a miRNA-specific probability that a site that is complementary to the miRNA in the reference species (in this case human) is under selection in at least one other species taken into account in the miRNA target prediction. Here we used genome sequence data of the species Pan troglodytes, Rhesus maccacus, Canis familiaris, Rattus norvegicus, Mus musculus, Bos taurus, Monodelphis domestica, and Gallus gallus to predict sites that are under evolutionary selection. This probability is high when the miRNA-complementary motifs are strongly conserved and low when they are weakly conserved across species, relative to motifs that are not complementary to miRNAs. As shown in Figure 1B, the probabilities of miRNA-complementary sites to be under selection pressure are strongly correlated between CDS- and 3′ UTR-located sites of individual miRNAs (r = 0.77). For comparison, we estimated the average phastCons conservation score (Siepel et al. 2005) for CDS and 3′ UTR occurrences of individual motifs, and found a similar but weaker correlation (Supplemental Fig. 8). Further supporting the functionality of miRNA-complementary sites located in both CDS and 3′ UTR, the phastCons scores of these motifs are significantly higher compared with those of other 7mers in both types of regions (Supplemental Fig. 8). These results suggest that CDS and 3′ UTR sites evolve in parallel and that CDS sites must have a function that confers a selective advantage in evolution.
miRNAs that function in embryonic development co-target the 3′ UTR and the CDS
The proportion of miRNA-complementary sites estimated to be under evolutionary selection in CDS as opposed to 3′ UTRs differs between miRNAs (Fig. 2A). We found that this is due to a combination of factors. First, the sequence composition of CDS and 3′ UTR differ, with the result that some motifs are more abundant in CDS and others in 3′ UTR (Supplemental Fig. 9). Additionally, the relative lengths of CDS and 3′ UTR of the targeted transcripts and the relative selection pressure on miRNA-complementary motifs in the two types of regions (Supplemental Fig. 10) also contribute to preferential targeting of CDS vs. 3′ UTR. Interestingly, miRNAs that contain the AGCAGC motif at the 5′ end (hsa-miR-16-5p, hsa-miR-15a/b-5p, hsa-miR-195-5p, hsa-miR-103-3p, hsa-miR-107, hsa-miR-646, hsa-miR-424-5p, hsa-miR-497-5p) and that have been previously shown to regulate cell cycle (Linsley et al. 2007; Fulci et al. 2009; Forrest et al. 2010; Balatti et al. 2011) have many more complementary sites in the CDS compared with 3′ UTR (Fig. 2A). On the other hand, motifs that are complementary to miRNAs with embryonic expression—hsa-miR-302a-3p, hsa-miR-369-3p, hsa-miR-372, hsa-miR-373-3p, hsa-miR-374b/c-5p (Suh et al. 2004), the homologs of which have been shown to be involved in maternal mRNA clearance in zebrafish (Giraldez et al. 2006)—or to the oncogenic miRNAs of the miR-17 family—hsa-miR-17-5p, hsa-miR-20a/b-5p, hsa-miR-93-5p, hsa-miR-106a/b-5p (He et al. 2005)—are more frequent in the 3′ UTRs (see also Supplemental Table 1).
Figure 2.

Individual miRNAs differ in their preference for targeting the CDS and the 3′ UTR as well as in their tendency to simultaneously target the CDS and the 3′ UTR of individual genes. (A) Number of complementary motifs, weighted by their respective ElMMo posteriors, of individual miRNAs in CDS vs. 3′ UTRs. (Red dashed line) Scaling between the number of CDS and 3′ UTR sites, defined as the line that goes through the origin and maximizes the projected variance. (B) Scatter plot of the CDS vs. 3′ UTR targeting preference of individual miRNAs against the fold enrichment in transcripts that are targeted in both the CDS and 3′ UTR relative to what would be expected if the sites were independently distributed. (Red dots) miRNAs with statistically significant co-targeting enrichment (P < 0.05 in Fisher's test after Bonferroni correction).
Given that a large fraction of miRNAs appear to prefer targeting of either the CDS or the 3′ UTR, we asked whether some miRNAs tend to simultaneously target the 3′ UTR and the CDS of the same transcript. To answer this question, we determined the number of genes that contained both one of the 250 highest-scoring CDS binding sites and one of the 250 highest-scoring 3′ UTR sites for a given miRNA, as predicted by the ElMMo algorithm. We then determined the fold enrichments in the number of such co-targeted genes relative to what would be expected if miRNAs targeted the CDS and the 3′ UTR independently (see section “Enrichments in the number of genes co-targeted in the CDS and in the 3′ UTR” in Methods). We found significant evidence of CDS and 3′ UTR co-targeting for 62 human miRNAs (P < 0.05 at Fisher's exact test after Bonferroni correction; see Supplemental Table 2). Among these were many miRNAs with important functions: the epithelial cell-specific (Gregory et al. 2008) hsa-miR-141-3p/200a-3p (P < 10−11), the embryonic stem cell-expressed (Suh et al. 2004; Stadler et al. 2010) hsa-miR-302/372/373-3p/520a-3p (P < 10−8), the oncogenic component of the mir-17/92 cluster hsa-miR-19a-3p (P < 10−6) (Ventura et al. 2008; Olive et al. 2009), the oncogenic hsa-miR-130b-3p/hsa-miR-301a-3p miRNAs (P < 10−6) (Shi et al. 2011), and the hsa-miR-137 (P < 10−6), that is involved in neural maturation (Smrt et al. 2010; Sun et al. 2011).
The tendency for these miRNAs to target both the CDS and the 3′ UTR of individual mRNAs cannot be explained by a general tendency of motif co-occurrence in the CDS and 3′ UTR of the same transcripts because co-targeting enrichments beyond threefold are very rarely observed for random motifs (Supplemental Fig. 11). Interestingly, the miRNAs for which we find evidence for CDS and 3′ UTR co-targeting are among those that preferentially target 3′ UTRs (P-value of the average CDS vs. 3′ UTR preference for these miRNAs is significantly >0, P < 10−15; see “Statistical evidence that CDS and 3′ UTR co-targeting occurs mostly for miRNAs that preferentially target 3′ UTRs” in Methods). This is illustrated in Figure 2B. Each dot in the figure represents a miRNA. The x-axis shows the preference of the miRNA for CDS vs. 3′ UTR targeting defined as the signed distance to the line representing the scaling between the number of CDS and 3′ UTR sites (Fig. 2A) for the respective miRNA. The y-axis shows the co-targeting enrichment. miRNAs that target the CDS and 3′ UTR of the same transcripts significantly more often than expected by chance appear in red. Interestingly, overexpression of most of these CDS/3′ UTR–co-targeting miRNAs has been linked with tumorigenesis (Voorhoeve et al. 2006; Huang et al. 2008; Olive et al. 2009; Mateescu et al. 2011; Shi et al. 2011).
Functional CDS and 3′ UTR binding sites have similar sequence and structure properties
Previously, we found that miRNA binding sites that are located in 3′ UTRs and are effective in mRNA degradation have specific properties such as structural accessibility and a U-rich sequence context (Hausser et al. 2009). We further found that highly conserved miRNA target sites share these properties, suggesting that miRNA target sites in 3′ UTRs have been selected in evolution based on their ability to induce mRNA degradation. We therefore asked whether target sites that are located in the CDS and are functional according to the criteria we defined for 3′ UTR sites also share these properties. As before (Hausser et al. 2009), we took a systematic approach, making use of microarray, CLIP, pSILAC, and SILAC measurements as well as the predicted target sites that we obtained above, with their associated posterior probabilities (Table 1). Functional target sites were defined as those that had a high posterior probability of being under evolutionary selection or those whose associated transcripts or proteins responded in miRNA transfection experiments (see Methods). Nonfunctional target sites were defined as those that had a low posterior probability of being under evolutionary selection or whose associated transcripts or proteins did not respond in miRNA transfection experiments. For each target site, we computed 32 properties that quantify the structure and sequence context of miRNA binding sites (listed in section 1.2 of the Supplemental Material). We then calculated the t-value quantifying the difference between the mean values taken by the properties among the functional and nonfunctional target sites. A summary of the obtained t-values is shown in Figure 3 and indicates that CDS- and 3′ UTR-located miRNA binding sites have largely similar properties (see also Supplemental Figs. 1–7, 12). In particular, U-rich and structurally accessible environments characterize functional miRNA target sites, irrespective of their location in CDS or 3′ UTRs. The correlation is considerably smaller for sites obtained based on measurement of protein expression changes for reasons that are presently unknown (Hausser et al. 2009). These results again suggest that both types of sites experience similar selective constraints and should be equally functional.
Figure 3.

CDS and 3′ UTR sites share common sequence and structure properties. Sets of functional and nonfunctional binding sites were defined according to four different criteria—selective pressure, efficacy in mRNA degradation, efficacy in reducing protein levels, and binding to EIF2C2—each corresponding to a different panel. We then compared t-values obtained in comparing functional and nonfunctional sites from CDS (x-axis) and 3′ UTR (y-axis) regions. Each property is represented in each plot as a dot. Positive and negative values denote positive and negative predictors of functional miRNA binding sites, respectively.
mRNA destabilization occurs mainly when miRNAs bind to sites in 3′ UTRs
To investigate the possible function of CDS-located miRNA target sites, we first compiled, from the miRNA transfection experiments of Linsley et al. (2007) and Grimson et al. (2007), transcripts that satisfied one of the following four mutually exclusive constraints. They had either no seed match to the transfected miRNA in either CDS or 3′ UTR, or precisely one seed match in the CDS, or precisely one seed match located in the 3′ UTR, or precisely two seed matches, one in the CDS and the other in the 3′ UTR. A seed match was again defined as a match to positions 2–8 of the transfected miRNA. Figure 4 shows that compared with 3′ UTR sites, CDS sites have a smaller, though still significant effect in inducing the degradation of the host transcripts. At least in some data sets, transcripts that carry both types of sites are down-regulated to a significantly lower level compared with transcripts that have only one type of site (not shown), consistent with what Fang and Rajewsky (2011) reported based on the analysis of the Baek et al. (2008) and Selbach et al. (2008) data sets.
Figure 4.

mRNA destabilization occurs mainly through sites located in the 3′ UTR. Shown are log2 fold changes in mRNA levels upon miRNA transfection in the experiments of (A) Linsley et al. (2007) and (B) Grimson et al. (2007). mRNAs with binding sites located in the CDS only, in the 3′ UTR only, and in both CDS and in 3′ UTR were analyzed separately. Fold changes were normalized to the average fold change of mRNAs that did not contain canonical binding sites to the transfected miRNA.
CDS binding sites can effectively inhibit translation
Although miRNAs significantly reduce the mRNA levels of their targets (Bagga et al. 2005; Lewis et al. 2005), the initial paradigm was that miRNAs inhibit translation without affecting mRNA levels (Lee et al. 1993; Wightman et al. 1993), and the relative contribution of these mechanisms is still a matter of debate (Eulalio et al. 2008; Filipowicz et al. 2008; Béthune et al. 2012; David 2012). Recently, as a way to assess the extent of translation inhibition, Guo et al. (2010) measured changes in ribosome occupancy upon miRNA transfection transcriptome-wide. They found that at 32 h post-transfection, the reduction in ribosome occupancy of transcripts with miRNA binding sites in 3′ UTRs could be attributed in very large measure (84%) to the reduction in mRNA levels.
We asked whether this observation holds equally true for transcripts with miRNA-complementary sites that are located not in the 3′ UTR but rather in the CDS. We therefore analyzed the behavior of transcripts carrying a single miRNA seed match in the CDS and transcripts in which the single miRNA seed match occurred in the 3′ UTRs in the data of Guo et al. (2010). The data set included mRNA and ribosome occupancy levels at 12 and at 32 h post-transfection, which we analyzed as described in “Processing of quantitative proteomics, microarrays and deep sequencing data” in Methods. As shown in Figure 5 and previously reported by Guo et al. (2010), transcripts that are targeted in the 3′ UTR are strongly down-regulated at 32 h after transfection, and their ribosome occupancy at this time largely reflects the mRNA level. Transcripts in which the single miRNA seed match occurred in the CDS exhibit a similar behavior, though the reduction in their mRNA levels is more limited. Surprisingly, we found that transcripts with a single miRNA seed match in the CDS exhibited a significant reduction in ribosome occupancy at 12 h post-transfection that was not due to a corresponding reduction in mRNA levels (”translation, 12 h” bars in Fig. 5). In addition, the reduction in ribosome occupancy was increased for mRNAs with two miRNA seed matches in the CDS, corresponding to an estimated 18% reduction in the translation rate (Supplemental Fig. 13). This suggests that miRNA binding sites that are located in CDS are effective in inducing translational inhibition immediately after miRNA transfection while sites located in the 3′ UTR sites are effective in down-regulating the mRNA levels.
Figure 5.

CDS-located binding sites transiently inhibit translation in miRNA transfection experiments. The figure shows log2 fold changes in mRNA levels (mRNA-seq), and ribosome-protected fragments (rpf) 12 and 32 h after hsa-miR-155-5p and hsa-miR-1 transfection. Changes in translation were estimated from the difference between changes in rpf and changes in mRNA levels. mRNAs with precisely one seed match to the transfected miRNA in the CDS and no seed match in the 3′ UTR were analyzed separately from mRNAs with precisely one seed match in the 3′ UTR and no seed match in the CDS. Fold changes were determined relative to the average fold change of mRNAs with no seed matches.
To assess the generality of these findings we revisited the data from a very recent study that investigated the miRNA-induced translational inhibition and mRNA degradation during maternal-zygotic transition in zebrafish (Bazzini et al. 2012). In contrast to Guo et al. (2010), who concluded that miRNAs have very limited effects on translation, Bazzini et al. (2012) identified a kinetic aspect of the miRNA-induced response. Namely, expression of the dre-miR-430 miRNAs caused an initial, transient, translational repression of the targets that was followed by the degradation of their corresponding mRNAs. Both CDS and 3′UTR sites were found to have a qualitatively similar effect, though CDS sites were much less effective than 3′UTR site (Bazzini et al. 2012). Reanalyzing the data of Bazzini et al. (2012) we found, as before, that CDS-located sites appear to induce translational repression at the early time points but are not effective in mRNA degradation (Supplemental Fig. 14). In contrast, 3′ UTR-located sites induce transient translational repression followed by mRNA degradation. We further analyzed transcriptomics and proteomics data that were obtained a week after the induction of miR-223 deletion in mouse (Baek et al. 2008). As shown in Supplemental Figure 15, the expression levels of mRNAs with CDS sites change very little upon knockout of miR-223 whereas their translation increases in the absence of the miRNA to a degree comparable to the translation of transcripts with binding sites in 3′ UTRs. Finally, we constructed reporters to measure the effect of a miRNA on the protein and mRNA level of miRNA targets with CDS-located target sites. First, we generated a HEK293T stable cell line containing an episomal pRTS-1 vector from which the expression of hsa-miR-124-3p can be induced with doxycyclin. We then selected two conserved CDS miR-124 target sites that were represented with a relatively high number of reads in the EIF2C2 (also known as Ago2) CLIP data of Hafner et al. (2010). These are likely to be functional hsa-miR-124-3p target sites. We inserted these sites in-frame, in their native sequence context, at the end of the Renilla-encoding coding region of the dual luciferase psiCHECK2 vector. We also constructed variants of these constructs that contained mutations in the miRNA seed-complementary region (see Supplemental Methods and Supplemental Fig. 16). We then estimated the protein expression change (through luciferase assays) and the mRNA expression change (by qPCR) 24 h after the induction of hsa-miR-124 expression. As shown in Supplemental Figure 17, wild-type constructs exhibit a reduction in protein expression relative to the mutant constructs that cannot be explained by a corresponding decrease in mRNA levels. Thus, in human, mouse and zebrafish, CDS-located miRNA binding sites appear to be more effective in translational inhibition than in mRNA degradation.
Discussion
In spite of much research, the mechanisms of action and the function of miRNAs are insufficiently understood. An aspect that is still highly debated is whether miRNAs inhibit translation, induce mRNA degradation, or both. Recent high-throughput studies concluded that the reduction in protein levels upon miRNA expression is largely a consequence of the mRNA degradation induced by miRNAs (Baek et al. 2008; Selbach et al. 2008; Guo et al. 2010), though these initial experiments may have missed an important kinetic aspect (Bazzini et al. 2012). Another recurrent finding is that changes in target mRNA level upon miRNA transfection or overexpression are small. How these small effects can confer a selective advantage that is reflected in the strong evolutionary conservation of the target sites remains a puzzle. This applies especially to target sites located in coding regions, whose effects appear to be substantially smaller compared with those in 3′ UTRs (Gu et al. 2009; Hafner et al. 2010; Schnall-Levin et al. 2010, 2011; Fang and Rajewsky 2011). What then could the function of miRNA-complementary CDS sites be?
Through an appropriate choice of a background set of sequences, the ElMMo model that we previously developed (Gaidatzis et al. 2007) allows us to predict miRNA binding sites in regions other than 3′ UTRs. We thus predicted miRNA binding sites in CDS and used them to comparatively investigate the properties and effects of miRNA-complementary sites that are located in the coding domain or in the 3′ UTR. We found that the sites that are effective at various steps of the miRNA-induced cascade are under evolutionary selection pressure. Furthermore, properties that we previously found to characterize functional 3′ UTR sites also characterize the functional CDS sites. These findings suggest that CDS and 3′ UTR sites function through similar mechanisms and have a comparable impact on gene expression.
Simultaneous measurement of mRNA and protein levels is nontrivial for a variety of reasons. Obtaining a good coverage of the proteome is difficult. Furthermore, proteomics measurements require that the proteins are labeled and this imposes constraints on the timing of miRNA transfection (or induction of expression). Sequencing of ribosome-protected fragments (rpf) circumvents some of these problems. For the first time, our analysis of such data reveals an effect that CDS-located miRNA binding sites are capable of inducing more effectively than 3′ UTR-located sites, namely a rapid reduction in mRNA translation. In some of the data sets, the effect appears to be transient. Why on longer time scales the reduction in rpf can be largely explained by the reduction of the mRNA level is at the moment unclear. Some experiments involve miRNA transfection, which is transient by nature. However, the dre-miR-430 miRNA in zebrafish persists beyond 6 h post-fertilization (hpf) when the translation inhibition is apparently relieved. Thus, transient expression of the miRNA is probably not an explanation in this case, although it cannot be entirely ruled out because dre-miR-430 may be displaced from the RNA-induced silencing complex by other miRNAs at later time points.
Interestingly, in both the zebrafish system and our reporter system, some mRNAs with miRNA binding sites in coding regions appear to be up-regulated upon miRNA expression. This may reflect another unsuspected complexity of the kinetics of miRNA-dependent gene regulation (Bazzini et al. 2012; Béthune et al. 2012; Djuranovic et al. 2012). In zebrafish, one could hypothesize that the abundance of polyadenylated mRNAs, which are isolated for mRNA expression profiling, differs between Dicer-deficient and wild-type embryos. It is well known that polyadenylation is a common means of regulation of mRNA stability and translation (Telford et al. 1990; Audic et al. 1997; Henrion et al. 2000), with deadenylation being reported to be sufficient for mRNA degradation (Audic et al. 1997). In the Bazzini et al. (2012) data, however, what is observed is preferential stabilization of known dre-miR-430 targets, which suggests either a direct involvement of miRNA-dependent regulation or an indirect correlation caused by the overlap between the set of mRNAs that undergo polyadenylation changes in development and the set of dre-miR-430 targets. At this point it is difficult to imagine how miRNAs would be directly involved. miRNAs have been reported to induce deadenylation, particularly miR-430 during maternal-zygotic transition in zebrafish (Giraldez et al. 2006). However, at 2 hpf there should be no difference in the mRNA level of miR-430 targets in Dicer-deficient and wild-type cells, both of which lack miR-430. In Xenopus, it has been reported that siRNAs impair the accumulation of the embryonically expressed miR-427, restricting RNAi during early development (Lund et al. 2011). If this effect were present in zebrafish as well and the efficiency of the siRNAs were enhanced in Dicer-negative cells, it could contribute to the observed stabilization of miR-430 targets at 2 hpf. These considerations, however, do not apply to our reporter system. Because the effect appears to be reporter-specific, additional interplays with other regulators of mRNA stability and translation rate may be at work. A few examples of crosstalk between RNA-binding proteins and the miRNA pathway have been described (Bhattacharyya et al. 2006; Kedde et al. 2007; Kedde and Agami 2008; Kim et al. 2009) and more are likely to emerge in the future.
Finally, different families of miRNAs that are broadly expressed but are active in different contexts show distinct preferences for the CDS or 3′ UTR. On one side of the spectrum are miRNAs expressed in the embryonic cells and miRNAs of the miR-17-92 cluster, that target predominantly 3′ UTRs, but also show the strongest enrichment in CDS–3′ UTR co-targeting. This suggests that these miRNAs strongly and robustly down-regulate target genes, for example at developmental transitions. On the other side of the spectrum are miRNAs of the miR-16 family, which have been previously shown to regulate cell cycle (Linsley et al. 2007). These miRNAs appear to preferentially bind to CDS-located sites, which we found to be effective in rapid inhibition of translation. This type of response may be better suited on the time scale of the cell cycle. Future work will determine the magnitude and timing of gene repression induced by miRNAs binding to the coding regions to uncover new aspects of miRNA biology.
Methods
Estimation of the selection pressure on CDS and 3′ UTR target sites
In a previous study, we introduced the ElMMo model for inferring miRNA target sites based on comparative genomics data (Gaidatzis et al. 2007). ElMMo is parameter-free, requiring only a set of miRNA-complementary, putative sites in a reference species and pairwise genome alignments between the reference species and other species. We only considered regions that were complementary to positions 1–7, 2–8, or 1–8 of the miRNA as putative miRNA binding sites. Thus, miRNAs which are identical at positions 1–8 defined a miRNA family whose members have indistinguishable target sites according to our model. ElMMo predicts miRNA target site by estimating the selection pressure on motifs that are complementary to specific miRNAs, relative to a “background” set of motifs that do not correspond to miRNAs. By simply changing the type of sequences in the input data set (coding regions or 3′ UTRs), ElMMo thus allows us to independently estimate the selection pressure on binding sites for individual miRNAs in CDS and 3′ UTRs, respectively. We used human as the reference species, and the RefSeq data set of human transcripts downloaded from the National Center for Biotechnology Information (NCBI) as the set of transcripts in which we predicted target sites.
Processing of quantitative proteomics, microarrays, and deep sequencing data
mRNA sequences, gene to mRNA mappings, mRNA to protein mappings, representative mRNA
We used the RefSeq mRNA database that we downloaded from NCBI (www.ncbi.nlm.nih.gov) on Jan 18th 2011 for all analyses described in this manuscript. The Entrez database provides us with mappings of mRNAs-to-genes and protein-to-genes. For each gene, we defined a representative mRNA as the longest mRNA in RefSeq featuring 5′ UTR, coding domain, and 3′ UTR annotation.
Computational analysis of quantitative proteomics and microarray data
We followed the methods previously described in Hausser et al. (2009), except for minor changes in the analysis pipeline and for the use of updated genomic, mRNA, and protein sequence databases. The corresponding methods are described in the Supplemental Material.
Computational analysis of ribosome protected fragment sequencing and mRNA profiling data from Guo et al. (2010)
Guo et al. (2010) analyzed mRNAs and ribosome-protected fragments (rpf) in HeLa cells that were mock-transfected or transfected with hsa-miR-1 or hsa-miR-155-5p. The deep sequencing data was downloaded from the Sequence Reads Archive (accession: GSE22004) and analyzed on the CLIPZ server (Khorshid et al. 2011). To obtain per-gene expression levels, we first computed the number of reads mapping to representative mRNAs (longest mRNA having annotated 5′ UTR, CDS, and 3′ UTR among those associated with the gene according to the Entrez Gene database of NCBI). The number of reads was subsequently normalized by the length of the CDS in the case of rpf samples, or the length of the representative mRNA in the case of the mRNA-seq samples. For the analysis, we only considered 10,222 genes with nonzero expression levels in all experimental conditions (mock, hsa-miR-155-5p, and hsa-miR-1 transfections/mRNA and rpf sequencing/0, 12, and 32 h after transfection).
To investigate the effect of the transfected miRNAs on mRNA stability and translation, we first computed the log2 fold change in rpf and mRNA expression upon miRNA transfection compared with mock transfection. mRNAs were then divided into four subsets: those with no binding sites to the transfected miRNA, those with exactly one binding site located in the 3′ UTR, those with exactly one binding site located in the CDS, and mRNAs with two binding sites in the CDS. Binding sites were defined as canonical seed matches—7mer-A1, 7mer-m8, 8mer (Bartel 2009). The overall effect of the transfected miRNA on rpf and mRNA levels was estimated by subtracting the log2 fold change of mRNAs without binding sites from that of mRNAs with binding sites (defined as above). Finally, the log2 fold change in translation induced by the transfected miRNAs was estimated from the difference between the log2 fold changes in rpf and mRNA levels.
EIF2C2 CLIP from Kishore et al. (2011)
We started from the raw CLIP and mRNA-seq reads (deposited in NCBI GEO under the accession GSE28865) of the 6 EIF2C2 CLIP experiments performed by Kishore et al. (2011). CLIP and mRNA-seq data were processed on the CLIPZ server (Khorshid et al. 2011). Only reads annotated as mRNA, mapping to a single genomic locus and to a single representative mRNA were used. CLIPed sites were defined as nonoverlapping 40-nt windows. For each mRNA, the first window was centered on the position of the mRNA that accumulated most reads. Additional windows were extracted similarly, under the constraint that they did not overlap with any previously extracted window. For each window, we computed the posterior probability that the number of CLIP reads associated to the window was larger than expected in a statistical model that only takes mRNA abundance into account (see “mRNA site extraction from CLIP reads” below). Finally, we determined which miRNA was most likely to be bound to the window by searching for 2–8 seed matches to the top 10 miRNA families expressed in HEK293 cells. In case several miRNAs mapped to a binding site, the site was assigned to most highly expressed miRNA. HEK293 miRNA profiles were determined from the two mild MNase digestion EIF2C2 CLIP samples of Kishore et al. (2011), using the methodology described in that paper.
mRNA site extraction from the EIF2C2 CLIP experiments of Kishore et al. (2011)
Outline of the statistical model
For each of the c sites yielded by the CLIP experiment, we compare the observed number of CLIP reads ri with the number of reads expected under a background model in which the number of reads per CLIP site depends only on the abundance of the corresponding mRNA. We neglect biases related to sequence accessibility, sequence composition, etc. Instead, we will focus on how CLIP sites located on mRNAs of different abundance are sampled in a thought experiment in which all CLIP sites are equally prone to bind the RNA-binding protein of interest and generate reads.
Estimating mRNA frequencies from mRNAseq data
Let us assume there are m genes, expressing different mRNAs. Although a gene typically expresses multiple mRNA isoforms, we assume for simplicity that each gene is represented by a single mRNA, defined as the longest isoform with 5′ UTR, CDS, and 3′ UTR that we find in the RefSeq database of NCBI. Thus, having m genes represented by m mRNAs, we would like to compute the probability that mRNA mi has relative abundance fi from the number of reads ni corresponding to mRNA mi that we observe in a sample.
If n is the total number of mRNA-seq reads and qi is the (unknown) probability that a read comes from mRNA mi, then the number of mRNA-seq reads that map to mRNA mi can be modeled to follow a binomial distribution:
Using Bayes's theorem, we can now compute the probability of qi:
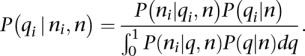 |
Assuming a uniform prior on qi, we obtain
 |
Setting α = ni + 1 and β = n − ni + 1 and using the beta function to compute the denominator yields the distribution on the probability qi for a read to come from mRNA mi:
where n is total number of mRNA-seq reads and ni is the number of reads mapping to mRNA mi.
The probability qi to obtain reads from mRNA mi is proportional to both the relative abundance fi of mRNA mi, and the length li of mRNA mi. Therefore,
where Z is a normalizing constant  . If the number of distinct mRNAs m is large and if the relative abundance of mRNAs is independent of their length, then on average, we can make the following approximation:
What we are interested in is the relative abundance of mRNA mi, P(fi) and to obtain it, we start from
 |
and perform a change of variable  , i.e.,
  which gives
 |
This further yields
Finally, one can compute the expected relative abundance 〈fi〉 of mRNA mi from the expected value of a beta distribution,
which gives
Similarly, the deviation around the expected value 〈fi〉 can be obtained from the following fundamental property of the beta distribution:
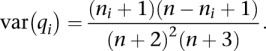 |
Since 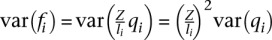 , the standard deviation around the expected value 〈fi〉 becomes
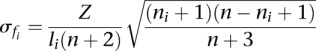 |
or, in the limit of a large n,
The number n of reads mapping to mRNA is typically in the order of 106, with <1% of these reads mapping to the single most abundant mRNA. As a result,  is <10−4.
Computing the distribution of the number of reads that is expected to fall into CLIP sites based on the abundance of the mRNA in the mRNA-seq data
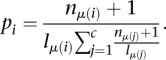
Let r be the total number of reads produced by the CLIP experiment, ri of which map to CLIP site i, and let μ(i) be the mRNA on which CLIP site i is located. Let c be the number of CLIP sites observed in the experiment. Because we only sample a finite number of reads, CLIP sites compete with each other for yielding sequenced reads. In our thought experiment, all CLIP sites are equally prone to be bound by the RNA-binding protein of interest and generate reads. This implies that CLIP sites are sampled according to the abundance of the mRNAs on which they reside. In that case, the probability that a read maps to CLIP site i is  , where Q is the normalizing constant
  .
.
And so, we can write the distribution of the number of reads ri for site i as
 |
However, we do not know the relative mRNA abundance fμ(i), only its distribution P(fμ(i)). Ideally, we would like to integrate fμ(i) out to compute
 |
with
Since this integral cannot be solved analytically, we make the approximation that all the probability density is concentrated at 〈fμ(i)〉. Because mRNA-seq libraries are typically large (n > 106) compared with the number of genes (m < 25,000), and because the single most abundant mRNA usually represents <1% of the total mRNA pool, this is a reasonable approximation to make, as shown by Equation 2 and illustrated by Supplemental Figure 18. Approximating P(fμ(i)) by its expected value  (see Equation 1) as opposed to the maximum likelihood estimate
  has the advantage that the relative abundance of any mRNA is always nonzero. This makes it possible to compute a probability of enrichment using a simple formula, even for sites located on mRNAs with no mRNAseq reads, as we will show now.
The expected value approximation of P(fμ(i)) yields
 |
where 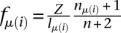 (see Equation 1) and
  .
.
Finally, substituting  back in Equation 3 leads to
with
 |
Ranking and selecting significantly enriched CLIP sites
We use the probabilistic model of Equation 4 as the basis for testing whether site i is significantly enriched over the expected number of CLIP read given the abundance of mRNA μ(i).
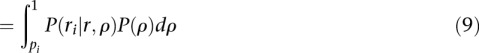
Let ρ be the fraction of the r CLIP reads that map to site i. Note that this fraction ρ is unknown, but can be estimated from the number of CLIP reads ri mapping to site i. Under the H0 hypothesis that the site i is not enriched compared with what is expected given the abundance of the mRNA μ(i), we would have ρ ≤ pi, pi being the fraction of CLIP reads expected to map to site i given the abundance of mRNA μ(i). In contrast, under the H1 hypothesis that the site i is significantly enriched over the number of reads expected from the abundance of mRNA μ(i) alone, we would have ρ > pi. Note that P(H0) + P(H1) = 1.
Using Bayes's theorem, we can compute the posterior probability of H1 from
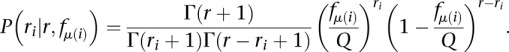
where we assumed that both hypotheses H0 and H1 have equal prior probability P(H0) = P(H1). P(ri|r, H1) can be obtained from the likelihood function introduced in Equation 4:
 |
 |
assuming a uniform prior on ρ (P(ρ) = 1, ∀ρ ∈ [0, 1]). By applying the same reasoning to P(ri|r, H0), one can show the denominator of Equation 7 to be
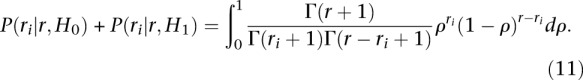 |
(11) |
Finally, substituting Equations 10 and 11 into Equation 7 gives a simple expression for the posterior probability P(H1|r, ri) that the number of CLIP reads ri mapping to site i is larger than what would be expected given the abundance of the mRNA alone:
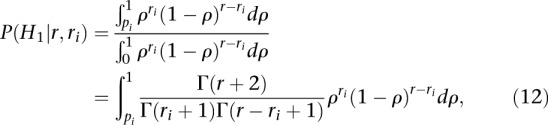 |
which is the reverse cumulative probability of a Beta distribution.
To obtain binding sites, 40-nt windows are ranked by decreasing posterior probability first, and in the case of ties, by decreasing enrichment ratios  .
.
Extraction of functional and nonfunctional miRNA binding sites
Data sets used in the analysis
The microarray and deep-sequencing data for the following references were obtained from the Gene Expression Omnibus (http://www.ncbi.nlm.nih.gov/geo/) under the accessions GSE6838 and GSE8501 for Linsley et al. (2007), GSE14537 for Hausser et al. (2009), GSE11968 for Baek et al. (2008), GDS1858 for Grimson et al. (2007), GSE22004 for Guo et al. (2010), and GSE28865 for Kishore et al. (2011). The microarray data from Selbach et al. (2008) were downloaded from http://psilac.mdc-berlin.de/download/. Protein profiling data from Selbach et al. (2008) and Baek et al. (2008) were retrieved from http://psilac.mdc-berlin.de/download/ and http://dx.doi.org/10.1038/nature07242, respectively. Finally, predictions of miRNA binding sites under selection pressure are available as flat files from http://www.mirz.unibas.ch/miRNAtargetPredictionBulk.php.
Extraction of functional and nonfunctional miRNA binding sites from combined miRNA perturbation and microarray experiments
Among the mRNA profiling data sets that we reanalyzed, the experiments performed by Grimson et al. (2007), Baek et al. (2008), Selbach et al. (2008), and Guo et al. (2010) did not feature biological replicates. For these data sets, we considered the top 250 down-regulated mRNAs that carried precisely one canonical seed match (7mer-A1, 7mer-m8, or 8mer [Bartel 2009]) to the transfected miRNA. After discarding mRNAs with seed matches located in the 5′ UTRs, we ended up with a set of “positive” (functional in mRNA down-regulation) seed matches. The negatives were obtained from the 250 mRNAs whose log2 expression fold changes were closest to 0 when comparing the miRNA-transfected samples to the mock-transfected samples. After discarding all seed matches located in the 5′ UTRs, we ended up with a set of “negative” seed matches.
For the experiments performed by Karginov et al. (2007), Linsley et al. (2007), and Hausser et al. (2009), which featured biological replicates, we applied a method that we designed for selecting transcripts that, with high probability, are affected in expression by the miRNA across all experiments in which the expression of the given miRNA was perturbed. The method was described previously (see the Supplemental Material of Hausser et al. 2009). Briefly, we first calculated, for each pairwise microarray comparison (referred to as contrast) k, the probability Pk(f | −) that a transcript that is not a target will have a log fold change of f. To estimate the distributions Pk(f | −) we assumed that they are Gaussian with means μk and standard deviation σk. Further assuming that transcripts that do not carry at least a heptameric seed-complementary site are unlikely to be real targets, we estimated μk and σk from the observed expression changes of transcripts without such seed matches. We similarly calculated, for each contrast k, a distribution Pk(f | +) that a transcript which is a true target of the miRNA will have a fold change f. Not knowing the distribution of the severity of the effect that miRNAs have on the expression of their targets we assumed as little as possible about the distribution Pk(f | +), namely that a true target must change expression in the right direction, i.e., f < 0 for a miRNA overexpression experiment, and that expression changes are limited to a finite range over which the expression change has a “uniform” distribution. Finally, based on these distributions, we estimated the posterior probability that a transcript with fold change f was a functional target in a given experiment.
To obtain nonfunctional binding sites, we selected those transcripts with the smallest sum of squared log2 fold changes in the biological replicates. Finally, for the purpose of comparing the properties of functional and nonfunctional sites, we proceeded as with experiments where no replicates were performed: We selected 250 functional sites and 250 nonfunctional sites according to the criteria defined above and we discarded those cases in which the seed match was in the 5′ UTR.
Extraction of functional and nonfunctional sites from ElMMo predictions
From our predictions of miRNA target sites under evolutionary selection (Gaidatzis et al. 2007) and for each of the experimentally tested and evolutionarily conserved miRNAs (hsa-miR-30a-5p, hsa-let-7c, hsa-miR-155-5p, hsa-miR-1, hsa-miR-103-3p, hsa-miR-15a-5p, hsa-miR-16-5p, hsa-miR-106b-5p, hsa-miR-20a-5p, hsa-miR-141-3p, hsa-miR-200a-3p, hsa-miR-181a-5p, hsa-miR-124-3p and hsa-miR-17-5p), we selected the top 250 target sites in the order of their posterior probability of being under selection. We also selected an equal number of sites least likely to be under selection, i.e., that had the smallest posterior probability of being under selection. This procedure was applied to the 3′ UTR and CDS ElMMo miRNA target site predictions separately.
Extraction of functional and nonfunctional sites from CLIP experiments of Kishore et al. (2011)
The 40-nt windows were sorted by decreasing posterior probability, and, in the case of ties, by decreasing enrichment in CLIP reads (see “mRNA site extraction from EIF2C2 CLIP experiments” in Methods). We only kept windows with exactly one canonical seed match (7mer-U1, 7mer-m8, or 8mer [Bartel 2009]) to one of the top 10 expressed miRNA families in HEK293 cells. These top 10 families were determined from reads mapping to miRNAs in the EIF2C2 MNase CLIP experiments, as described in Kishore et al. (2011) and were hsa-let-7a-5p, hsa-miR-103-3p, hsa-miR-106a-5p, hsa-miR-10a-5p, hsa-miR-15a-5p, hsa-miR-19a-3p, hsa-miR-25-3p, hsa-miR-30a-5p, hsa-miR-320a, hsa-miR-7-5p. Functional 3′ UTR binding sites were obtained from the top 250 windows located in the 3′ UTR while nonfunctional miRNA binding sites were defined as the 250 windows with weakest enrichment. Finally, CDS binding sites were obtained in a similar fashion from windows located in coding domains.
Properties definition and computation
For data sets in which the effect could not be unambiguously attributed to a single site (all data sets other than those derived by CLIP and comparative genomic analysis), we only analyzed mRNAs that had precisely one canonical miRNA seed match (7mer-A1, 7mer-m8, or 8mer). In addition, we only considered sites that were at least 100 nt away from the 5′ and 3′ ends of the mRNA. For each individual putative target site we then computed 32 sequence and structure properties, described in detail in the Supplemental Methods and Hausser et al. (2009).
Enrichments in the number of genes co-targeted in the CDS and in the 3′ UTR
To determine whether individual miRNAs tend to target the same genes in the CDS and in the 3′ UTR more than expected by chance, we determined, for each miRNA, the number c11 of genes containing at least one of the top 250 CDS and at least one of the 250 top 3′ UTR binding sites predicted by ElMMo. These numbers are reported in the “genes targeted both in CDS and 3′ UTR” column of Supplemental Table 2. In addition, we also determined the number c10 of genes containing at least one of the top 250 CDS binding sites, but not any of the 250 predicted 3′ UTR binding sites. Similarly, we determined the number c01 of genes containing at least one of the top 250 predicted 3′ UTR binding sites but none of the top 250 predicted CDS binding sites.
Under the hypothesis that miRNAs target the CDS and 3′ UTR independently, we expect a fraction 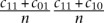 of all mRNAs to be co-targeted in the CDS and in the 3′ UTR, where n = 18,430 is the number of representative mRNAs used in the analysis. We define the fold enrichment in the number of co-targeted mRNAs as the ratio between the observed fraction of co-targeted mRNAs
  and the expected fraction of co-targeted mRNAs under the model that miRNAs independently target the CDS and the 3′ UTR
  . The “co-targeting fold enrichment” reported in Supplemental Table 2 is defined as
and we use Fisher's test to assess whether the obtained ratio is significantly different from 1. The Bonferroni-corrected P-values are reported in the last column of Supplemental Table 2.
Statistical evidence that CDS and 3′ UTR co-targeting occurs mostly for miRNAs that preferentially target 3′ UTRs
To test for a statistical link between the tendency of individual miRNAs to co-target the CDS and 3′ UTRs of the same mRNAs and their preference for CDS vs. 3′ UTR targeting, we first selected n = 62 miRNAs that showed significant enrichment in the number of co-targeted mRNAs, as described in the previous section. These miRNAs had an average excess of μ = 585.7 predicted binding sites in the 3′ UTR. From the standard deviation σ = 589.5 between the individual 62 miRNAs, we can compute a Z-score for the tendency of these miRNAs to preferentially target 3′ UTRs:
which indicates a strong preference for 3′ UTR targeting. Further assuming that the preferences for CDS vs. 3′ UTR targeting are Gaussian distributed, we can compute the P-value (P < 10−15) that miRNAs that co-target mRNAs in the CDS and in the 3′ UTR are mostly found among miRNAs that preferentially target 3′ UTRs.
Acknowledgments
We thank Nitish Mittal for valuable input in the design and analysis of the reporter experiments as well as members of the Zavolan and Filipowicz lab for comments and discussions. We also thank Antonio Giraldez and Miler Lee for sharing the processed mRNAseq and RPF zebrafish sequencing data. Work on this project was supported by the Swiss National Science Foundation Grant #31003A_127307 to M.Z. B.B. was supported by a Werner Siemens fellowship.
Author contributions: M.Z. and J.H. designed the research, J.H. and B.B. performed analyses, A.P.S. performed the experiments, A.P.S. and J.H. analyzed the data, J.H. and M.Z. wrote the paper with the help of B.B. and A.P.S.
Footnotes
[Supplemental material is available for this article.]
Article published online before print. Article, supplemental material, and publication date are at http://www.genome.org/cgi/doi/10.1101/gr.139758.112.
Freely available online through the Genome Research Open Access option.
References
- Alexiou P, Maragkakis M, Papadopoulos GL, Reczko M, Hatzigeorgiou AG 2009. Lost in translation: An assessment and perspective for computational microRNA target identification. Bioinformatics 25: 3049–3055 [DOI] [PubMed] [Google Scholar]
- Audic Y, Omilli F, Osborne HB 1997. Postfertilization deadenylation of mRNAs in Xenopus laevis embryos is sufficient to cause their degradation at the blastula stage. Mol Cell Biol 17: 209–218 [DOI] [PMC free article] [PubMed] [Google Scholar]
- Baek D, Villén J, Shin C, Camargo F, Gygi S, Bartel DP 2008. The impact of microRNAs on protein output. Nature 455: 64–71 [DOI] [PMC free article] [PubMed] [Google Scholar]
- Bagga S, Bracht J, Hunter S, Massirer K, Holtz J, Eachus R, Pasquinelli AE 2005. Regulation by let-7 and lin-4 miRNAs results in target mRNA degradation. Cell 122: 553–563 [DOI] [PubMed] [Google Scholar]
- Balatti V, Maniero S, Ferracin M, Veronese A, Negrini M, Ferrocci G, Martini F, Tognon MG 2011. MicroRNAs dysregulation in human malignant pleural mesothelioma. J Thorac Oncol 6: 844–851 [DOI] [PubMed] [Google Scholar]
- Bartel DP 2009. MicroRNAs: Target recognition and regulatory functions. Cell 136: 215–233 [DOI] [PMC free article] [PubMed] [Google Scholar]
- Bazzini AA, Lee MT, Giraldez AJ 2012. Ribosome profiling shows that miR-430 reduces translation before causing mRNA decay in zebrafish. Science 336: 233–237 [DOI] [PMC free article] [PubMed] [Google Scholar]
- Béthune J, Artus-Revel CG, Filipowicz W 2012. Kinetic analysis reveals successive steps leading to miRNA-mediated silencing in mammalian cells. EMBO Rep 13: 716–723 [DOI] [PMC free article] [PubMed] [Google Scholar]
- Bhattacharyya SN, Habermacher R, Martine U, Closs EI, Filipowicz W 2006. Relief of microRNA-mediated translational repression in human cells subjected to stress. Cell 125: 1111–1124 [DOI] [PubMed] [Google Scholar]
- Brodersen P, Sakvarelidze-Achard L, Bruun-Rasmussen M, Dunoyer P, Yamamoto YY, Sieburth L, Voinnet O 2008. Widespread translational inhibition by plant miRNAs and siRNAs. Science 320: 1185–1190 [DOI] [PubMed] [Google Scholar]
- Bushati N, Cohen SM 2007. microRNA functions. Annu Rev Cell Dev Biol 23: 175–205 [DOI] [PubMed] [Google Scholar]
- Chi SW, Zang JB, Mele A, Darnell RB 2009. Argonaute HITS-CLIP decodes microRNA-mRNA interaction maps. Nature 460: 479–486 [DOI] [PMC free article] [PubMed] [Google Scholar]
- David R 2012. miRNAs' strict schedule. Nat Rev Mol Cell Biol 13: 340–341 [DOI] [PubMed] [Google Scholar]
- Djuranovic S, Nahvi A, Green R 2012. miRNA-mediated gene silencing by translational repression followed by mRNA deadenylation and decay. Science 336: 237–240 [DOI] [PMC free article] [PubMed] [Google Scholar]
- Eulalio A, Huntzinger E, Izaurralde E 2008. Getting to the root of miRNA-mediated gene silencing. Cell 132: 9–14 [DOI] [PubMed] [Google Scholar]
- Fang Z, Rajewsky N 2011. The impact of miRNA target sites in coding sequences and in 3′UTRs. PLoS ONE 6: e18067. [DOI] [PMC free article] [PubMed] [Google Scholar]
- Filipowicz W, Bhattacharyya S, Sonenberg N 2008. Mechanisms of post-transcriptional regulation by microRNAs: Are the answers in sight? Nat Rev Genet 9: 102–114 [DOI] [PubMed] [Google Scholar]
- Forman JJ, Legesse-Miller A, Coller HA 2008. A search for conserved sequences in coding regions reveals that the let-7 microRNA targets Dicer within its coding sequence. Proc Natl Acad Sci 105: 14879–14884 [DOI] [PMC free article] [PubMed] [Google Scholar]
- Forrest ARR, Kanamori-Katayama M, Tomaru Y, Lassmann T, Ninomiya N, Takahashi Y, de Hoon MJL, Kubosaki A, Kaiho A, Suzuki M, et al. 2010. Induction of microRNAs, mir-155, mir-222, mir-424 and mir-503, promotes monocytic differentiation through combinatorial regulation. Leukemia 24: 460–466 [DOI] [PubMed] [Google Scholar]
- Fulci V, Colombo T, Chiaretti S, Messina M, Citarella F, Tavolaro S, Guarini A, Foà R, Macino G 2009. Characterization of B- and T-lineage acute lymphoblastic leukemia by integrated analysis of MicroRNA and mRNA expression profiles. Genes Chromosomes Cancer 48: 1069–1082 [DOI] [PubMed] [Google Scholar]
- Gaidatzis D, van Nimwegen E, Hausser J, Zavolan M 2007. Inference of miRNA targets using evolutionary conservation and pathway analysis. BMC Bioinformatics 8: 69. [DOI] [PMC free article] [PubMed] [Google Scholar]
- Giraldez AJ, Mishima Y, Rihel J, Grocock RJ, Van Dongen S, Inoue K, Enright AJ, Schier AF 2006. Zebrafish miR-430 promotes deadenylation and clearance of maternal mRNAs. Science 312: 75–79 [DOI] [PubMed] [Google Scholar]
- Gregory PA, Bert AG, Paterson EL, Barry SC, Tsykin A, Farshid G, Vadas MA, Khew-Goodall Y, Goodall GJ 2008. The miR-200 family and miR-205 regulate epithelial to mesenchymal transition by targeting ZEB1 and SIP1. Nat Cell Biol 10: 593–601 [DOI] [PubMed] [Google Scholar]
- Grimson A, Farh K, Johnston W, Garrett-Engele P, Lim LP, Bartel DP 2007. MicroRNA targeting specificity in mammals: Determinants beyond seed pairing. Mol Cell 27: 91–105 [DOI] [PMC free article] [PubMed] [Google Scholar]
- Gu S, Jin L, Zhang F, Sarnow P, Kay M 2009. Biological basis for restriction of microRNA targets to the 3′ untranslated region in mammalian mRNAs. Nat Struct Mol Biol 16: 144–150 [DOI] [PMC free article] [PubMed] [Google Scholar]
- Guo H, Ingolia NT, Weissman JS, Bartel DP 2010. Mammalian microRNAs predominantly act to decrease target mRNA levels. Nature 466: 835–840 [DOI] [PMC free article] [PubMed] [Google Scholar]
- Hafner M, Landthaler M, Burger L, Khorshid M, Hausser J, Berninger P, Rothballer A, Ascano M, Jungkamp A-c, Munschauer M, et al. 2010. Transcriptome-wide identification of RNA-binding protein and microRNA target sites by PAR-CLIP. Cell 141: 129–141 [DOI] [PMC free article] [PubMed] [Google Scholar]
- Hausser J, Landthaler M, Jaskiewicz L, Gaidatzis D, Zavolan M 2009. Relative contribution of sequence and structure features to the mRNA binding of Argonaute/EIF2C-miRNA complexes and the degradation of miRNA targets. Genome Res 19: 2009–2020 [DOI] [PMC free article] [PubMed] [Google Scholar]
- He L, Thomson JM, Hemann MT, Hernando-Monge E, Mu D, Goodson S, Powers S, Cordon-Cardo C, Lowe SW, Hannon GJ, et al. 2005. A microRNA polycistron as a potential human oncogene. Nature 435: 828–833 [DOI] [PMC free article] [PubMed] [Google Scholar]
- Henrion G, Renard JP, Chesné P, Oudin JF, Maniey D, Brunet A, Osborne HB, Duranthon V 2000. Differential regulation of the translation and the stability of two maternal transcripts in preimplantation rabbit embryos. Mol Reprod Dev 56: 12–25 [DOI] [PubMed] [Google Scholar]
- Huang Q, Gumireddy K, Schrier M, le Sage C, Nagel R, Nair S, Egan DA, Li A, Huang G, Klein-Szanto AJ, et al. 2008. The microRNAs miR-373 and miR-520c promote tumour invasion and metastasis. Nat Cell Biol 10: 202–210 [DOI] [PubMed] [Google Scholar]
- Huang FWD, Qin J, Reidys CM, Stadler PF 2010. Target prediction and a statistical sampling algorithm for RNA-RNA interaction. Bioinformatics 26: 175–181 [DOI] [PMC free article] [PubMed] [Google Scholar]
- Hurst LD 2006. Preliminary assessment of the impact of microRNA-mediated regulation on coding sequence evolution in mammals. J Mol Evol 63: 174–182 [DOI] [PubMed] [Google Scholar]
- Jones-Rhoades MW, Bartel DP, Bartel B 2006. MicroRNAS and their regulatory roles in plants. Annu Rev Plant Biol 57: 19–53 [DOI] [PubMed] [Google Scholar]
- Karginov FV, Conaco C, Xuan Z, Schmidt BH, Parker JS, Mandel G, Hannon GJ 2007. A biochemical approach to identifying microRNA targets. Proc Natl Acad Sci 104: 19291–19296 [DOI] [PMC free article] [PubMed] [Google Scholar]
- Kedde M, Agami R 2008. Interplay between microRNAs and RNA-binding proteins determines developmental processes. Cell Cycle 7: 899–903 [DOI] [PubMed] [Google Scholar]
- Kedde M, Strasser MJ, Boldajipour B, Oude Vrielink JA, Slanchev K, le Sage C, Nagel R, Voorhoeve PM, van Duijse J, Ørom UA, et al. 2007. RNA-binding protein Dnd1 inhibits microRNA access to target mRNA. Cell 131: 1273–1286 [DOI] [PubMed] [Google Scholar]
- Khorshid M, Rodak C, Zavolan M 2011. CLIPZ: A database and analysis environment for experimentally determined binding sites of RNA-binding proteins. Nucleic Acids Res 39: D245–D252 [DOI] [PMC free article] [PubMed] [Google Scholar]
- Kim HD, Shay T, O'Shea EK, Regev A 2009. Transcriptional regulatory circuits: Predicting numbers from alphabets. Science 325: 429–432 [DOI] [PMC free article] [PubMed] [Google Scholar]
- Kishore S, Jaskiewicz L, Burger L, Hausser J, Khorshid M, Zavolan M 2011. A quantitative analysis of CLIP methods for identifying binding sites of RNA-binding proteins. Nat Methods 8: 559–564 [DOI] [PubMed] [Google Scholar]
- Krek A, Grün D, Poy MN, Wolf R, Rosenberg L, Epstein EJ, MacMenamin P, da Piedade I, Gunsalus KC, Stoffel M, et al. 2005. Combinatorial microRNA target predictions. Nat Genet 37: 495–500 [DOI] [PubMed] [Google Scholar]
- Lanet E, Delannoy E, Sormani R, Floris M, Brodersen P, Crété P, Voinnet O, Robaglia C 2009. Biochemical evidence for translational repression by Arabidopsis microRNAs. Plant Cell 21: 1762–1768 [DOI] [PMC free article] [PubMed] [Google Scholar]
- Lee RC, Feinbaum RL, Ambros V 1993. The C. elegans heterochronic gene lin-4 encodes small RNAs with antisense complementarity to lin-14. Cell 75: 843–854 [DOI] [PubMed] [Google Scholar]
- Lewis BP, Burge CB, Bartel DP 2005. Conserved seed pairing, often flanked by adenosines, indicates that thousands of human genes are microRNA targets. Cell 120: 15–20 [DOI] [PubMed] [Google Scholar]
- Linsley P, Schelter JM, Burchard J, Kibukawa M, Martin M, Bartz S, Johnson J, Cummins J, Raymond C, Dai H, et al. 2007. Transcripts targeted by the microRNA-16 family cooperatively regulate cell cycle progression. Mol Cell Biol 27: 2240–2252 [DOI] [PMC free article] [PubMed] [Google Scholar]
- Lund E, Sheets MD, Imboden SB, Dahlberg JE 2011. Limiting Ago protein restricts RNAi and microRNA biogenesis during early development in Xenopus laevis. Genes Dev 25: 1121–1131 [DOI] [PMC free article] [PubMed] [Google Scholar]
- Mateescu B, Batista L, Cardon M, Gruosso T, de Feraudy Y, Mariani O, Nicolas A, Meyniel J-P, Cottu P, Sastre-Garau X, et al. 2011. miR-141 and miR-200a act on ovarian tumorigenesis by controlling oxidative stress response. Nat Med 17: 1627–1635 [DOI] [PubMed] [Google Scholar]
- Olive V, Bennett MJ, Walker JC, Ma C, Jiang I, Cordon-Cardo C, Li Q-J, Lowe SW, Hannon GJ, He L, et al. 2009. miR-19 is a key oncogenic component of mir-17-92. Genes Dev 23: 2839–2849 [DOI] [PMC free article] [PubMed] [Google Scholar]
- Ott CE, Grünhagen J, Jäger M, Horbelt D, Schwill S, Kallenbach K, Guo G, Manke T, Knaus P, Mundlos S, et al. 2011. MicroRNAs differentially expressed in postnatal aortic development downregulate elastin via 3′ UTR and coding-sequence binding sites. PLoS ONE 6: e16250. [DOI] [PMC free article] [PubMed] [Google Scholar]
- Qin W, Shi Y, Zhao B, Yao C, Jin L, Ma J, Jin Y 2010. miR-24 regulates apoptosis by targeting the open reading frame (ORF) region of FAF1 in cancer cells. PLoS ONE 5: e9429. [DOI] [PMC free article] [PubMed] [Google Scholar]
- Schnall-Levin M, Zhao Y, Perrimon N, Berger B 2010. Conserved microRNA targeting in Drosophila is as widespread in coding regions as in 3′ UTRs. Proc Natl Acad Sci 107: 15751–15756 [DOI] [PMC free article] [PubMed] [Google Scholar]
- Schnall-Levin M, Rissland OS, Johnston W, Perrimon N, Bartel DP, Berger B 2011. Unusually effective microRNA targeting within repeat-rich coding regions of mammalian mRNAs. Genome Res 21: 1395–1403 [DOI] [PMC free article] [PubMed] [Google Scholar]
- Selbach M, Schwanhäusser B, Thierfelder N, Fang Z, Khanin R, Rajewsky N 2008. Widespread changes in protein synthesis induced by microRNAs. Nature 455: 58–63 [DOI] [PubMed] [Google Scholar]
- Shi W, Gerster K, Alajez NM, Tsang J, Waldron L, Pintilie M, Hui AB, Sykes J, P'ng C, Miller N, et al. 2011. MicroRNA-301 mediates proliferation and invasion in human breast cancer. Cancer Res 71: 2926–2937 [DOI] [PubMed] [Google Scholar]
- Siepel A, Bejerano G, Pedersen JS, Hinrichs AS, Hou M, Rosenbloom K, Clawson H, Spieth J, Hillier LW, Richards S, et al. 2005. Evolutionarily conserved elements in vertebrate, insect, worm, and yeast genomes. Genome Res 15: 1034–1050 [DOI] [PMC free article] [PubMed] [Google Scholar]
- Smrt RD, Szulwach KE, Pfeiffer RL, Li X, Guo W, Pathania M, Teng Z-Q, Luo Y, Peng J, Bordey A, et al. 2010. MicroRNA miR-137 regulates neuronal maturation by targeting ubiquitin ligase mind bomb-1. Stem Cells 28: 1060–1070 [DOI] [PMC free article] [PubMed] [Google Scholar]
- Stadler B, Ivanovska I, Mehta K, Song S, Nelson A, Tan Y, Mathieu J, Darby C, Blau CA, Ware C, et al. 2010. Characterization of microRNAs involved in embryonic stem cell states. Stem Cells Dev 19: 935–950 [DOI] [PMC free article] [PubMed] [Google Scholar]
- Sturm M, Hackenberg M, Langenberger D, Frishman D 2010. TargetSpy: A supervised machine learning approach for microRNA target prediction. BMC Bioinformatics 11: 292. [DOI] [PMC free article] [PubMed] [Google Scholar]
- Suh M-R, Lee Y, Kim JY, Kim S-K, Moon S-H, Lee JY, Cha K-Y, Chung HM, Yoon HS, Moon SY, et al. 2004. Human embryonic stem cells express a unique set of microRNAs. Dev Biol 270: 488–498 [DOI] [PubMed] [Google Scholar]
- Sun G, Ye P, Murai K, Lang M-F, Li S, Zhang H, Li W, Fu C, Yin J, Wang A, et al. 2011. miR-137 forms a regulatory loop with nuclear receptor TLX and LSD1 in neural stem cells. Nat Commun 2: 529. [DOI] [PMC free article] [PubMed] [Google Scholar]
- Telford NA, Watson AJ, Schultz GA 1990. Transition from maternal to embryonic control in early mammalian development: A comparison of several species. Mol Reprod Dev 26: 90–100 [DOI] [PubMed] [Google Scholar]
- Ventura A, Young AG, Winslow MM, Lintault L, Meissner A, Erkeland SJ, Newman J, Bronson RT, Crowley D, Stone JR, et al. 2008. Targeted deletion reveals essential and overlapping functions of the miR-17 through 92 family of miRNA clusters. Cell 132: 875–886 [DOI] [PMC free article] [PubMed] [Google Scholar]
- Voorhoeve PM, le Sage C, Schrier M, Gillis AJM, Stoop H, Nagel R, Liu Y-P, van Duijse J, Drost J, Griekspoor A, et al. 2006. A genetic screen implicates miRNA-372 and miRNA-373 as oncogenes in testicular germ cell tumors. Cell 124: 1169–1181 [DOI] [PubMed] [Google Scholar]
- Wightman B, Ha I, Ruvkun G 1993. Posttranscriptional regulation of the heterochronic gene lin-14 by lin-4 mediates temporal pattern formation in C. elegans. Cell 75: 855–862 [DOI] [PubMed] [Google Scholar]