

Abstract
Forward genetic screens in model organisms are vital for identifying novel genes essential for developmental or disease processes. One drawback of these screens is the labor-intensive and sometimes inconclusive process of mapping the causative mutation. To leverage high-throughput techniques to improve this mapping process, we have developed a Mutation Mapping Analysis Pipeline for Pooled RNA-seq (MMAPPR) that works without parental strain information or requiring a preexisting SNP map of the organism, and adapts to differential recombination frequencies across the genome. MMAPPR accommodates the considerable amount of noise in RNA-seq data sets, calculates allelic frequency by Euclidean distance followed by Loess regression analysis, identifies the region where the mutation lies, and generates a list of putative coding region mutations in the linked genomic segment. MMAPPR can exploit RNA-seq data sets from isolated tissues or whole organisms that are used for gene expression and transcriptome analysis in novel mutants. We tested MMAPPR on two known mutant lines in zebrafish, nkx2.5 and tbx1, and used it to map two novel ENU-induced cardiovascular mutants, with mutations found in the ctr9 and cds2 genes. MMAPPR can be directly applied to other model organisms, such as Drosophila and Caenorhabditis elegans, that are amenable to both forward genetic screens and pooled RNA-seq experiments. Thus, MMAPPR is a rapid, cost-efficient, and highly automated pipeline, available to perform mutant mapping in any organism with a well-assembled genome.
Forward genetic screens in zebrafish have identified a large number of genes essential for organogenesis (Driever et al. 1996; Haffter et al. 1996), laterality (Chen et al. 2001), axon guidance (Xiao et al. 2005), and cancer development (Moore et al. 2006), many of which have been linked to human disease. Similar large-scale forward-genetic screens have been and continue to be performed in mice (Yu et al. 2004; García-García et al. 2005), Drosophila (Nüsslein-Volhard and Wieschaus 1980; Medina et al. 2006), and Caenorhabditis elegans (Brenner 1974; Hughes et al. 2011). However, mapping mutants in many species traditionally has been labor intensive and often inconclusive, especially in organisms with relatively complex genomes.
Several methods exist to expedite genetic mapping. For example, genotyping DNA pooled from phenotype-sorted individuals (bulk segregant analysis) has long been a standard method for low-resolution genetic mapping. Bulk segregant analysis provides a qualitative estimate of the linkage between a given marker and the mutant locus, while greatly reducing the time and expense of genotyping. However, this method is still labor intensive because it requires that each marker be analyzed individually.
The development of techniques using genotyping arrays (Tabernero et al. 2012), genomic resequencing of individuals (Warren et al. 2012), and exome-capture sequencing (Lin et al. 2012) have made mapping mutations much more rapid in human populations by allowing multiple markers to be analyzed simultaneously, but they have been less widely adopted in many model organisms because of incomplete genomic annotation, high polymorphism rates, and the costs associated with performing these analyses on large numbers of individuals. Recently, several methods to use whole-genome sequencing techniques to model organisms have been proposed for Arabidopsis thaliana (Schneeberger et al. 2009; Cuperus et al. 2010; Austin et al. 2011; Uchida et al. 2011), zebrafish (Bowen et al. 2012; Leshchiner et al. 2012; Voz et al. 2012), mice (Arnold et al. 2011), and C. elegans (Doitsidou et al. 2010; Zuryn et al. 2010).
An alternative to whole-genome sequencing (WGS) is RNA-seq, which is less expensive because the transcriptome is smaller than the genome, allowing greater read depth to be achieved with fewer reads. The utility of RNA-seq analysis for mapping has been demonstrated recently in self-pollinated individuals derived from inbred mapping strains in maize (Liu et al. 2012), but this has not been tested in more noisy data sets from outbred animal populations. In addition to mapping, RNA-seq is becoming a standard analysis method in model organisms for determining the gene expression and splicing changes underlying phenotypes derived from both forward and reverse genetics (Aanes et al. 2011; Rösel et al. 2011; Vesterlund et al. 2011).
Because RNA-seq of pooled individuals can be used for differential expression analysis to further understand the phenotypes of novel mutants from forward genetic screens, we sought to develop a method to use these data to identify the causative mutation underlying the observed phenotype, thus creating an inexpensive and rapid alternative to traditional mapping procedures. We have designed our method, which we call MMAPPR (Mutant Mapping Analysis Pipeline for Pooled RNA-seq), to use the data and experimental design typical in RNA-seq-based transcriptome experiments directly. Although this study goes through the principles and optimization of MMAPPR analysis as well as the details of successfully mapping four mutants, the average user will not be required to have this level of expertise and can simply process their data sets through our program (available at http://yost.genetics.utah.edu/software.php) in order to identify their mutant genes. We have validated MMAPPR on two known mutants, nkx2.5 (KV Targoff, unpubl.) and tbx1 (Piotrowski et al. 2003), and two unknown mutant lines, zy13 and zy14, identified in an ENU screen performed in our laboratory. MMAPPR was then used to identify a genomic region containing the mutation and generate a list of nonsynonymous mutations that serve as candidates for the gene encoding the causative mutation. In each case, the identified causative mutation was <1 cM from the maximum score generated by MMAPPR, indicating that MMAPPR is able to identify mutations derived from a forward genetic screen in zebrafish successfully and accurately. In addition to zebrafish, MMAPPR can be directly applied to other organisms, such as Drosophila melanogaster and C. elegans, in which both forward genetic screens and pooled RNA-seq experiments are common, thus removing a significant barrier for performing mutagenesis screens in model organisms.
Results
We developed a novel method, MMAPPR, for identifying recessive mutations identified in forward genetic screens (outlined in Fig. 1). Briefly, MMAPPR uses RNA-seq data from F2 embryos separated by phenotype into two pools: wild-type phenotype (which includes homozygous wild-type and heterozygotes), and mutant phenotype (which includes homozygous mutants). Candidate molecular mutations are then identified based on three criteria: physical location in the linked region, expression at the time of tissue collection, and effect on protein amino acid sequence.
Figure 1.

Schematic overview of MMAPPR. (A) Mating scheme. Fish from the mutant line are outcrossed and then F1 progeny, heterozygous for the mutation, are crossed. Pools of phenotypically mutant and phenotypically wild-type fish are then sorted. (B) Schematic representation of allelic segregation between wild-type and mutant pools. (Black) Genomic regions inherited from the mutant carrier line; (gray) regions inherited from the outcross line. (Bottom panel) A plot of the expected Euclidean distances calculated from the allele frequencies in the two pools. (C) Flowchart of the analysis steps incorporated in the MMAPPR algorithm. Each phase of the pipeline is shown by gray boxes, and the portion of the pipeline processed by the MMAPPR software package is shown by a vertical gray bar.
RNA-seq data contain many thousands of single nucleotide polymorphic markers (SNPs) spread across the entire genome, making it an ideal source for high-throughput mapping. However, these data sets are extremely noisy due to the variable expression levels of individual genes across the genome at the time of RNA collection, PCR amplification artifacts, sequencing errors, mapping errors, and genome annotation errors. MMAPPR compensates for the noise inherent in RNA-seq data sets to map mutations. MMAPPR encompasses five steps: (1) RNA sequencing and mapping, (2) allele frequency distance calculation, (3) signal processing, (4) candidate single nucleotide polymorphism (SNP) identification, and (5) candidate confirmation. We have created the MMAPPR software package to perform steps 2–4, while steps 1 and 5 involve bench work and preexisting software packages; however, because all five steps are integral to the process, each one is covered in more detail below.
RNA sequencing and mapping
Any pool of individuals derived from a cross between two heterozygous carriers of a SNP will contain a Mendelian distribution of genotypes (expected frequencies: 0.25 AA, 0.5 Aa, and 0.25 aa) at every SNP locus where both parents were heterozygous. Similarly, the expected allele frequencies of such a SNP are fA = 0.5 and fa = 0.5. However, when the pool of individuals is subdivided into two pools based on a mutant phenotype, the expected allele frequencies for any SNP depend on its linkage to the mutation causing the phenotype. For example, a SNP located 10 cM away from the causative mutation has an expected allele frequency of 90% for the allele linked to the causative mutation and 10% for the complementary allele.
MMAPPR uses this principle by selecting polymorphic SNPs from mapped RNA-seq reads and calculating the SNP allele frequencies in each pool, and then uses this information to estimate the location of the causative mutation (described below). Therefore, the theoretical resolution of these SNPs is a function of both population size and read depth. It is expected that increasing these factors would improve results until other factors such as data set noise and SNP density in the genome become limiting factors. To test the effect of population size, we crossed zy14 heterozygotes and prepared RNA-seq libraries from 20 phenotypically mutant and 20 phenotypically wild-type sibling embryos. We did not adjust this parameter to fewer than 20 individuals because of the amount of material typically required to build libraries for RNA-seq. This was performed three times, generating six libraries of three separate biological replicates for the zy14 line. We then used MMAPPR to analyze the 20-embryo RNA-seq data sets pairwise (matched sets of mutant and wild-type pools), and then combined the RNA-seq data sets from the three independent biological repeats to create a single data set representing 60 embryos. Surprisingly, increasing the number of individuals from 20 to 60 resulted in only a marginal decrease in the width of the detected peak (from 7.1 Mb to 5.8 Mb for the zy14 data set). It is important to note that improvements in peak size and shape are limited by data noise and SNP density. Therefore, the observations that the peak was only marginally improved by increasing numbers of embryos in the pools and that the peak maximum is <1 cM from the causative mutation indicate that we may have reached these limits, thus masking any improved resolution gained by increasing the number of individuals in each pool. However, the increased number of individuals did increase the height of the peak from an average of 0.73 in the individual data sets to 1.29 in the combined data set. Together, this suggests that RNA-seq libraries generated from 20 individuals should be sufficient for mapping.
An important question is how many reads are required in an RNA-seq data set for MMAPPR. We analyzed the effects of read count on peak width and height. Read depth across the genome in RNA-seq data sets is widely variable, with most regions having very low coverage (Supplemental Fig. S1). Due to the differences in gene expression levels at different developmental stages or in different tissues, SNP read coverage in any RNA-seq data is skewed and has a very high variance. Thus, the “mean coverage” across the genome (which is important for WGS analysis) is not a stable or intuitive summary statistic for RNA-seq-based analysis. Therefore, we used “total reads per pool” as a statistic that is applicable across a variety of RNA-seq experiments. Twenty data sets were created by randomly down-sampling reads from the combined (60 embryo) data set, generating data sets that contained from 1% to 100% of the reads from the original data. The 1% data set (containing 835,714 and 861,895 reads in the wild-type and mutant pools, respectively) did not contain enough SNPs meeting thresholds to identify a linked region. The next larger data set (containing 5,008,193 and 5,165,185 reads in the wild-type and mutant pools, respectively) generated a 10.1-Mb peak, and all remaining, larger data sets generated peaks between 5.7 and 6.9 Mb wide (Fig. 2A). Peak maxima were also more volatile in the smaller data sets but did not trend toward a higher or lower score as the number of reads was increased (Fig. 2B). Therefore, both peak width and maximum score are robust at read depths greater than 10 million total reads per pool, which is within the normal range of RNA-seq data sets. However, increasing the read depth is expected to improve sensitivity for including genes in the final candidate list, which may significantly impact identification of low expressed genes. This information will be useful for strategizing how many barcoded samples can be included in a single lane of sequencing.
Figure 2.

Effect of various parameters on peak width, height, and location. Reads were randomly sampled from the combined zy14 data set to create 20 data sets with 1%–100% of the original data. (A) The width of the peak in each data set. (B) The height of the peak for the same data sets. The 1% data set did not have a sufficient number of SNPs to identify a peak (X in A and B). (♦) All other data sets. (C) The effect of different mapping quality scores on peak location (distance of the peak maximum from the identified mutation). Mapping quality had little effect on peak position, but the best overall position for all data sets was at a phred-scaled mapping quality score threshold of 30.
Two other important considerations when designing RNA-seq experiments that will be used in MMAPPR are RNA collection time and tissue. It is important to point out that MMAPPR will identify the linked interval regardless of time point or tissue used for RNA collection. SNPs in neighboring genes that are expressed at the time of RNA collection should be sufficient to identify the linked interval, even if the mutant gene is not expressed at that time. Obviously, discovery of a SNP within the mutant gene requires that the gene be expressed to be part of the RNA-seq data set. We therefore suggest isolation of the affected tissue when feasible. However, as exemplified by mapping and identification of previously uncharacterized zy13 and zy14 mutants from our laboratory (see below), the cell lineage that is perturbed in a mutant is not always known or readily isolated, so in some cases, RNA isolated from whole embryos can be used. RNA should also be collected as soon as the embryos can be reliably segregated by phenotype to increase the likelihood of the gene being expressed.
After RNA collection and sequencing, reads are mapped to a reference genome. We used Novoalign (Novocraft) for read mapping. Although the algorithm should be software independent, selection of optimized alignment parameters may differ due to small differences in alignment and scoring algorithms in other software. MMAPPR contains several signal processing steps (see below) to compensate for noise, but selecting the proper alignment parameters also improves results. One common filtering criterion for genomic mapping is the minimum mapping quality score (mapq). This score is a phred-scaled probability that the read is misaligned and is affected by the quality of the sequencing read, the number of mismatches/gaps that occur at the putative mapping location, and the uniqueness of the sequence in the genome—all factors that can affect SNP calling. To identify the optimized mapq, we measured the distance from the peak maximum to the known mutation in the nkx2.5 line using various mapq cutoffs (Fig. 2C). This analysis showed that a cutoff of 30 resulted in a peak maximum nearest to the known mutation. Retrospectively, this cutoff was also the ideal for all of the lines tested, although we did not optimize the other lines before analysis. Changing the score threshold did not have a large effect on any of the tested lines (largest range = 0.61 Mb), indicating that the algorithm is robust against the effects of low quality reads on SNP calling.
Euclidean distance calculation
After genomic mapping, two BAM formatted alignment files are submitted to the MMAPPR software package. MMAPPR then generates a de novo catalog of informative SNPs by identifying genomic positions at which there is a mixture of alleles in the phenotypically wild-type pool (containing both wild-type and heterozygous individuals). MMAPPR does not consider whether the base calls at these catalogued positions match the reference genome. This allows the algorithm to work regardless of parental background or the strain from which the genome build was derived. Small insertions or deletions (indels) and other genomic changes are not used due to the current limits of indel-calling algorithms. However, once these algorithms are reliable, they will be added to MMAPPR. The resulting data set is then processed to minimize the effects of noise.
RNA-seq data sets are typically noisy due to a combination of several factors including library/PCR artifacts, sequencing error rates, mapping errors, etc. Therefore, measuring the relative allele frequencies between the mutant and control RNA-seq data sets requires a metric that is not susceptible to this noise. Traditional mapping methods typically use the log odds ratio (LOR) to measure linkage disequilibrium as shown in the equation:
where a is the number of reads containing a nonreference allele at the position and A is the number of reads containing the reference allele at the position. This metric has several characteristics that make it well suited for mapping analyses. Among these is the fact that it is asymptotic with its limit corresponding with the actual mutation, increasing its sensitivity near the segregating locus. However, its asymptotic nature also makes LOR extremely sensitive to noise generated from inaccurate measures of allele frequency and to situations in which there is a zero in the denominator, both of which are common in relatively low-coverage RNA-seq data. The combination of these factors resulted in a bimodal distribution of LOR scores with high LOR scores representing SNPs where low coverage stochastically resulted in a zero in the denominator. These locations are spread across the entire genome, masking any SNPs linked to the causative mutation (Supplemental Fig. S2).
Recent genome resequencing techniques in plants (Schneeberger et al. 2009) and C. elegans (Doitsidou et al. 2010) have used the density of SNP markers from the nonmutant line (based on previously generated SNP maps for parental strains) as an alternative metric to identify a putative linked region. However, RNA-seq data sets are often obtained as mutant and control pairs, and comparable sets are not obtained from parental lines, so this metric was not suited for our needs, because MMAPPR is specifically designed to work without parental strain information. Another potential method was to identify regions with homozygous SNPs in the mutant pool with or without incorporating these data into statistical models (Liu et al. 2012). However, RNA-seq is susceptible to false positives in low-coverage regions, resulting in many regions throughout the genome showing a large number of homozygous SNPs, and this method is susceptible to imperfect phenotypic identification or penetrance because nonhomozygous candidates are automatically excluded.
Given the reasons for rejecting the approaches outlined above, we chose to measure allele segregation using Euclidean distance (ED), as a metric that does not require parental strain information and is resistant to noise, using the equation:
where each letter (A, C, G, T) corresponds to the frequency of its corresponding DNA nucleotide. In practice, SNP loci with more than two variants are extremely rare, so two of the terms will be zero. Frequencies are used in place of raw read counts to compensate for read coverage differences for loci across the genome and between mutant and wild-type pools. Because frequencies cannot be accurately measured at low read counts, a minimum cutoff of 10 reads is used. ED is advantageous because it is linear, making it less prone to errors in allelic frequency analysis, and is able to subtract out sequence-specific errors, an artifact of Illumina sequencing technology (Nakamura et al. 2011) that is assumed to be equally present in both samples. In contrast, sequence-specific artifacts can have a large effect on LOR, especially near a segregating mutant due to its asymptotic nature.
As an example of the combined effects of noise on LOR and ED, we calculated the theoretically expected and experimentally observed LOR and ED scores for the nkx2.5 mutation. Expected scores were calculated using the read coverage numbers from the nkx2.5 RNA-seq data set and assuming the ideal frequencies of 100% mutant allele in the MUT pool and 33% mutant allele in the wild-type (WT) pool. The expected LOR for a completely linked SNP is 8.01, but the observed LOR score for the previously identified nkx2.5 SNP was 1.20, which is only 15% of the expected value and within one standard deviation from the median. In contrast, using the same RNA-seq data sets, the expected ED was 0.89 and the observed value was 0.71—80% of the expected value and several standard deviations above the median. Therefore, using the ED robustly compensates for the noise found in RNA-seq data sets.
Signal processing
Although measurement of allelic segregation between mutant and phenotypically wild-type (WT) pools by ED was greatly improved and did not show the bimodal distribution of SNP enrichments seen with the LOR analysis (Supplemental Fig. S2), it still showed considerable noise (Fig. 3A). Therefore, MMAPPR uses two signal-processing steps to identify the linked genomic sequence: raising the distance measurement to a power (EDx) to decrease noise created by small variations in the allelic frequency estimations (Fig. 2B) and local linear regression (Loess fit with a polynomial exponent of 1) (Cleveland 1988) of the EDs with a span automatically chosen by minimizing the corrected Aikaike Information Criterion (AICc) (Fig. 2C; Hurvich et al. 1998).
Figure 3.

Data progression through noise reduction steps. (A) Raw Euclidean distance scores across the genome. For all panels, vertical gray lines delineate chromosome edges, and chromosome widths represent the relative number of SNPs on the chromosome. (B) Euclidean distance raised to the fourth power. (C) Loess fit curve calculated using the data shown in B. (D) Effect of raising the Euclidean distance to different powers on the Loess fit curve. All data are from the nkx2.5 mutant and phenotypically wild-type RNA-seq data sets. (*) The mutation location.
Our method assumes that the Euclidean distance (ED) between allele frequencies in the mutant and WT pools decreases proportionally to the genetic distance between a given SNP and the causative mutation (see Fig. 1B). Therefore, small EDs are a mixture of noise and signal from relatively distant markers. As the ED increases, it becomes increasingly likely that a given distance measurement is signal and less likely that it is noise, while simultaneously indicating stronger linkage. Therefore, we raise the allele frequency ED to a power to increase the effect of large ED measurements and decrease the effects of low ED measurements/noise (Fig. 3B). The effect of raising an ED to increasingly greater powers minimizes the effects of increasing portions of the data. Consequently, raising the distance to too large of a power results in the shape of the Loess curve being dominated by a few outlying points. To determine the optimized power for our data sets, we ran MMAPPR on the nkx2.5 RNA-seq data at various powers and measured the width of the peak at its base and the proximity of the top of the peak to the mutation. Our results show that a power of 4 resulted in the best fit (Fig. 3D). A power of 4 also worked well on the three other mutants shown here.
A complementary method for reducing the effects of noise is to fit a curve to the raw data. However, there is not a readily apparent model that the ED data are expected to fit, excluding the use of parametric methods. We also found that smoothing methods that used a fixed window were sensitive to skewing in regions with low expressed SNP density, so we chose to fit the data using Loess regression. Loess regression is a nonparametric method for fitting curves based on a weighted average of points within a given span. In linkage analysis, SNPs located near each other should have the same ED because they are genetically linked, while SNPs located progressively farther apart are progressively less linked, and thus the difference in their EDs is less restricted. Loess regression linearly fits the data using a set number of points while weighting by the distance between each of the points. Points close to each other, which all should be genetically linked together, are weighted heavily, while points farther apart carry less weight. Using Loess regression allows for and compensates for regions with low SNP density. In contrast, fixed window methods, which use a fixed number of points with equal weight, would result in windows that span several centimorgans in low SNP density regions, and fixed distance windows would have few points in low SNP density regions. Because MMAPPR is data driven, it also accounts for local recombination frequencies without requiring a previously generated genetic map (Bowen et al. 2012) or requiring one to assume that the recombination frequency is the same across the genome, as required by HMM-based models (Leshchiner et al. 2012). We allow the span to be chosen by the software using AICc, which is commonly used for optimizing Loess fit curves (Hurvich et al. 1998). The resulting Loess curve shows a very distinct peak (Fig. 3C) at the shared segment that was not readily visible in the raw data (Fig. 3A).
Candidate selection
In addition to providing mapping information, RNA-seq data sets also contain mutation data for genes expressed at the developmental time point when the tissue is collected. To identify putative causative mutations, MMAPPR selects SNPs within the identified peak(s) that have an ED above a threshold and have a high allele frequency in the mutant pool. Because of the noise inherent in the data set, we set these cutoffs conservatively with a minimum distance of 0.5 and a minimum mutant pool allele frequency of 0.75. Identified SNPs are then analyzed using the Alleler program (part of the Useq package) (Nix et al. 2008), which uses annotated genes to determine whether a given mutation is nonsynonymous. The result provides a list of putative mutations that are confined to the identified region and may impact the gene's protein product.
The Alleler program is not able to identify causative mutations that are in genomic sequences outside the RNA data set, such as mutations in transcriptional regulatory regions, in genes that undergo nonsense-mediated decay, or mutations that consist of large deleted regions. Therefore, in addition to this analysis, we recommend that the data sets in hand be used for differential gene expression analysis using available software (for example, USeq, Cufflinks, Bioconductor) to identify genes in the identified region that have significantly different gene expression profiles.
Validation
We have verified MMAPPR using four mutants: two previously identified mutations, nkx2.5 and tbx1tm208, using RNA-seq from isolated heart tissue, and two unpublished mutations from an ENU screen performed in our laboratory, zy13 and zy14, using RNA-seq from whole embryos. Results from these experiments are summarized in Table 1. First, we developed our method and optimized the method's parameters using the previously mapped nkx2.5 line as shown in Figures 2B and 3. The final results for this line using the optimized parameters are shown in Figure 4A and Supplemental File 1. We next used these optimized parameters to analyze the previously mapped tbx1tm208 mutation (Fig. 4B; Supplemental File 2). In both cases, MMAPPR identified a stop codon within 0.5 Mb of the maximum fitted peak value corresponding with the previously identified mutations in each line. This shows that the optimized MMAPPR parameters were not specific to the nkx2.5 line, but provided a strong starting point for novel mutation analysis.
Table 1.
Summary of MMAPPR results
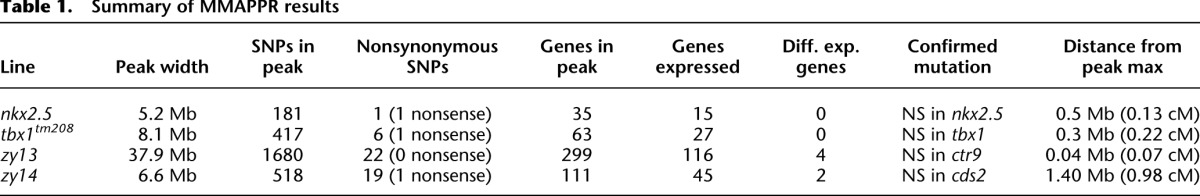
Figure 4.

Linked region peaks identified by MMAPPR for the nkx2.5 and tbx1tm208 lines. (A) Genome-wide (top panel) and chromosome 14 (bottom panel) Loess fit curves for SNP allele frequency Euclidean distance raised to the fourth power for the nkx2.5 line. (B) Genome-wide (top panel) and chromosome 5 (bottom panel) Loess fit curves for SNP allele frequency Euclidean distance raised to the fourth power for the tbx1 line. (*) The mutation location. (●) Centromeres on the x-axis.
We next used MMAPPR on two mutants, zy13 and zy14, from an ENU screen for cardiovascular development mutants performed in our laboratory. The zy13 mutant has severe pericardial edema and lacks melanophores and other migratory neural crest cells. Unlike the nkx2.5 and tbx1tm208 lines, the phenotype of this mutant did not clearly indicate a dysfunction in a readily accessible tissue, which will likely be a common situation in the analysis of novel mutants. Therefore, we asked whether MMAPPR was able to identify a mutation using RNA-seq from whole embryos (Fig. 5A,B) and compared this approach with the RAD-seq method (Baird et al. 2008) used by the commercial mapping service Floragenex (Fig. 5C). Interestingly, both methods identified a large region spanning approximately half of chromosome 7, although the peak found by MMAPPR was more informative because it had a maximum at ∼67 Mb, while the RAD-seq region was flat, without a peak.
Figure 5.

Results for MMAPPR mapping of the zy13 line. (A,B) Genome-wide (A) and chromosome 7 (B) Loess fit results. (*) Location of the mutation. (C) RADseq mapping results for chromosome 7. (D) Location of SNP and microsatellite genetic map markers on the zv9 genome-build. Lines connect the genetic map position (bottom axis) to the physical map position (top axis) of each marker. (●) Centromere location on the x-axis.
To investigate possible causes for the large region on chromosome 7, we compared the published zebrafish genetic map (Bradley et al. 2011) with physical positions in the Zv9 genome assembly. In Figure 5D, lines between the two x-axes connect the positions of genetic mapping markers (in centimorgans) and their corresponding genome assembly locations (in megabases). Crossing lines indicate locations where the two maps disagree on the genomic order of the markers. Differences between the relative distances between markers show localized differential recombination rates in the region. This analysis showed that this region falls very near the centromere (indicated by a black dot on the top and bottom x-axes), a region with very little recombination. There is also at least one pair of mapping markers that do not match the order in the physical genome assembly, indicating that there are possible errors in this region of the genomic build that may also affect the mapping results. Thus, it is likely that the large identified region was due to genomic characteristics that repress recombination around the centromere and inaccuracies in the genomic build.
Unlike the RADseq result shown in Figure 5C (which was relatively flat throughout the region), MMAPPR showed a discernible peak at ∼67 Mb. Candidate selection did not identify any stop codons in the region, but differential gene expression analysis of the RNA-seq data identified two genes near the peak maximum with greatly reduced expression levels in the mutant pool (Table 1). PCR-based DNA sequencing confirmed the presence of a nonsense mutation in the ctr9 gene that appears to cause nonsense-mediated decay, and the ability to rescue the mutant phenotype by injection of wild-type ctr9 mRNA confirmed ctr9 as the causative mutation (MJ Jurynec, X Bai, A Nechiporuk, B Bisgrove, RA Somer, H Wilson, H Grunwald, Y-C Su, K Hoshijima, HJ Yost, et al., unpubl.). These results show that MMAPPR generates an accurate estimate of the mutant location even in centromeric regions or genomic regions that are not perfectly represented in current genetic maps and genome assemblies.
The other mutant, zy14, has a complex phenotype, including failure to form intersomitic vessels and head vasculature. MMAPPR results for this line are shown in Figure 6. The identified region was 6.6 Mb, similar to the regions identified for nkx2.5 and tbx1 and much smaller than the region identified for zy13. Several nonsynonymous mutations segregating with the phenotype were identified within this region, but only a single nonsense mutation was found in the cds2 gene (Table 1). Because MMAPPR works with RNA-seq libraries generated from 20 embryos, we analyzed these libraries for differential expression to see if the candidate was also identified. However, no genes with significantly different gene expression profiles were identified within the linked region using single sets of RNA-seq libraries. Since differential expression analysis using a single RNA-seq replicate can be limited because the variance cannot be accurately estimated (Anders and Huber 2010), we tested differential expression analysis using three separate biological replicates, each derived from 20 different embryos per mutant and phenotypically wild-type pool. This analysis showed that expression of cds2 RNA containing the nonsense mutation is greatly reduced in the mutant pool, likely due to nonsense-mediated decay, providing further evidence for its role in the observed phenotype. Based on this result and the optimization studies described above (Fig. 2), in the limited cases in which the differential expression analysis component of MMAPPR is required, we recommend using at least three biological replicate RNA-seq libraries, as is common for differential expression analysis by RNA-seq, from pools each of 10–20 wild-type and mutant embryos. Including at least 10 individuals in each replicate will yield 30 individuals for mapping by combining the data sets, which provides a number of individuals above the minimum required (Fig. 2).
Figure 6.

MMAPPR results for zy14. (A,B) Genome-wide (A) and chromosome 5 (B) Loess fit results from mapping the zy14 line. (•) Centromere location; (* in B) location of the mutation. (C,D) Sanger sequencing traces from a wild-type sibling and a zy14 mutant, respectively. (Arrow) A single base changed in the mutant; (* and underline) the resulting stop codon. (E–H) Fluorescent images of the vascular phenotype visualized using the Tg(kdrl-EGFP) line at 40 hpf, which marks vasculature. (E) Wild-type zy14 sibling. (F) zy14 mutant. (G) zy14 mutant rescued by injection of wild-type cds2 mRNA. (H) Failure of cds2 mutant mRNA injection to rescue zy14 mutant embryo. In three experiments, uninjected embryos from heterozygote crosses had wild-type phenotypes in 39/51, whereas 109/109 embryos injected with wild-type cds2 mRNA had a wild-type phenotype, indicative of rescue. In contrast, mutant cds2 mRNA with the single-base change seen in zy14 was not able to rescue: 18/26 injected embryos had wild-type phenotype, compared with 14/20 uninjected siblings.
We first confirmed the putative nonsense mutation in cds2 by Sanger sequencing mutants and their siblings to show that it segregated as expected in the population (Fig. 6C,D). Next, we successfully rescued the mutant phenotype by injecting wild-type cds2 RNA injection into one-cell-stage embryos (Fig. 6E–G). Mutant cds2 mRNA, with the single base change, was unable to rescue the phenotype (Fig. 6H). After we conducted our confirmation experiments, another group published a paper showing that a different mutation in the same gene gave a similar phenotype (Pan et al. 2012). Together, these experiments indicate that MMAPPR correctly identified cds2 as the causative mutant in the zy14 line.
Discussion
The MMAPPR method described here is able to identify candidate mutations without any parental strain or genotype information, without previously identified SNP map databases, and without data from separate individuals. By using only single RNA-seq libraries from a small number of pooled mutant individuals and their phenotypically wild-type siblings, MMAPPR requires fewer animals than is normally required for traditional mapping and less sequencing data than is required for whole-genome sequence mapping. In addition, unlike whole-genome sequencing, the same RNA-seq data sets can also be used for transcriptome analyses of mutants. Furthermore, MMAPPR will allow identification of X-linked mutations because mutant allele frequency in the mutant pool will be 1, while the mutant allele frequency in the wild-type pool will be 0.2, creating a Euclidean distance between populations that is actually greater than the autosomal recessive case. A linked region can also be identified for dominant mutations if they are fully penetrant using the Euclidean distance equation here, although modifications to the MMAPPR program would have to be made for candidate SNP identification. Together, these attributes make MMAPPR an efficient and cost-effective means to identify spontaneous or induced mutations.
Using RNA-seq also allows candidate genes within the linked region to be identified by three different bioinformatics approaches. First, SNPs can be analyzed by their effect on the protein. We have integrated this analysis into MMAPPR because it directly uses the data generated for the linkage analysis. Second, gene expression analysis can be done using a number of available tools (USeq, Cufflinks, Bioconductor) to identify putative mutations that reduce mRNA levels, due either to mutations in the coding regions that lead to nonsense-mediated decay or to mutations in gene regulatory regions. Finally, differential splicing can be analyzed using several tools (USeq, SpliceGrapher, SpliceSeq, KISSPLICE). By finding the intersection between the lists generated by these tools and the MMAPPR-identified region, one can generate a robust list of candidate mutations underlying the phenotype in question. The use of these lists will differ on a case-by-case basis.
MMAPPR can be used for a wide variety of model and nonmodel organisms. For any organism, the criteria are a moderately well-assembled genome, a sufficient level of sequence polymorphism (typical of most model organisms that are not highly inbred), and a sufficient number (∼20) of F2 offspring that can be pooled by phenotype for RNA-seq. These F2 offspring do not have to be siblings, but can be generated from crosses of multiple F1 carrier siblings, as we did with the nkx2.5 and tbx1 lines. In organisms that have a genome assembly but not a strong transcriptome annotation, tools are available to build a transcriptome from RNA-seq (Grabherr et al. 2011).
Although MMAPPR worked well for the four examples shown here, it has several limitations. As currently implemented, it is unable to directly identify indels that are small enough not to affect overall gene expression levels. MMAPPR is capable of mapping larger deletions (data not shown). It is unable to identify genes that are missing from the reference build or are incorrectly annotated. Finally, it is unable to directly identify the causative lesion if the pooled samples are collected after the gene is no longer expressed or the mutation lies in untranscribed genomic regions. Nonetheless, it is important to note that in each of these cases, MMAPPR will identify the genomic region containing the lesion, and in some cases the affected gene can be identified using differential gene expression or splicing analysis, as described above. Any RNA-seq-based mapping method also cannot be used in cases in which the ability to isolate RNA for library construction is destroyed by tissue fixation or other processes necessary to identify the mutant phenotype.
We suggest several experimental design decisions to help increase one's odds of success. First, RNA should be extracted as soon as possible after onset of the phenotype to increase the likelihood that the causative gene is expressed and captured in the RNA-seq libraries. Second, we found that MMAPPR works with RNA isolated from whole animals or from tissue. Of note, the peaks for tbx1 and zy14, which both fall near each other on chromosome 5, were similar in size, even though Tbx1 was identified from isolated tissue RNA-seq and zy14 was identified from whole-embryo RNA-seq. However, we recommend when feasible that RNA isolated from the cells or tissues of interest be used for RNA-seq. In this case, MMAPPR will provide a smaller candidate pool because it only identifies candidates in the genomic region that are expressed at the right time in the right tissue. Here, the nkx2.5 and tbx1 data sets were derived from hearts dissected from embryonic zebrafish. This tissue still provided a sufficient number of expressed SNPs for accurate mapping and, concurrently, a very small list of candidates within the mapped region (Table 1). Finally, increasing the read depth will increase the likelihood of detecting causative mutations in low-expressed genes. It is commonly recommended to use at least three replicates for accurate differential gene analysis. Based on our results, three biological replicates containing at least 10–20 individuals each should be sufficient for this analysis. These replicates can be barcoded and multiplexed to reduce sequencing costs.
In conclusion, MMAPPR is a robust and effective way to map mutations generated from forward genetic screens or that spontaneously arise in a population. Adoption of this method might remove many of the barriers for researchers hesitant to conduct large-scale mutagenesis screens due to the labor-intensive and tedious mapping process.
Methods
Animal care and mating
All fish were kept in the University of Utah Centralized Zebrafish Animal Resource facility or in the Yost Laboratory Zebrafish facility according to IACUC-approved protocols. For the nkx2.5 and tbx1tm208 line, fish were received from the Yelon laboratory and the Trede laboratory, respectively, and mated into the cmlc2:GFP line maintained on an AB background. Offspring carrying both the cmlc2:GFP and the appropriate mutation were selected and mated. The zy13 and zy14 lines were identified from a standard F2 mutagenesis screen carried out in the AB strain. Mutant lines were subsequently maintained by outcrossing to the Wik zebrafish line (zy13, zy14) and the Tg(fli1-EGFP) and Tg(kdrl-EGFP) lines (zy14) (Lawson and Weinstein 2002; Beis et al. 2005).
RNA collection and sequencing
Offspring from zebrafish matings were raised to 30 hours post-fertilization (hpf) (zy13 and zy14), 48 hpf (nkx2.5), or 72 hpf (tbx1tm208) under standard conditions. These time points represent the earliest stage at which we could confidently identify the phenotypes. Embryos were then segregated into mutant and phenotypically wild-type groups based on morphological phenotype as follows: Nkx2.5—enlarged atrium and diminished ventricle; Tbx1—loss of heart looping; zy13—pericardial edema; and zy14—loss of intersegmental vessels. Pools of 20 whole embryos were collected for the zy13 and zy14 lines. For the other two lines, ∼500 hearts were isolated as previously described (Geoffrey Burns and MacRae 2006) and placed in TRIzol. Both whole embryos and isolated hearts were processed using TRIzol extraction followed by the QIAGEN RNeasy Mini kit (QIAGEN). Isolated RNA was run on a Bioanalyzer 2100 Pico Chip (Agilent) to confirm RNA quantity and quality and then used to generate cDNA libraries as previously published (Christodoulou et al. 2011) at the Harvard Biopolymers Facility or using the Illumina Truseq kit (Illumina) at the University of Utah Microarray and Genomic Analysis Shared Resource. Samples were barcoded as wild-type (WT) versus mutant pairs (two barcodes per lane), and single-end 50-bp reads were generated on a Hiseq 2000 machine at the University of Utah Microarray and Genomic Analysis Shared Resource followed by processing using the Cassava 1.6 pipeline. Mapping was done using Novoalign (Novocraft) with default parameters except output was set to Sam format and FASTQ scoring to ILMFQ. Mapping was done using the Zv9 zebrafish build with splice junctions derived from the UCSC Refseq refflat gene table. Data on the number of reads obtained from the RNA-seq data sets are summarized in Table 1.
Data processing
A software implementation of MMAPPR was created using a combination of Python 3 and R and is available at http://yost.genetics.utah.edu/software.php. Briefly, the software package performs the following steps: First, Bam files are passed through the mpileup tool in the SAMtools package (Li et al. 2009) to create a pileup file. The pileup format converts the file to a position-based format showing the bases sequenced at each position. Reads at each position are filtered by the minimum base quality and minimum mapping quality set by the user, and then the frequency of each allele is calculated. These data are subsequently passed to R for signal processing and peak identification. First, the Euclidean distance is calculated at each SNP location using the equation:
where the letters (A, C, G, T) represent their corresponding bases. This distance is then raised to a power set by the user. Next, the data are fit using a Loess curve with a polynomial exponent of 1 and a span parameter determined by minimizing the AICc. Peak regions are defined as regions where the Loess fitted values are greater than three standard deviations above the genome-wide median. R then plots the Loess fits and returns a list of SNPs within the identified region(s) that are enriched in the mutant pool (an allele frequency >0.75 and a Euclidean distance >0.5). The identified SNPs are then passed to the Alleler program (part of the USeq package) to filter for nonsynonymous SNPs using the provided gene annotation. The position and effect of these SNPs are finally exported to an output file. MMAPPR uses the optimized values reported here as defaults but allows the following variables to be modified by the user: mapping quality (default = 30), base quality (default = 20), minimum read depth (default = 10), power that ED is raised to (default = 4), and whether repetitive regions are masked (default = not masked).
Causative allele confirmation
ctr9 was chosen from the list of zy13 candidates based on its position relative to the peak of the mapped region and its known function and expression pattern. Because it was identified as a mutation that might lead to nonsense-mediated decay, it was first sequenced to identify a G–A mutation resulting in a nonsense mutation at amino acid 580. The functional significance of the mutation was confirmed by phenotypic rescue using wild-type ctr9 RNA (MJ Jurynec, X Bai, A Nechiporuk, B Bisgrove, RA Somer, H Wilson, H Grunwald, Y-C Su, K Hoshijima, HJ Yost, et al., unpubl.). cds2 was chosen as the primary candidate for the zy14 line based on both SNP and expression analysis (see Results). The mutation was confirmed by Sanger sequencing of a 327-bp genomic DNA fragment amplified using primers flanking the mutation (Fwd: TGCAGACTTCTTTGCAAGTAAAC and Rev: TTTGGACACCCCTGCTTTAT). For RNA rescue confirmation, full-length wild-type and mutant cDNAs were amplified by PCR (Fwd: CCAGGCCTCTATTTTCACCA and Rev: CCTGGTGGTCCCAGAAGTTA) and inserted into pCS2+. Capped RNAs were synthesized with the mMessage Machine SP6 transcription kit (Ambion). Embryos derived from matings of zy14+/−;Tg (kdrl-EGFP)+/− double heterozygous parents were injected at the one to two cell stage with 50 pg of wild-type or mutant cds2 RNA and scored under epifluorescent illumination at 40 hpf for rescue of the mutant intersegmental vessel phenotype. Because rescued embryos were phenotypically indistinguishable from their wild-type siblings, mutant genotypes were confirmed by Sanger sequencing.
Differential gene expression analysis
Gene expression analysis was performed using the Useq 7.8.1 software package (Nix et al. 2008). A single RNA-seq replicate was used for the nkx2.5, tbx1tm208, and zy13 lines. For the zy14 line, both three biological replicates and one replicate were run for comparison. Differentially expressed genes were defined as genes with a false discovery rate <0.05.
Genetic distance estimation
Genetic distances between peak maxima and causative mutations were estimated using the SNP/str combined genetic map and the Zv9 build (Bradley et al. 2011). Two genetic markers surrounding the region and their corresponding Zv9 location were first selected and used to create a linear model of genetic versus physical distance between the markers. This model was then used to estimate the genetic positions of each lesion and the corresponding peak maximum to calculate the genetic distance between them. Centromere positions were determined using data from previously published genetic maps (Shimoda et al. 1999; Mohideen et al. 2000).
Data access
Raw FASTQ files and aligned BAM files are available at the NHLBI Bench-to-Bassinet Consortium data-sharing hub (https://b2b.hci.utah.edu:443/gnomex/gnomexFlex.jsp?topicNumber=27). A software package for MMAPPR analysis and instructions for its use can be accessed from http://yost.genetics.utah.edu/software.php.
Acknowledgments
We thank D. Yelon and N. Trede for providing us with the nkx2.5 and tbx1 fish lines, respectively; and D. Nix, A. Holloway, N. Trede, and M. Condic for their helpful insights on the manuscript. This study was funded by a NHLBI Bench-to-Bassinet Consortium (http://www.benchtobassinet.com) grant to H.J.Y. (U01HL0981) and a core facilities support grant to New England Research Institute (U01 HL098188).
Author contributions: J.T.H. designed and implemented MMAPPR, analyzed data, and wrote the manuscript. B.L.D. assisted in designing and coding the pipeline and analyzed data. B.W.B. collected and processed the RNA from the zy13 and zy14 lines and performed experiments to confirm the putative candidates. B.G. and J.T.H. collected and processed the RNA from the Nkx2.5 and Tbx1 lines. Y-C.S. performed experiments to confirm the zy14 candidate. H.J.Y. supervised and guided the project and assisted with manuscript preparation.
Footnotes
[Supplemental material is available for this article.]
Article published online before print. Article, supplemental material, and publication date are at http://www.genome.org/cgi/doi/10.1101/gr.146936.112.
Freely available online through the Genome Research Open Access option.
References
- Aanes H, Winata CL, Lin CH, Chen JP, Srinivasan KG, Lee SGP, Lim AYM, Hajan HS, Collas P, Bourque G, et al. 2011. Zebrafish mRNA sequencing deciphers novelties in transcriptome dynamics during maternal to zygotic transition. Genome Res 21: 1328–1338 [DOI] [PMC free article] [PubMed] [Google Scholar]
- Anders S, Huber W 2010. Differential expression analysis for sequence count data. Genome Biol 11: R106. [DOI] [PMC free article] [PubMed] [Google Scholar]
- Arnold CN, Xia Y, Lin P, Ross C, Schwander M, Smart NG, Müller U, Beutler B 2011. Rapid identification of a disease allele in mouse through whole genome sequencing and bulk segregation analysis. Genetics 187: 633–641 [DOI] [PMC free article] [PubMed] [Google Scholar]
- Austin RS, Vidaurre D, Stamatiou G, Breit R, Provart NJ, Bonetta D, Zhang J, Fung P, Gong Y, Wang PW, et al. 2011. Next-generation mapping of Arabidopsis genes. Plant J 67: 715–725 [DOI] [PubMed] [Google Scholar]
- Baird NA, Etter PD, Atwood TS, Currey MC, Shiver AL, Lewis ZA, Selker EU, Cresko WA, Johnson EA 2008. Rapid SNP discovery and genetic mapping using sequenced RAD markers. PLoS ONE 3: e3376. [DOI] [PMC free article] [PubMed] [Google Scholar]
- Beis D, Bartman T, Jin SW, Scott IC, D'Amico LA, Ober EA, Verkade H, Frantsve J, Field HA, Wehman A, et al. 2005. Genetic and cellular analyses of zebrafish atrioventricular cushion and valve development. Development 132: 4193–4204 [DOI] [PubMed] [Google Scholar]
- Bowen ME, Henke K, Siegfried KR, Warman ML, Harris MP 2012. Efficient mapping and cloning of mutations in zebrafish by low-coverage whole-genome sequencing. Genetics 190: 1017–1024 [DOI] [PMC free article] [PubMed] [Google Scholar]
- Bradley KM, Breyer JP, Melville DB, Broman KW, Knapik Ela W, Smith JR 2011. An SNP-based linkage map for zebrafish reveals sex determination loci. G3 (Bethesda) 1: 3–9 [DOI] [PMC free article] [PubMed] [Google Scholar]
- Brenner S 1974. The genetics of Caenorhabditis elegans. Genetics 77: 71–94 [DOI] [PMC free article] [PubMed] [Google Scholar]
- Chen JN, van Bebber F, Goldstein AM, Serluca FC, Jackson D, Childs S, Serbedzija G, Warren KS, Mably JD, Lindahl P, et al. 2001. Genetic steps to organ laterality in zebrafish. Comp Funct Genomics 2: 60–68 [DOI] [PMC free article] [PubMed] [Google Scholar]
- Christodoulou DC, Gorham JM, Herman DS, Seidman JG 2011. Construction of normalized RNA-seq libraries for next-generation sequencing using the crab duplex-specific nuclease. Curr Protoc Mol Biol 94: 4.12.1–4.12.11 [DOI] [PMC free article] [PubMed] [Google Scholar]
- Cleveland W 1988. Locally weighted regression: An approach to regression analysis by local fitting. J Am Stat Assoc 83: 596–610 [Google Scholar]
- Cuperus JT, Montgomery TA, Fahlgren N, Burke RT, Townsend T, Sullivan CM, Carrington JC 2010. Identification of MIR390a precursor processing-defective mutants in Arabidopsis by direct genome sequencing. Proc Natl Acad Sci 107: 466–471 [DOI] [PMC free article] [PubMed] [Google Scholar]
- Doitsidou M, Poole RJ, Sarin S, Bigelow H, Hobert O 2010. C. elegans mutant identification with a one-step whole-genome-sequencing and SNP mapping strategy. PLoS ONE 5: e15435. [DOI] [PMC free article] [PubMed] [Google Scholar]
- Driever W, Solnica-Krezel L, Schier AF, Neuhauss SC, Malicki J, Stemple DL, Stainier DY, Zwartkruis F, Abdelilah S, Rangini Z, et al. 1996. A genetic screen for mutations affecting embryogenesis in zebrafish. Development 123: 37–46 [DOI] [PubMed] [Google Scholar]
- García-García MJ, Eggenschwiler JT, Caspary T, Alcorn HL, Wyler MR, Huangfu D, Rakeman AS, Lee JD, Feinberg EH, Timmer JR, et al. 2005. Analysis of mouse embryonic patterning and morphogenesis by forward genetics. Proc Natl Acad Sci 102: 5913–5919 [DOI] [PMC free article] [PubMed] [Google Scholar]
- Geoffrey Burns C, MacRae C 2006. Purification of hearts from zebrafish embryos. BioTechniques 40: 278–282 [PubMed] [Google Scholar]
- Grabherr MG, Haas BJ, Yassour M, Levin JZ, Thompson DA, Amit I, Adiconis X, Fan L, Raychowdhury R, Zeng Q, et al. 2011. Full-length transcriptome assembly from RNA-seq data without a reference genome. Nat Biotechnol 29: 644–652 [DOI] [PMC free article] [PubMed] [Google Scholar]
- Haffter P, Granato M, Brand M, Mullins M, Hammerschmidt M, Kane D, Odenthal J, van Eeden F, Jiang Y, Heisenberg C, et al. 1996. The identification of genes with unique and essential functions in the development of the zebrafish, Danio rerio. Development 123: 1–36 [DOI] [PubMed] [Google Scholar]
- Hughes SE, Huang C, Kornfeld K 2011. Identification of mutations that delay somatic or reproductive aging of Caenorhabditis elegans. Genetics 189: 341–356 [DOI] [PMC free article] [PubMed] [Google Scholar]
- Hurvich CM, Simonoff JS, Tsai C-L 1998. Smoothing parameter selection in nonparametric regression using an improved Akaike information criterion. J R Stat Soc Series B Stat Methodol 60: 271–293 [Google Scholar]
- Lawson ND, Weinstein BM 2002. In vivo imaging of embryonic vascular development using transgenic zebrafish. Dev Biol 248: 307–318 [DOI] [PubMed] [Google Scholar]
- Leshchiner I, Alexa K, Kelsey P, Adzhubei I, Austin C, Cooney J, Anderson H, King M, Stottman R, Ha S, et al. 2012. Mutation mapping and identification by whole genome sequencing. Genome Res 22: 1541–1548 [DOI] [PMC free article] [PubMed] [Google Scholar]
- Li H, Handsaker B, Wysoker A, Fennell T, Ruan J, Homer N, Marth G, Abecasis G, Durbin R 2009. The Sequence Alignment/Map format and SAMtools. Bioinformatics 25: 2078–2079 [DOI] [PMC free article] [PubMed] [Google Scholar]
- Lin X, Tang W, Ahmad S, Lu J, Colby CC, Zhu J, Yu Q 2012. Applications of targeted gene capture and next-generation sequencing technologies in studies of human deafness and other genetic disabilities. Hear Res 288: 67–76 [DOI] [PMC free article] [PubMed] [Google Scholar]
- Liu S, Yeh C-T, Tang HM, Nettleton D, Schnable PS 2012. Gene mapping via bulked segregant RNA-Seq (BSR-Seq). PLoS ONE 7: e36406. [DOI] [PMC free article] [PubMed] [Google Scholar]
- Medina PMB, Swick LL, Andersen R, Blalock Z, Brenman JE 2006. A novel forward genetic screen for identifying mutations affecting larval neuronal dendrite development in Drosophila melanogaster. Genetics 172: 2325–2335 [DOI] [PMC free article] [PubMed] [Google Scholar]
- Mohideen MA, Moore JL, Cheng KC 2000. Centromere-linked microsatellite markers for linkage groups 3, 4, 6, 7, 13, and 20 of zebrafish (Danio rerio). Genomics 67: 102–106 [DOI] [PubMed] [Google Scholar]
- Moore JL, Rush LM, Breneman C, Mohideen M-APK, Cheng KC 2006. Zebrafish genomic instability mutants and cancer susceptibility. Genetics 174: 585–600 [DOI] [PMC free article] [PubMed] [Google Scholar]
- Nakamura K, Oshima T, Morimoto T, Ikeda S, Yoshikawa H, Shiwa Y, Ishikawa S, Linak MC, Hirai A, Takahashi H, et al. 2011. Sequence-specific error profile of Illumina sequencers. Nucleic Acids Res 39: e90. [DOI] [PMC free article] [PubMed] [Google Scholar]
- Nix DA, Courdy SJ, Boucher KM 2008. Empirical methods for controlling false positives and estimating confidence in ChIP-Seq peaks. BMC Bioinformatics 9: 523. [DOI] [PMC free article] [PubMed] [Google Scholar]
- Nüsslein-Volhard C, Wieschaus E 1980. Mutations affecting segment number and polarity in Drosophila. Nature 287: 795–801 [DOI] [PubMed] [Google Scholar]
- Pan W, Pham VN, Stratman AN, Castranova D, Kamei M, Kidd KR, Lo BD, Shaw KM, Torres-Vazquez J, Mikelis CM, et al. 2012. CDP-diacylglycerol synthetase-controlled phosphoinositide availability limits VEGFA signaling and vascular morphogenesis. Blood 120: 489–498 [DOI] [PMC free article] [PubMed] [Google Scholar]
- Piotrowski T, Ahn DG, Schilling TF, Nair S, Ruvinsky I, Geisler R, Rauch GJ, Haffter P, Zon LI, Zhou Y, et al. 2003. The zebrafish van gogh mutation disrupts tbx1, which is involved in the DiGeorge deletion syndrome in humans. Development 130: 5043–5052 [DOI] [PubMed] [Google Scholar]
- Rösel TD, Hung L-H, Medenbach J, Donde K, Starke S, Benes V, Rätsch G, Bindereif A 2011. RNA-Seq analysis in mutant zebrafish reveals role of U1C protein in alternative splicing regulation. EMBO J 30: 1965–1976 [DOI] [PMC free article] [PubMed] [Google Scholar]
- Schneeberger K, Ossowski S, Lanz C, Juul T, Petersen AH, Nielsen KL, Jørgensen J-E, Weigel D, Andersen SU 2009. SHOREmap: Simultaneous mapping and mutation identification by deep sequencing. Nat Methods 6: 550–551 [DOI] [PubMed] [Google Scholar]
- Shimoda N, Knapik EW, Ziniti J, Sim C, Yamada E, Kaplan S, Jackson D, de Sauvage F, Jacob H, Fishman MC 1999. Zebrafish genetic map with 2000 microsatellite markers. Genomics 58: 219–232 [DOI] [PubMed] [Google Scholar]
- Tabernero MD, Maíllo A, Nieto AB, Diez-Tascón C, Lara M, Sousa P, Otero A, Castrillo A, Patino-Alonso MDC, Espinosa A, et al. 2012. Delineation of commonly deleted chromosomal regions in meningiomas by high-density single nucleotide polymorphism genotyping arrays. Genes Chromosomes Cancer 51: 606–617 [DOI] [PubMed] [Google Scholar]
- Uchida N, Sakamoto T, Kurata T, Tasaka M 2011. Identification of EMS-induced causal mutations in a non-reference Arabidopsis thaliana accession by whole genome sequencing. Plant Cell Physiol 52: 716–722 [DOI] [PubMed] [Google Scholar]
- Vesterlund L, Jiao H, Unneberg P, Hovatta O, Kere J 2011. The zebrafish transcriptome during early development. BMC Dev Biol 11: 30. [DOI] [PMC free article] [PubMed] [Google Scholar]
- Voz ML, Coppieters W, Manfroid I, Baudhuin A, Von Berg V, Charlier C, Meyer D, Driever W, Martial JA, Peers B 2012. Fast homozygosity mapping and identification of a zebrafish ENU-induced mutation by whole-genome sequencing. PLoS ONE 7: e34671. [DOI] [PMC free article] [PubMed] [Google Scholar]
- Warren LL, Li L, Nelson MR, Ehm MG, Shen J, Fraser DJ, Aponte JL, Nangle KL, Slater AJ, Woollard PM, et al. 2012. Deep resequencing unveils genetic architecture of ADIPOQ and identifies a novel low-frequency variant strongly associated with adiponectin variation. Diabetes 61: 1297–1301 [DOI] [PMC free article] [PubMed] [Google Scholar]
- Xiao T, Roeser T, Staub W, Baier H 2005. A GFP-based genetic screen reveals mutations that disrupt the architecture of the zebrafish retinotectal projection. Development 132: 2955–2967 [DOI] [PubMed] [Google Scholar]
- Yu Q, Shen Y, Chatterjee B, Siegfried BH, Leatherbury L, Rosenthal J, Lucas JF, Wessels A, Spurney CF, Wu Y-J, et al. 2004. ENU induced mutations causing congenital cardiovascular anomalies. Development 131: 6211–6223 [DOI] [PubMed] [Google Scholar]
- Zuryn S, Le Gras S, Jamet K, Jarriault S 2010. A strategy for direct mapping and identification of mutations by whole-genome sequencing. Genetics 186: 427–430 [DOI] [PMC free article] [PubMed] [Google Scholar]