

Abstract
African green monkeys (Chlorocebus) represent a widely distributed and morphologically diverse primate genus in sub-Saharan Africa. Little attention has been paid to their genetic diversity and phylogeny. Based on morphological data, six species are currently recognized, but their taxonomy remains disputed. Here, we aim to characterize the mitochondrial (mt) DNA diversity, biogeography and phylogeny of African green monkeys. We analyzed the complete mitochondrial cytochrome b gene of 126 samples using feces from wild individuals and material from zoo and museum specimens with clear geographical provenance, including several type specimens. We found evidence for nine major mtDNA clades that reflect geographic distributions rather than taxa, implying that the mtDNA diversity of African green monkeys does not conform to existing taxonomic classifications. Phylogenetic relationships among clades could not be resolved suggesting a rapid early divergence of lineages. Several discordances between mtDNA and phenotype indicate that hybridization may have occurred in contact zones among species, including the threatened Bale monkey (Chlorocebus djamdjamensis). Our results provide both valuable data on African green monkeys’ genetic diversity and evolution and a basis for further molecular studies on this genus. Am. J. Primatol. 75:350-360, 2013. © 2013 Wiley Periodicals, Inc.
Keywords: cytochrome b gene, phylogeny, hybridization, introgression, African savanna
INTRODUCTION
African green monkeys of the genus Chlorocebus occur in savanna habitats across sub-Saharan Africa (Fig. 1) [Kingdon, 1997; Lernould, 1988]. Previously, African green monkeys have been subsumed into the aethiops group of the genus Cercopithecus [Dandelot, 1971; Grubb et al., 2003; Hill, 1966; Napier, 1981; Schwarz, 1926], but based on recent morphological and genetic studies, they are now separated from Cercopithecus and placed within the genus Chlorocebus as sister taxon to the other ground dwelling members (Erythrocebus, Allochrocebus) of the Cercopithecini [Groves, 2001, 2005; Mekonnen et al., 2010a, 2010bb; Perelman et al., 2011; Tosi et al., 2002; Xing et al., 2007; but see Grubb et al. 2003 for a different opinion]. Due to their wide distribution and phenotypic diversity, 22 taxa have been described with most of them now being recognized as synonyms [Dandelot, 1971; Groves, 2001; Hill, 1966; Napier, 1981; Schwarz, 1926]. However, their taxonomy is still disputed and some researchers consider Chlorocebus aethiops as one polytypic species comprising five or six subspecies [Elton et al., 2010; Grubb et al., 2003; Kingdon, 1997], whereas Dandelot [1971] preferred a classification with four species and several subspecies. Here, we follow the taxonomy of Groves [2001, 2005] as his classification combines the most recent findings on genetics, morphology, and ecology on generic as well as on species and subspecies level. He recognizes six species that is also followed by the IUCN red list of threatened species [IUCN, 2012]; four monotypic species: C. aethiops (grivet), C. djamdjamensis (Bale monkey), C. sabaeus (green monkey), and C. cynosuros (malbrouck monkey), and two polytypic species: C. tantalus (tantalus monkey) with subspecies C. tantalus budgetti, C. t. marrensis and C. t. tantalus, and C. pygerythrus (vervet) with subspecies C. pygerythrus hilgerti, C. p. excubitor, C. p. nesiotes, C. p. rufoviridis, and C. p. pygerythrus.
Fig. 1.
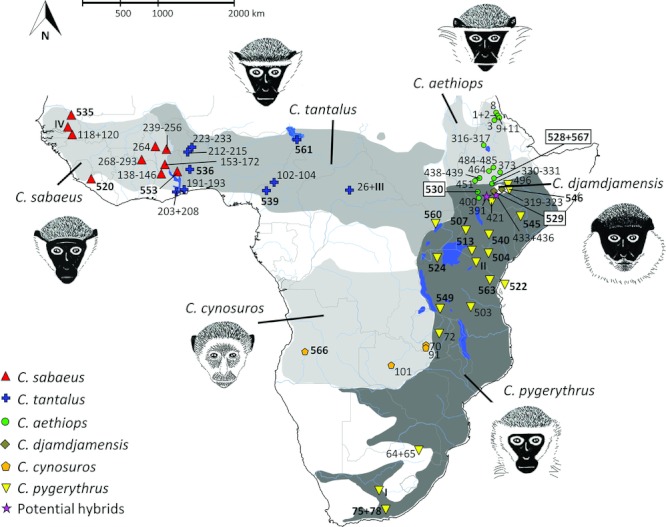
Distribution of African green monkeys (Chlorocebus) and collection sites of fecal and museum (bold) samples. Species distributions are shaded and modified from Lernould (1988) and Kingdon (1997). Colored symbols indicate phenotypes determined. Numbers correspond to IDs in Fig. 2 and Supporting Information Table SI. IDs of type specimens are boxed. Schematic drawings depicting main differences in facial characters are redrawn from Hill (1966).
Whereas most species inhabit wide geographic ranges and are listed as “Least Concern” in the IUCN red list of threatened species [Butynski, 2008; Kingdon & Butynski, 2008; Kingdon & Gippoliti, 2008a,b; Kingdon et al., 2008], C. djamdjamensis is endemic to the highlands of South Ethiopia and is classified as “Vulnerable” [Butynski et al., ]. In addition to ongoing habitat disturbance, Kingdon [1997] assumed that C. djamdjamensis is additionally threatened by hybridization with the lowland forms C. aethiops and C. pygerythrus. Hybridization seems to be not uncommon within Chlorocebus as it has been reported from most species contact zones in East Africa, and even intergeneric hybridization with Cercopithecus mitis has been observed [deJong & Butynski 2010; Kingdon, 1997; Mekonnen et al., 2012; Napier, 1981]. However, with respect to C. djamdjamensis, both its taxonomic status and the potential threat by hybridization remain unclear without genetic analyses.
Whatever taxonomic classification is applied to the members of Chlorocebus, the phylogenetic relationships among the different taxa are unresolved and a comprehensive phylogenetic analysis has yet to be done [Groves, 2001; Grubb et al., 2003]. Even though African green monkeys are used as model organism in biomedical research, for example, in Simian Immunodeficiency Virus (SIV) research [Switzer et al., 2004, 2005; Wertheim & Worobey, 2007], only few intrageneric genetic studies have been conducted, either focusing on a small region in Ethiopia [Shimada, 2000; Shimada et al., 2002] or relying on only small and taxonomically incomplete data sets [van der Kuyl et al., 1995, 1996]. Based on this data, the origin of green monkeys from the Caribbean islands (Barbados, St. Kitts, and Nevis), which are widely used in biomedical research, was assumed to be in Senegal or Gambia [van der Kuyl et al., 1996]. Although complete mitochondrial genomes were analyzed in a study on co-evolutionary processes between African green monkeys and their host-specific SIVs [Wertheim & Worobey, 2007], a total of just six individuals of four taxa representing only a small part of the genus’ geographical range were included in this study.
Given the conflicting taxonomic classifications and the lack of genetic analyses covering all major Chlorocebus taxa and the complete geographical range of the genus, we attempt to clarify the genetic diversity of African green monkeys using a comprehensive data set representing all species. In the present study, we analyzed the complete mitochondrial cytochrome b (cyt b) gene from 126 African green monkey samples with the aim to evaluate the mitochondrial diversity within the genus, to delineate geographic ranges of taxa, and to elucidate their phylogenetic relationships.
METHODS
Sample Collection
We collected 91 fecal samples of wild African green monkeys originating from 32 sites in Senegal, Ghana, Burkina Faso, Nigeria, Ethiopia, Zambia, Tanzania, and the Republic of South Africa (RSA) sampled between 2005 and 2010 (Fig. 1, Supporting Information Table SI). Samples were kept for at least 24 hr in >90% ethanol and, after drying, stored on silica beads [Nsubuga et al., 2004]. Only few samples from Nigeria and Zambia were stored directly on silica (dry samples) or only in ethanol (fresh samples). We determined geographic coordinates of sample localities using GPS (Supporting Information Table SI). We further included seven hair samples from zoos and 24 museum samples (skin, dried soft tissue, or teeth, Supporting Information Table SI), including samples of holotypes of djamdjamensis (sample ID 529), ellenbecki (sample ID 528), and matschiei (sample ID 530), and a paratype of ellenbecki (sample ID 567, Fig. 1). We used only museum samples with clear provenance. As there is no detailed information on the origin of the hair sample from the Central African Republic (CAR, ID 26), we depicted the locality in the center of the country (Fig. 1). For museum samples, we used approximate coordinates of sampling sites based on voucher localities. We complemented our sample set with already published sequences of four individuals from Senegal, Tanzania/Kenya, CAR, and RSA [Wertheim & Worobey, 2007]. As the exact origins of these individuals are unknown, we depicted approximate sample localities in the map according to van der Kuyl et al. [1996] (I-IV in Fig. 1).
For the determination of species (according to the taxonomy of Groves [2001]) in the field and of museum specimens, we applied chief distinguishing phenotypic characters by direct observation [Groves, 2001; Hill, 1966; Napier, 1981]. For facial pattern, we recorded in particular information on color and structure of whiskers and the white frontal band as well as on the presence of the white mustache (Fig. 1). Further, we used the presence of the paracaudal white tuft and the subcaudal red patch, and information on the color of extremities and tail tips. As we do not have phenotypic information on analyzed specimens from Zambia, CAR, and GenBank, we assigned them to species according to their geographical provenance. In total, our data set comprises 126 samples from 59 sites representing all six proposed Chlorocebus species (Fig. 1).
All research in this project complied with protocols approved by the German Primate Center in Germany, Ethiopian Wildlife and Conservation Authority (EWCA) in Ethiopia, the Centre National de la Recherche Scientifique et Technologique (CNRST) in Burkina Faso, the Forestry Commission (FC) of Ghana, and the National Museums of Kenya (NMK) in Kenya, and adhered to the legal requirements of the countries in which the research was conducted. The study was carried out in compliance with respective animal care regulations and the principles of the American Society of Primatologists for the ethical treatment of non-human primates.
Extraction, Amplification, and Sequencing of DNA
Extraction of total genomic DNA from fecal samples was performed with the QIAamp DNA Stool Mini Kit (Qiagen, Germany) following standard protocols with only minor changes. Samples were incubated in ASL buffer overnight and DNA was eluted in 210 μl water (high-performance liquid chromatography (HPLC) grade) instead of AE buffer. The extracts were stored in 50 μl aliquots at –20°C for up to 24 months before further processing. For analysis of hair samples from zoos, roots of three to five hairs were directly added to the polymerase chain reaction (PCR) mix without prior DNA extraction [Fontanesi et al., 2007; Roos et al., 2008]. For the extraction of museum samples (teeth, pelt/skin, dried soft tissue), we used a Guanidinium thiocyanate (GuSCN) buffer (5 M GuSCN, 25 mM NaCl, 50 mM Tris, 20 mM EDTA, 1% Tween 20, 1% beta-mercaptoethanol) modified from Rohland et al. [2004]. Samples were incubated for about 24 hr in 1 ml extraction buffer per 50 mg sample under constant agitation at room temperature in the dark. We purified DNA with a combination of a batch-based silica and a column-based method according to Rohland and Hofreiter [2007] and Rohland et al. [2010], and eluted the DNA in 50 μl TE buffer. To avoid contamination with modern DNA, extractions of museum samples were conducted in a laboratory dedicated to ancient DNA analysis at the University of York. To monitor for possible cross-sample contamination, we performed one to three blank extractions (without sample) per extraction depending on the number of samples processed.
Since in mammals with female philopatry, mtDNA is known to conserve geographical pattern better than nuclear DNA [Avise, 2009], we analyzed the mitochondrial cyt b gene, which has been successfully used to resolve phylogenetic relationships in several mammals [Agnarsson & May-Collado, 2008; Castresana, 2001; Roos et al., 2008; Tobe et al., 2010; Van Ngoc Thinh et al., 2010]. We amplified the complete cyt b (1,140 bp) gene via two or four (fecal samples), or even six (museum samples) overlapping fragments (Supporting Information Table SII), because most of our samples are expected to yield only degraded DNA. For hair samples only, we used a nested PCR approach with external primers first, and subsequently, with primers amplifying two overlapping fragments in separate PCR reactions. We used 1 U BiothermTaq 5000 (Genecraft, Germany) for hair and fecal samples in a 30 μl PCR mix (1× reaction buffer, 0.16 mM for each dNTP, 0.33 μM for each primer, and 0.6 mg/ml BSA), with the following thermo cycler conditions: 94°C for 2 min, followed by 40 cycles of 94°C for 1 min, 62°C for 1 min, 72°C for 1 min, and 72°C for 5 min. For the amplification of museum samples, we used 3 U AmpliTaq Gold 360 (Applied Biosystems, Germany) in a 20 μl mix (1× reaction buffer, 2 mM MgCl2, 0.25 mM for each dNTP, 0.75 μM for each primer, and 0.1 mg/ml BSA) and the following PCR conditions: 94°C for 10 min, followed by 60 cycles of 94°C for 30 sec, 62°C for 45 sec, 72°C 45 sec, and 72°C for 5 min. To test for reliability of sequences generated from museum samples, we randomly replicated at least two of the six cyt b fragments for each sample. For 11 museum samples, for which we found putative nuclear insertions of mitochondrial sequences (NUMTs) in one or two of the six fragments, we amplified longer fragments (up to 555 bp). PCR reactions were conducted with one or two PCR blanks (HPLC-purified water) in addition to the extraction blanks depending on the number of samples processed. We ran all PCR products on 1–2% agarose gels and, after excision, purified PCR products with the Qiagen Gel Extraction Kit (Qiagen, Germany). Subsequently, sequences were run on an ABI 3130xL sequencer using the BigDye Terminator Cycle Sequencing Kit (Applied Biosystems, Germany) and respective forward and reverse primers. All sequences were deposited in GenBank (for GenBank accession numbers see Supporting Information Table SI).
Statistical Analyses
We assembled and aligned sequences with the program Geneious Pro 5.0.4 [Drummond et al., 2011] and corrected them by eye. To check for the presence of NUMTs, simple neighbor-joining trees for gene fragments were reconstructed in Mega 5.0 [Tamura et al., 2011] and branch lengths and depicted relationships were visually checked to be similar. Furthermore, all sequences were translated into amino acid sequences to detect unexpected stop codons.
We applied maximum-likelihood (ML) and Bayesian approaches for phylogenetic tree reconstructions using the programs Garli 2.0 [Zwickl, 2006] and MrBayes 3.1.2 [Huelsenbeck et al., 2001; Ronquist & Huelsenbeck, 2003]. For tree reconstructions, we used only unique sequences; therefore, the final alignment included 68 haplotypes of African green monkeys and one ortholog of Erythrocebus patas used as outgroup. For both reconstructions, the appropriate model of nucleotide substitution (TrN + G) was chosen according to the Bayesian Information Criterion as implemented in jModeltest 0.1 [Guindon & Gascuel, 2003; Posada, 2008]. For the ML analysis, support of internal nodes was assessed by 500 bootstrap replications in four independent runs. All other settings were left at their default value. A 50% majority-rule consensus tree was calculated with Paup* 4b10 [Swofford, 2003]. For Bayesian reconstructions, we applied 10 million generations with tree and parameter sampling every 10,000 generations. We checked the output of MrBayes for the adequacy of effective sample size values and discarded the first 25% of sampled trees and parameters from the beginning of the chain as burn in.
We used Network 4.610 [Bandelt et al., 1999] to additionally explore biogeographic patterns and to compare patterns of phenotype and mtDNA. We calculated a median-joining network based on cyt b sequences of the complete data set including all 126 samples. Results were displayed and edited using the Network Publisher software. To compare intra- and interspecific distances of obtained mtDNA clades or lineages, we used the software Mega 5.0 [Tamura et al., 2011]. We calculated the number of substitutions per site between sequences with the Tamura-Nei model and a gamma distribution.
RESULTS
We successfully amplified and sequenced the complete cyt b gene from 122 samples. Together with four sequences from GenBank, the data set comprised 126 African green monkey sequences. Among them, we detected 68 unique haplotypes, which are characterized by a total of 329 variable sites of which 226 are parsimony informative.
Based on directly observed phenotypic characters, we clearly assigned samples from all regions to one of the six recognized Chlorocebus species (Fig. 1), except of some samples from Ethiopia (pink stars in Fig. 1), where we found phenotypes showing mixed characters of C. aethiops and C. djamdjamensis (sample IDs 433 and 436) or phenotypes of both C. aethiops and C. pygerythrus within one group (sample ID 391).
ML and Bayesian tree reconstructions resulted in nearly identical tree topologies showing seven or nine major mtDNA clades or lineages (C1/I-C9/VII, hereafter clades, Fig. 2). Monophyly of several clades is not strongly supported and these clades might be further divided into several subclades (C1/I a-c, C2/II a-d, C IIIa-b, and C IVa-b, respectively, Fig. 2). We additionally examined genetic differences within and among clades, which show profound overlap of genetic distances in C III and C IV when determining only seven clades supporting a division into nine major mtDNA clades (Supporting Information Fig. S1). In the median-joining network, the same nine clades became apparent revealing good correspondence to geographic regions, except for the C. aethiops sample from Ethiopia, which falls together with samples from Nigeria, Cameroon, CAR, Uganda, and Kenya into C1 (Fig. 3). Phylogenetic relationships among clades remained largely unresolved due to low statistical support of both ML and Bayesian approaches (Fig. 2).
Fig. 2.
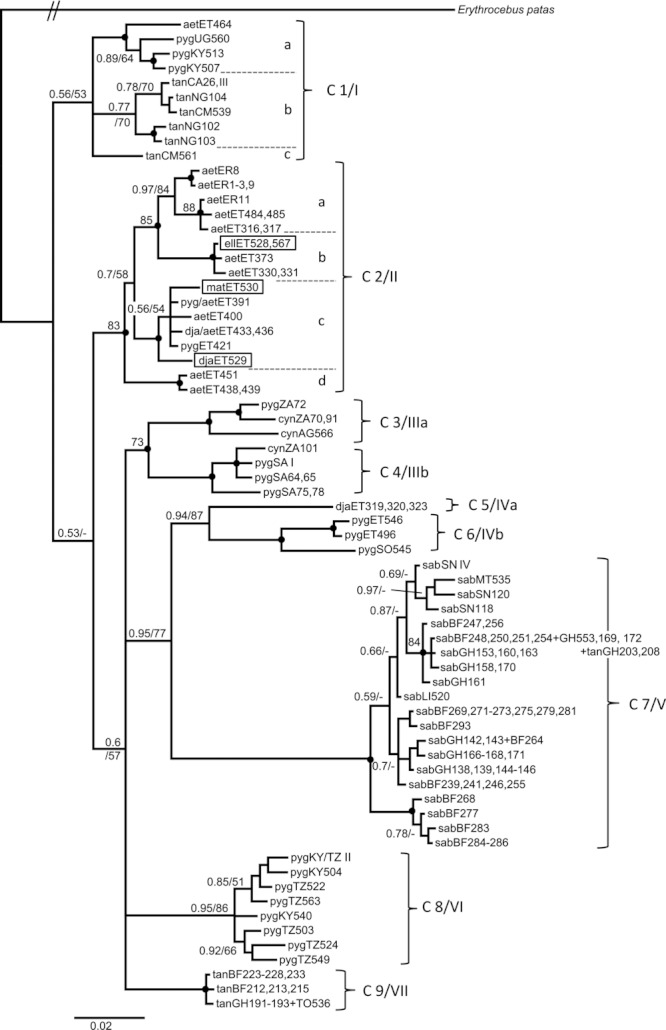
Bayesian phylogram with posterior probabilities and ML bootstrap support values based on the complete cyt b gene. C1/I-C9/VII indicate main mtDNA clades. Bootstrap support values of >90% and posterior probabilities of >0.98 are presented as black dots; values below are given at respective nodes. Type specimens are boxed.
Fig. 3.
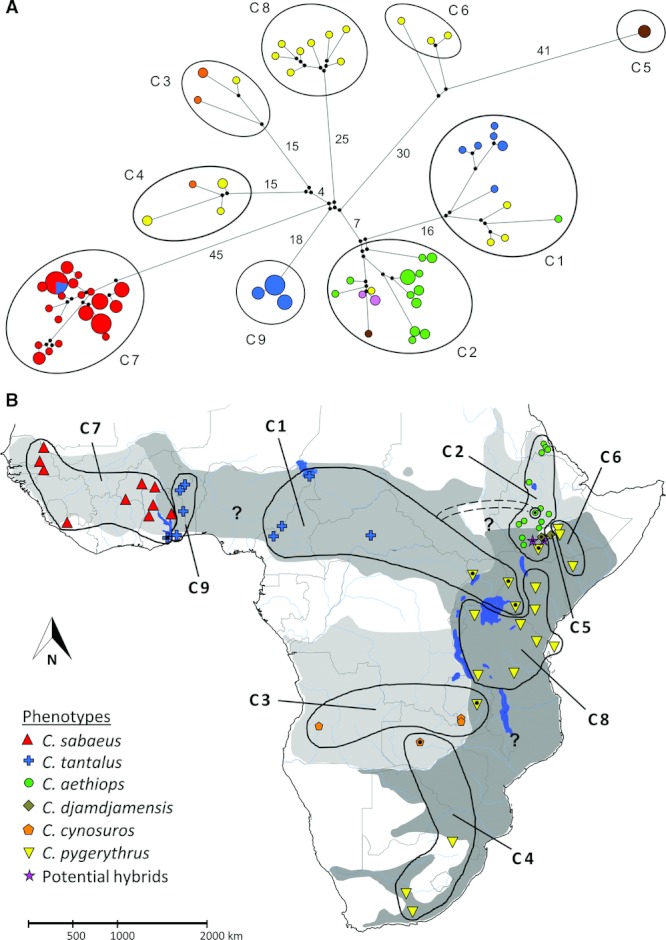
(A) Median-joining network of mtDNA sequences with depicted clade affiliations (see Fig. 2). Sizes of circles indicate haplotype frequencies and colors represent different phenotypes. Black dots along branches represent median vectors and branch length is relative to the number of mutated positions. (B) Map showing geographic distribution of the mtDNA clades detected. Samples indicating discordance between mtDNA and observed phenotype are highlighted with black dots. Question marks indicate recommended regions for future studies.
The nine major clades comprise the following species and type specimens as delineated by phenotypes and geographic regions: C1—C. tantalus from Nigeria and CAR, C. aethiops from Woliso in Ethiopia, and C. pygerythrus from Uganda and Kenya; C2—C. aethiops from Ethiopia and Eritrea, the type specimens of ellenbecki and matschiei, C. djamdjamensis from Bubbe Kersa and Gossa, the holotype of djamdjamensis from Abera, and C. pygerythrus from Yabello in South Ethiopia; C3—C. cynosuros from Angola and Northwest Zambia, and C. pygerythrus from Northeast Zambia; C4—C. pygerythrus from South Africa, and C. cynosuros from South Zambia; C5—C. djamdjamensis from the Bale Mountains National Park (NP) in Ethiopia; C6—C. pygerythrus east of the Bale Mountains in Ethiopia and Somalia; C7—C. sabaeus from West Africa west of the Volta and Oti River and C. tantalus from Shai Hills Resource Reserve (West of the Volta River); C8—C. pygerythrus from Kenya and Tanzania; and C9—C. tantalus from east of the Volta and the Oti River in Ghana, Burkina Faso, and Togo (Figs. 2 and 3). With exception of C. sabaeus (C7), phenotypes of all species are found in more than one major clade due to discordance between phenotype and mtDNA (C. tantalus: C1, C7, C9; C. aethiops: C1, C2; C. cynosuros: C3, C4; C. pygerythrus: C1, C2, C3, C4, C6, C8; C. djamdjamensis: C2, C5) causing several instances of paraphyly within the genus Chlorocebus (Figs. 2 and 3).
DISCUSSION
Our results show that the mtDNA diversity does not conform to existing taxonomic classifications [Dandelot 1959, 1971; Groves, 2001, 2005; Hill, 1966; Kingdon, 1997; Lernould, 1988; Napier, 1981], neither if we apply a six species classification nor a one superspecies classification. Furthermore, several discordances between phenotype and mtDNA, which are exclusively found in samples from regions close to contact zones among species (Fig. 3), point to possible hybridization. Hybridization and consequential discordance between mtDNA and nuclear DNA is a common pattern in cercopithecines [Detwiler et al., 2005; Keller et al., 2010; Zinner et al., 2009a,b, 2011]. Since pheno- or morphotypes are more likely to be consistent with nuclear than with mtDNA phylogenies [Zinner et al., 2009a], we assume that introgressive hybridization is responsible for the discordances in our phylogeny of African green monkeys and that intrageneric gene flow is common among all Chlorocebus species. Thereby, introgression would not vanish if a subspecies taxonomy is applied. The exchange of genetic information from one taxon to another would remain, either between species or subspecies.
Based on phylogenetic tree reconstructions, we distinguish either seven or nine major mtDNA clades. However, based on the comparison of genetic distances, the division into nine clades shows no overlap of inter- and intraclade distances and seems to be more appropriate. Both assignments reflect geographic regions rather than nominal species (Figs. 2 and 3). Monophyly of most clades is not well supported and irrespective of the number of clades, our results clearly show that cyt b sequence information does not allow any taxonomic inferences. However, based on descriptions of respective holotypes [Groves, 2001; Napier, 1981; Schwarz, 1926], the nine major mtDNA clades fall into the geographic range of the following taxa: C1 = C. tantalus, C2 = C. aethiops, C3 = C. cynosuros, C4 = C. p. pygerythrus, C5 = C. djamdjamensis, C6 = C. p. hilgerti, C7 = C. sabaeus, and C8 = C. p. rufoviridis. Since for C. tantalus, a type locality is not available and no taxon has been described from the region of Ghana, Burkina Faso, or Togo, the western phenotypic tantalus clade (C9) cannot be referred to the geographic range of any previously described taxon. However, Schwarz [1926] already mentioned a phenotypically different form from Togo that remained undescribed and was not recognized by others [e.g., Booth, 1956; Hill, 1966].
While the holotype of matschiei has been phenotypically assigned to C. aethiops by most authors [Groves, 2001; Hill, 1966; Napier, 1981], type specimens of ellenbecki have been either referred to representatives of C. pygerythrus [Groves, 2001; Napier, 1981] or C. aethiops [Dandelot and Prevost, 1972; Hill, 1966]. Based on observed phenotypic characters, we assigned type specimens of both ellenbecki (sample IDs 528 and 567) and matschiei (sample ID 530) to C. aethiops (Fig. 1), which is supported by our mtDNA results. Therefore, both taxa might represent synonyms of C. aethiops based on our findings. Schwarz [1926] explained the distinct characters of the holotype of C. djamdjamensis with a local adaption to the harsh mountain climate and listed it as synonym for hilgerti. Although we found the main distinguishing features of the holotype to be characteristic of C. djamdjamensis, the haplotype of the holotype falls into the C. aethiops clade and does not cluster with the distinct C. djamdjamensis lineage from the Bale Mountains National Park. This indicates that the holotype of djamdjamensis possibly represents a hybrid between C. djamdjamensis and C. aethiops.
Based on a previous study, C. sabaeus from St. Kitts originates most probably from Senegal or Gambia [van der Kuyl et al., 1996]. In our study, we included the cyt b sequence of the same reference individual that was used in the study by van der Kuyl et al. [1996, sample ID IV, Supporting Information Table SI], and found that this sample clusters together with other samples from Senegal and Mauretania and are not intermingled with samples from Ghana and Burkina Faso (Fig. 2). Therefore our data support the hypothesis that Caribbean green monkeys originate from Senegal or adjacent countries of the West African coast.
Compared to previous reports, we found some differences in geographic positions of species borders and contact zones. In West Africa, Booth [1956] described that the border between C. sabaeus and C. tantalus follows the Volta and the White Volta River in Ghana. We found the easternmost sample of C. sabaeus in Krachi, which is east of the White Volta River (sample ID 553) in Ghana. As for this sample, there is no discordance between phenotype and mtDNA, we assume that the border between C. sabaeus (C7) and the western tantalus clade (C9) possibly follows the Oti River and not the White Volta River in Ghana and Burkina Faso. Several authors mentioned an exceptional C. tantalus population west of the Volta River on the Accra plains in South Ghana [Booth, 1956, 1958; Hill, 1966; Kingdon, 1997; Napier, 1981], which could be confirmed in our study based on phenotypic data. However, the mtDNA sequences of these C. tantalus individuals fall into the C. sabaeus clade (C7, Fig. 3). Since no individuals with sabaeus phenotypes have been found in this area, historic introgressive hybridization is the most probable explanation for the discordance between phenotype and mtDNA of the C. tantalus population. Concerning the C. tantalus clade in Ghana, Burkina Faso, and Togo (C9), future studies should consider samples from Benin and Nigeria, especially east and west of the Niger River, to delimitate the geographical range of this western C. tantalus clade and to test if the mtDNA border between the western (C9) and eastern C. tantalus (C1) clades follows the Niger River (Fig. 3).
In Ethiopia, mtDNA of phenotypes from all three species C. aethiops, C. djamdjamensis, and C. pygerythrus cluster together in the clade from South Ethiopia (C2, Fig. 3), which indicates that hybridization has occurred and possibly still occurs between all three species in South Ethiopia. Groves [2001] mentioned a possible boundary between C. aethiops and C. pygerythrus between Lake Shala and Lake Zwai. Our phenotypic data provide evidence that the contact zone between C. aethiops and C. pygerythrus is about 200 km further to the south close to Lake Abaya, because we found phenotypes of C. aethiops and C. pygerythrus as well as intermediate forms in this area (sample ID 391, Fig. 1), and no phenotypes of C. pygerythrus further to the north. Based on phenotypic characters, we suggest that individuals from Bubbe Kersa and Gossa (sample IDs 433 and 436) are potential hybrids between C. djamdjamensis and C. aethiops. MtDNA of samples from those individuals cluster in the aethiops clade (C2), which supports the assumption that hybridization occurs between C. aethiops and C. djamdjamensis in this area. Interestingly, mtDNA of the holotype of djamdjamensis (sample ID 529), which was collected close to Bubbe Kersa and Gossa in Abera in 1900, also represents a putative hybrid (Figs. 2 and 3). These results do not only provide evidence for ongoing hybridization among C. aethiops and C. djamdjamensis, but also indicate that hybridization already occurred more than 100 years ago in this area. In concordance with Shimada [2000], samples of C. aethiops from Woliso in Southwest Ethiopia cluster together with samples of C. pygerythrus from Uganda and Kenya in the C. tantalus clade (C1, Figs. 2 and 3). Since we did not observe C. tantalus phenotypes in Ethiopia, ongoing hybridization between C. aethiops and C. tantalus in this area is unlikely and has not been reported yet. The White Nile River was mentioned as possible barrier between C. aethiops and C. tantalus, but no reliable data about the distribution of C. aethiops and C. tantalus in this region is available [Engelberger, 2010; Lernould, 1988] (Fig. 3). We found further indication for hybridization between the C. p. rufoviridis (C8) and the C. tantalus (C1) clade in Uganda and Kenya, as we detected phenotypes of C. pygerythrus but mtDNA of C. tantalus in this region (C1, Fig. 3). Our findings confirm Napier's [1981] assumption of hybridization between C. tantalus, C. pygerythrus, C. aethiops, and C. djamdjamensis in East Africa, who assumed a broad hybrid zone spreading from Uganda northeastwards to Harar in Ethiopia.
Since we do not have information on phenotypes of individuals from Zambia, we cannot exclude that incongruences within C. cynosuros and C. pygerythrus are simply caused by wrong taxonomic determination of the specimens. Thus, C. pygerythrus may be distributed further to the North and C. cynosuros further to the east than previously believed (Fig. 3). Denser sampling of C. pygerythrus and C. cynosuros in Zambia is needed to delineate their geographical ranges and to study whether interspecific gene flow occurs in a respective contact zone. Furthermore additional samples from Southern Africa would help to clarify paraphyletic relationships within the widely distributed species C. pygerythrus stretching from Ethiopia to South Africa.
The analysis of the complete cyt b gene has been successfully used to reveal the phylogeny of several primates and mammals in general [Agnarsson and May-Collado, 2008; Castresana, 2001; Roos et al., 2008; Tobe et al., 2010; Van Ngoc Thinh et al., 2010]. This was not possible for Chlorocebus. Although analyses revealed several mtDNA clades, we were not able to resolve phylogenetic relationships within the genus. While additional samples from Southern Africa might contribute to a better resolution of phylogenetic relationships within African green monkeys, weak statistical support and consequential uncertainties in basal relationships might also be an indication for the divergence of main lineages within a short time period [Zinner et al., 2009a]. Recurrent gene flow among parapatric species, triggered by periodic retractions and expansions of populations in response to Pleistocene climate changes, is another possible reason for the ambiguous relationships, as it has been found in several African savanna mammals including primates (e.g., Papio) [Arctander et al., 1999; Flagstad et al., 2001; Lorenzen et al., 2007; Muwanika et al., 2003; Zinner et al., 2009a]. The appearing of nine mtDNA clades at least indicates that Chlorocebus has experienced certain periods of geographic isolation in its evolutionary history. However, to test if the phylogeography of African green monkeys has been influenced by Pleistocene climate oscillations as suggested for other savanna mammals, further analyses of longer mtDNA sequences, ideally of full mtDNA genomes as well as of nuclear sequences from multiple independent genetic loci are necessary.
CONCLUSION
Our study indicates the importance of dense taxon sampling for revealing the genetic diversity of African green monkeys. It also shows that mtDNA genomes of only few taxa do not effectively reflect the diversity of this species complex. The study of further mtDNA markers or complete mtDNA genomes as well as of nuclear DNA markers from a sample set that represents the diversity of African green monkeys can now be used to improve support of basal relationships and help to obtain a clearer picture of the phylogeography of African green monkeys.
Although our data set includes samples from most African green monkey taxa, subsequent studies should consider further samples from Nigeria, South Sudan, and Southeast Africa to provide additional information on species borders in those regions (question marks in Fig. 3B). In general, we found that the mtDNA diversity of African green monkeys does not conform to any of the suggested classifications and also that species distributions might need revisions. However, since we found evidence of introgressive hybridization in almost all contact zones between species, mtDNA diversity cannot be regarded as equivalent to species diversity and the analysis of maternally inherited markers alone is not appropriate to delimit species. Therefore, we do not consider any taxonomic changes here and advertise studies of nuclear markers to clarify the taxonomic status of the obtained mtDNA clades and the possible impact of hybridization on the mtDNA phylogeny of African green monkeys. Nevertheless, since our data present genetic evidence for the distinctiveness of C. djamdjamensis from the Bale Mountains NP and further confirm ongoing hybridization with C. aethiops, more attention should be paid to the conservation of this endemic species and to the protection of its restricted habitat.
Acknowledgments
We thank the Ethiopian Wildlife and Conservation Authority (EWCA) in Ethiopia, the Centre National de la Recherche Scientifique et Technologique (CNRST) in Burkina Faso, and the Forestry Commission (FC) of Ghana for issuing necessary permits to conduct our research. The research was conducted according to respective national and international laws. Special thanks go to William Oduro of the Kwame Nkrumah University of Science and Technology (KNUST) in Kumasi for supporting our data collection in Ghana. For providing museum samples, we kindly thank the Zoologisches Forschungsmuseum Alexander Koenig (ZFMK), Bonn, Germany; the Zoologische Staatssammlung München (ZSM), Munich, Germany; the Museum für Naturkunde (MfN), Berlin, Germany; and the National Museums of Kenya (NMK) Nairobi, Kenya. For preparation and transfer of museum samples, we especially thank Detlef Willborn (MfN) and Jan Christian Habel. Several people provided important assistance and without their help sample collection would have been impossible: Annika Simon and Kwaku Duah in Ghana, Ahandi Tiombiano, Charlotte Rahn and Zénabou and Semde Mamounata, Peter Maciej, Andreas Ploss, Addisu Mekonnen, and Yama Ethiopia Tours, especially Ato Tariku w/aregay, Ato Zenaye Alemayhu and Ato Teklu Tesfaye, and numerous local guides and residents. TH is grateful to Johanna Paijmans and Gloria Gonzalez Fortes for sharing laboratory experiences and for their helpful advice at York University. For providing additional samples, we are grateful to Elodie Ey, Urs Kalbitzer, Christina Keller, and Tabitha Price as well as to the Zoo Asmara and the Museum Besancon. We additionally thank Julia Fischer and Lutz Walter of the German Primate Center for their support.
Supplementary material
Disclaimer: Supplementary materials have been peer-reviewed but not copyedited.
Table SI Taxon identity, sampling sites and GenBank accession numbers of the cytochrome b sequences of 126 Chlorocebus samples used in this study. Taxa are abbreviated with three initial letters and stars indicate type specimens.
Table SII Primer sequences, product sizes and annealing temperatures (Ta) used for the amplification of the cytochrome b gene in this study.
Figure S1. Ranges of genetic distances (min, mean, max) within and among mtDNA clades in percent. Depicted are intra and inter-clade distances using a classification of (A) seven (C I-VII) and (B) nine (C1-9) mtDNA clades.
REFERENCES
- Agnarsson I, May-Collado LJ. The phylogeny of Cetartiodactyla: the importance of dense taxon sampling, missing data, and the remarkable promise of cytochrome b to provide reliable species-level phylogenies. Mol Phylogenet Evol. 2008;48:964–985. doi: 10.1016/j.ympev.2008.05.046. [DOI] [PubMed] [Google Scholar]
- Arctander P, Johansen C, Coutellec-Vreto MA. Phylogeography of three closely related African bovids (tribe Alcelaphini) Mol Biol Evol. 1999;16:1724–1739. doi: 10.1093/oxfordjournals.molbev.a026085. [DOI] [PubMed] [Google Scholar]
- Avise JC. Phylogeography: retrospect and prospect. J Biogeogr. 2009;36:3–15. [Google Scholar]
- Bandelt HJ, Forster P, Rohl A. Median-joining networks for inferring intraspecific phylogenies. Mol Biol Evol. 1999;16:37–48. doi: 10.1093/oxfordjournals.molbev.a026036. [DOI] [PubMed] [Google Scholar]
- Booth AH. The distribution of primates in the Gold Coast. J West Afr Sci Ass. 1956;2:122–133. [Google Scholar]
- Booth AH. The zoogeography of West African primates: a review. Bull I'lFAN. 1958;20:587–622. [Google Scholar]
- Butynski TM. 2008. Chlorocebus cynosuros. In: IUCN 2012. IUCN red list of threatened species. Version 2012.1. Available online at: http://www.iucnredlist.org [Accessed on 03 August 2012]
- Butynski TM, Gippoliti S, Kingdon J, De Jong Y. 2001. Chlorocebus djamdjamensis. In: IUCN 2012. IUCN red list of threatened species. Version 2012.1. Available online at: http://www.iucnredlist.org [Accessed on 03 August 2012]
- Castresana J. Cytochrome b phylogeny and the taxonomy of great apes and mammals. Mol Biol Evol. 2008;18:465–471. doi: 10.1093/oxfordjournals.molbev.a003825. [DOI] [PubMed] [Google Scholar]
- Dandelot P. Note sur la classification des Cercopithèques du groupe aethiops. Mammalia. 1959;23:357–368. [Google Scholar]
- Dandelot P. Order primates. In: Meester J, Setzer HW, editors. The mammals of Africa: an identification manual (Part 3) Washington, DC: Smithsonian Institution Press; 1971. pp. 1–29. [Google Scholar]
- Dandelot P, Prévost J. Contribution à l’étude des primates d’Éthiopie (simiens) Mammalia. 1972;36:607–633. [Google Scholar]
- deJong YA, Butynski TM. Three sykes's monkey Cercopithecus mitis × vervet monkey Chlorocebus pygerythrus hybrids in Kenya. Primate Conserv. 2010;25:43–56. [Google Scholar]
- Detwiler KM, Burrell AS, Jolly CJ. Conservation implications of hybridization in African cercopithecine monkeys. Int J Primatol. 2005;26:661–684. [Google Scholar]
- Drummond AJ, Ashton B, Buxton S, Cheung M, Cooper A, Duran C, Field M, Heled J, Kearse M, Markowitz S, Moir R, Stones-Havas S, Sturrock S, Thierer T, Wilson A. 2011. Geneious v5.4. Available online at: http://www.geneious.com [Accessed on 11 December 2011]
- Elton S, Dunn J, Cardini A. Size variation facilitates population divergence but does not explain it at all: an example study from a widespread African monkey. Biol J Linn Soc. 2010;101:823–843. [Google Scholar]
- Engelberger S. Diploma thesis. Austria: University of Vienna; 2010. Annotated catalogue of primate type specimens in the mammal collection of the Museum of Natural History Vienna; p. 62. [Google Scholar]
- Flagstad Ø, Syvertsen OP, Stenseth CN, Jakobsen SK. Environmental change and rates of evolution: the phylogeographic pattern within the hartebeest complex as related to climatic variation. Proc R Soc Lond B. 2001;268:667–677. doi: 10.1098/rspb.2000.1416. [DOI] [PMC free article] [PubMed] [Google Scholar]
- Fontanesi L, Tazzoli M, Russo V. Non-invasive and simple methods for sampling rabbit DNA for PCR analysis of melanocortin 1 receptor (MC1R) gene mutations: a technical note. World Rabbit Sci. 2007;15:121–126. [Google Scholar]
- Groves CP. Primate taxonomy. Washington, DC: Smithonian Institution Press; 2001. p. 350. [Google Scholar]
- Groves CP. Order primates. In: Wilson D, Reeder D, editors. Mammal species of the world: a taxonomic and geographic reference. 3rd edition. Vol. 1. Baltimore, MD: Johns Hopkins University Press; 2005. pp. 111–184. [Google Scholar]
- Grubb P, Butynski TM, Oates JF, Bearder SK, Disotell TR, Groves CP, Struhsaker TT. Assessment of the diversity of African primates. Int J Primatol. 2003;24:1301–1357. [Google Scholar]
- Guindon S, Gascuel O. A simple, fast, and accurate algorithm to estimate large phylogenies by maximum likelihood. Syst Biol. 2003;52:696–704. doi: 10.1080/10635150390235520. [DOI] [PubMed] [Google Scholar]
- Hill WCO. Primates: comparative anatomy and taxonomy. VI. Catarrhini, Cercopithecoidea, Cercopithecinae. Edinburgh: Edinburgh University Press; 1966. pp. 533–581. [Google Scholar]
- Huelsenbeck JP, Ronquist F, Nielsen R, Bollback JP. Bayesian inference of phylogeny and its impact on evolutionary biology. Science. 2001;294:2310–2314. doi: 10.1126/science.1065889. [DOI] [PubMed] [Google Scholar]
- IUCN. 2012. IUCN red list of threatened species. Version 2012.1. Available online at: http://www.iucnredlist.org [Accessed on 15 October 2012]
- Keller C, Roos C, Groeneveld LF, Fischer J, Zinner D. Introgressive hybridization in southern African baboons shapes patterns of mtDNA variation. Am J Phys Anthropol. 2010;142:125–136. doi: 10.1002/ajpa.21209. [DOI] [PubMed] [Google Scholar]
- Kingdon J. The Kingdon field guide to African mammals. London: Academic Press; 1997. p. 496. [Google Scholar]
- Kingdon J, Butynski TM. 2008. Chlorocebus aethiops. In: IUCN 2012. IUCN red list of threatened species. Version 2012.1. Available online at: http://www.iucnredlist.org [Accessed on 03 August 2012]
- Kingdon J, Gippoliti S. 2008a. Chlorocebus sabaeus. In: IUCN 2012. IUCN red list of threatened species. Version 2012.1. Available online at: http://www.iucnredlist.org [Accessed on 03 August 2012]
- Kingdon J, Gippoliti S. 2008b. Chlorocebus tantalus. In: IUCN 2012. IUCN Red List of Threatened Species. Version 2012.1. Available online at: http://www.iucnredlist.org [Accessed on 03 August 2012]
- Kingdon J, Gippoliti S, Butynski TM, De Jong Y. 2008. Chlorocebus pygerythrus. In: IUCN 2012. IUCN red list of threatened species. Version 2012.1. Available online at: http://www.iucnredlist.org [Accessed on 03 August 2012]
- Lernould JM. Classification and geographical distribution of guenons: a review. In: Gautier-Hion A, Bourliere F, Gautier JP, Kingdon J, editors. A primate radiation: evolutionary biology of the African guenons. Cambridge: Cambridge University Press; 1988. pp. 54–78. [Google Scholar]
- Lorenzen ED, De Neergaard R, Arctander P, Siegismund HR. Phylogeography, hybridization and Pleistocene refugia of the kob antelope (Kobus kob. Mol Ecol. 2007;16:3241–3252. doi: 10.1111/j.1365-294X.2007.03382.x. [DOI] [PubMed] [Google Scholar]
- Mekonnen A, Bekele A, Fashing PJ, Hemson G, Atickem A. Diet, activity patterns, and ranging ecology of the Bale monkey (Chlorocebus djamdjamensis) in Odobullu Forest, Ethiopia. Int J Primatol. 2010a;31:339–362. [Google Scholar]
- Mekonnen A, Bekele A, Fashing PJ, Lernould J-M, Atickem A, Stenseth NC. Newly discovered Bale monkey populations in forest fragments in Southern Ethiopia: evidence of crop raiding, hybridization with grivets, and other conservation threats. Am J Primatol. 2012;74:423–432. doi: 10.1002/ajp.21999. [DOI] [PubMed] [Google Scholar]
- Mekonnen A, Bekele A, Hemson G, Teshome E, Atickem A. Population size and habitat preference of the vulnerable Bale monkey Chlorocebus djamdjamensis in Odobullu Forest and its distribution across the Bale Mountains, Ethiopia. Oryx. 2010b;44:558–563. [Google Scholar]
- Muwanika VB, Nyakaana S, Siegismund HR, Arctander P. Phylogeography and population structure of the common warthog (Phacochoerus africanus) inferred from variation in mitochondrial DNA sequences and microsatellite loci. Heredity. 2003;91:361–372. doi: 10.1038/sj.hdy.6800341. [DOI] [PubMed] [Google Scholar]
- Napier PH. Catalogue of primates in the British Museum (Natural History) and elsewhere in the British Isles. Part II: family Cercopithecidae, subfamily Cercopithecinae. London: British Museum (Natural History); 1981. pp. 149–169. [Google Scholar]
- Nsubuga AM, Robbins MM, Roeder AD, Morin PA, Boesch C, Vigilant L. Factors affecting the amount of genomic DNA extracted from ape feces and the identification of an improved sample storage method. Mol Ecol. 2004;13:2089–2094. doi: 10.1111/j.1365-294X.2004.02207.x. [DOI] [PubMed] [Google Scholar]
- Perelman P, Johnson WE, Roos C, Seuánez HN, Horvath JE, Moreira MAM, Kessing B, Pontius J, Roelke M, Rumpler Y, Schneider MPC, Silva A, O'Brien SJ, Pecon-Slattery J. A molecular phylogeny of living primates. PLoS Genet. 2011;7:e1001342. doi: 10.1371/journal.pgen.1001342. [DOI] [PMC free article] [PubMed] [Google Scholar]
- Posada D. jModelTest: phylogenetic model averaging. Mol Biol Evol. 2008;25:1253–1256. doi: 10.1093/molbev/msn083. [DOI] [PubMed] [Google Scholar]
- Rohland N, Hofreiter M. Ancient DNA extraction from bones and teeth. Nat Protoc. 2007;2:1756–1762. doi: 10.1038/nprot.2007.247. [DOI] [PubMed] [Google Scholar]
- Rohland N, Siedel H, Hofreiter M. Nondestructive DNA extraction method for mitochondrial DNA analyses of museum specimens. BioTechniques. 2004;36:814–821. doi: 10.2144/04365ST05. [DOI] [PubMed] [Google Scholar]
- Rohland N, Siedel H, Hofreiter M. A rapid column-based ancient DNA extraction method for increased sample throughput. Mol Ecol Res. 2010;10:677–683. doi: 10.1111/j.1755-0998.2009.02824.x. [DOI] [PubMed] [Google Scholar]
- Ronquist F, Huelsenbeck JP. MRBAYES 3: Bayesian phylogenetic inference under mixed models. Bioinformatics. 2003;19:1572–1574. doi: 10.1093/bioinformatics/btg180. [DOI] [PubMed] [Google Scholar]
- Roos C, Nadler T, Walter L. Mitochondrial phylogeny, taxonomy and biogeography of the silvered langur species group (Trachypithecus cristatus. Mol Phylogenet Evol. 2008;47:629–636. doi: 10.1016/j.ympev.2008.03.006. [DOI] [PubMed] [Google Scholar]
- Schwarz E. Die meerkatzen der Cercopithecus aethiops gruppe. Z Säugetierkd. 1926;1:28–46. [Google Scholar]
- Shimada MK. Geographic distribution of mitochondrial DNA variations among grivet (Cercopithecus aethiops aethiops) populations in Central Ethiopia. Int J Primatol. 2000;21:113–129. [Google Scholar]
- Shimada MK, Terao K, Shotake T. Mitochondrial sequence diversity within a subspecies of savanna monkeys (Cercopithecus aethiops) is similar to that between subspecies. J Hered. 2002;93:9–18. doi: 10.1093/jhered/93.1.9. [DOI] [PubMed] [Google Scholar]
- Switzer WM, Bhullar V, Shanmugam V, Cong M, Parekh B, Lerche NW, Yee JL, Ely JJ, Boneva R, Chapman LE, Folks TM, Heneine W. Frequent simian foamy virus infection in persons occupationally exposed to nonhuman primates. J Virol. 2004;78:2780–2789. doi: 10.1128/JVI.78.6.2780-2789.2004. [DOI] [PMC free article] [PubMed] [Google Scholar]
- Switzer WM, Salemi M, Shanmugam V, Cong M, Kuiken C, Bhullar V, Beer BE, Vallet D, Gautier-Hion A, Tooze Z, Villinger F, Holmes EC, Heneine W. Ancient co-speciation of simian foamy viruses and primates. Nature. 2005;434:376–380. doi: 10.1038/nature03341. [DOI] [PubMed] [Google Scholar]
- Swofford DL. PAUP*. Phylogenetic analysis using parsimony (*and other methods). Version 4. Sunderland, MA: Sinauer Associates; 2003. [Google Scholar]
- Tamura K, Peterson D, Peterson N, Stecher G, Nei M, Kumar S. MEGA5: molecular evolutionary genetics analysis using maximum likelihood, evolutionary distance, and maximum parsimony methods. Mol Biol Evol. 2011;28:2731–2739. doi: 10.1093/molbev/msr121. [DOI] [PMC free article] [PubMed] [Google Scholar]
- Tobe SS, Kitchener AC, Linacre AMT. Reconstructing mammalian phylogenies: a detailed comparison of the cytochrome b and cytochrome oxidase subunit I mitochondrial genes. PLoS One. 2010;5:e14156. doi: 10.1371/journal.pone.0014156. [DOI] [PMC free article] [PubMed] [Google Scholar]
- Tosi AJ, Buzzard PJ, Morales JC, Melnick DJ. Y-chromosome data and tribal affiliations of Allenopithecus and Miopithecus. Int J Primatol. 2002;23:1287–1299. [Google Scholar]
- van der Kuyl AC, Dekker JT, Goudsmit J. St. Kitts green monkeys originate from West Africa: genetic evidence from feces. Am J Primatol. 1996;40:361–364. doi: 10.1002/(SICI)1098-2345(1996)40:4<361::AID-AJP5>3.0.CO;2-W. [DOI] [PubMed] [Google Scholar]
- van der Kuyl AC, Kuiken CL, Dekker JT, Goudsmit J. Phylogeny of African monkeys based upon the mitochondrial 12s rRNA gene. J Mol Evol. 1995;40:173–180. doi: 10.1007/BF00167111. [DOI] [PubMed] [Google Scholar]
- VN Thinh, Rawson B, Hallam C, Kenyon M, Nadler T, Walter L, Roos C. Phylogeny and distribution of crested gibbons (genus Nomascus) based on mitochondrial cytochrome b gene sequence data. Am J Primatol. 2010;72:1047–1054. doi: 10.1002/ajp.20861. [DOI] [PubMed] [Google Scholar]
- Wertheim JO, Worobey M. A challenge to the ancient origin of SIVagm based on African green monkey mitochondrial genomes. PLoS Pathog. 2007;3:e95. doi: 10.1371/journal.ppat.0030095. [DOI] [PMC free article] [PubMed] [Google Scholar]
- Xing J, Wang H, Zhang Y, Ray DA, Tosi AJ, Disotell TR, Batzer MA. A mobile element based evolutionary history of guenons (tribe Cercopithecini) BMC Biol. 2007;5:5. doi: 10.1186/1741-7007-5-5. [DOI] [PMC free article] [PubMed] [Google Scholar]
- Zinner D, Groeneveld LF, Keller C, Roos C. Mitochondrial phylogeography of baboons (Papio spp.) – indication for introgressive hybridization? BMC Evol Biol. 2009a;9:83. doi: 10.1186/1471-2148-9-83. 1–15. [DOI] [PMC free article] [PubMed] [Google Scholar]
- Zinner D, Arnold ML, Roos C. Is the new primate genus Rungwecebus a baboon? PLoS One. 2009b;4:e4859. doi: 10.1371/journal.pone.0004859. [DOI] [PMC free article] [PubMed] [Google Scholar]
- Zinner D, Arnold ML, Roos C. The strange blood: natural hybridization in primates. Evol Anthropol. 2011;20:96–103. doi: 10.1002/evan.20301. [DOI] [PubMed] [Google Scholar]
- Zwickl DJ. Austin, TX: The University of Texas at Austin; 2006. Genetic algorithm approaches for the phylogenetic analysis of large biological sequence datasets under the maximum likelihood criterion. Ph.D. thesis. [Google Scholar]
Associated Data
This section collects any data citations, data availability statements, or supplementary materials included in this article.