

Abstract
Heterogeneity is a key feature of malignancy associated with adverse tumour biology. Quantifying heterogeneity could provide a useful non-invasive imaging biomarker. Heterogeneity on computed tomography (CT) can be quantified using texture analysis which extracts spatial information from CT images (unenhanced, contrast-enhanced and derived images such as CT perfusion) that may not be perceptible to the naked eye. The main components of texture analysis can be categorized into image transformation and quantification. Image transformation filters the conventional image into its basic components (spatial, frequency, etc.) to produce derived subimages. Texture quantification techniques include structural-, model- (fractal dimensions), statistical- and frequency-based methods. The underlying tumour biology that CT texture analysis may reflect includes (but is not limited to) tumour hypoxia and angiogenesis. Emerging studies show that CT texture analysis has the potential to be a useful adjunct in clinical oncologic imaging, providing important information about tumour characterization, prognosis and treatment prediction and response.
Keywords: Quantitative, imaging biomarker, tumour, computed tomography, heterogeneity, texture analysis, biology, prognosis, characterization, treatment response and prediction
Tumour heterogeneity
Heterogeneity is a well-recognized feature of malignancy that is associated with adverse tumour biology. Heterogeneity can be associated with variations in genomic subtypes, expression of growth and angiogenic factors and the tumoral microenvironment, which also result in regional variations within individual tumours in proliferation, cell death, metabolic activity, vascularity, etc.[1]. Vascular heterogeneity may cause localized reductions in blood flow leading to areas of hypoxia, which has been shown to be associated with an adverse tumour microenvironment, increased risk of invasion and metastasis, impaired delivery of chemotherapeutic agents, increased cellular resistance to chemotherapy and radiotherapy and inhibition of immune responses[2].
Tumour heterogeneity can be assessed using histologic or imaging data. However, until recently, imaging evaluation of heterogeneity has been limited to qualitative rather than quantitative assessments. Reasons could include lack of agreement on an objective quantitative methodology and uncertain links to the underlying tumour biology.
Histologic assessment offers direct evaluation and high spatial resolution of the tissue sample obtained from biopsy. Besides being invasive and difficult to obtain in certain situations, biopsy is subject to sampling errors. A recent study has highlighted the inaccuracies in determining tumour genomics from a single tumour biopsy resulting from intratumour heterogeneity[1]. This represents a major constraint to genomic-based personalized medicine and biomarker development.
Imaging can provide good spatial resolution and capture information that assesses whole tumour heterogeneity. Imaging is also minimally invasive or non-invasive, can be repeated and can cover multiple tumour sites. This article reviews the various published techniques and approaches for assessing tumour heterogeneity with CT along with their putative biological correlates and potential clinical roles as an imaging biomarker in cancer care. Current limitations, further developments and anticipated future directions are briefly discussed.
Advantages and limitations of CT as a tool for assessing tumour heterogeneity
CT is an excellent non-invasive imaging tool and because of its general availability and ease of use, it is the initial radiologic modality of choice in a number of oncologic assessments. CT is also routinely performed as part of positron emission tomography (PET)/CT examinations and the combination of CT heterogeneity and PET-based molecular markers provides a great opportunity for multi-parametric imaging assessment[4]. CT is a robust imaging technique in terms of reproducibility and standardized image acquisition protocols in both research and clinical settings, which are major criteria for any quantitative imaging technique as the measures need to be objective and reflect changes only due to biology. In addition to having good spatial resolution, the individual pixel intensity value within a CT image directly reflects the physical property (density) of the organs attenuating the X-ray beam. This makes the CT numbers reproducible and comparable, making it suitable for objective quantification of intra- and inter-patient variation, respectively. Use of CT for assessing tumour heterogeneity can be seen as an addition to existing CT-based imaging biomarkers, which to date have focused on measuring tumour size, attenuation and perfusion. To a large extent, the above advantages offset the main limitations of CT, most notably limited spatial resolution and reduced tissue contrast relative to techniques such as magnetic resonance imaging.
Heterogeneity on CT can be quantified using texture analysis (TA), which reflects the coarseness and regularity that results from local spatial variations in image brightness (an extension from measuring attenuation). CTTA can quantify image patterns perceived to be heterogeneous by radiologists. The utilization of CTTA in radiologic assessment has recently attracted a lot of attention. However, the use of CTTA as a heterogeneity measure for tumour characterization, prognosis and response evaluation is more demanding but, until recently, has received little attention. Linking heterogeneity measures from CTTA to plausible tumour biology is crucial. This has been a major constraint in the acceptance of CTTA techniques in clinical practice.
Technical considerations
Impact of image quality
Quantification of heterogeneity must take into account the potential impact of variation in CT image acquisition parameters (which will vary the image photon noise) including tube voltage, tube current, slice thickness, convolution kernel and pixel resolution. The use of noise reduction (denoising) techniques (e.g. Laplacian of Gaussian (LoG) filter using an edge detecting filter with Gaussian smoothing to get rid of high-frequency image photon noise) before quantification can improve the utility of the heterogeneity measures[3]. Some heterogeneity metrics may be more sensitive to variation in these image acquisition parameters, particularly when evaluating finer image features comparable with the resolution of CT (submillimetre voxel)[4]. Other factors that can affect quantification of heterogeneity include image artefacts, co-registration for longitudinal and histologic studies, the anatomic level at which tumour is delineated (whole tumour volume, largest cross-section or size of the subregions), the extent of which depends on the segmentation approach (manual, semi-automated or automated). All these factors influence heterogeneity metrics and some (more than others) are sensitive to tumour delineation.
Choice of images
There are 3 types of CT image that can be quantified for heterogeneity; unenhanced, contrast-enhanced and derived images (e.g. perfusion CT). Generally the choice of image depends on what is available in routine clinical practice. For example, if the clinical indication is for a PET/CT, then unenhanced low-dose CT (used for attenuation correction part of PET/CT) could be used to quantify heterogeneity. If the clinical indication is for a diagnostic CT, then these images could be used. An important consideration is that heterogeneity within unenhanced and contrast-enhanced images may provide different information as each indicates different components of the tissue (vascularity or lack of it) being imaged. Furthermore, perfusion CT acquisitions can provide an opportunity to quantify heterogeneity (e.g. blood flow, blood volume, permeability, mean transit time).
TA approaches for quantifying heterogeneity
TA evaluates the distribution of grey levels, coarseness and regularity. In some cases, tumour heterogeneity can be appreciated on routine visual assessment of medical images but if seen, standard CT software cannot effectively quantify this appearance. There are two important aspects to TA that can be used independently or in combination for the quantification of heterogeneity within medical images:
Image transformation. Feature extraction: to highlight the texture properties within a digital image
Quantification. Texture characterization: to determine to which category (normal vs abnormal, less vs more aggressive disease morphology) the texture region belongs
Image transformation
Much of the heterogeneity visible on CT represents photon noise, which can mask any underlying biological heterogeneity. By using filters that select for image features at larger scales (image transformation), TA can reduce the effect of photon noise and so improve the ability to assess and quantify tissue heterogeneity. Fourier and wavelet transforms are frequently used for TA. A full description of these methods can be found elsewhere[5–9]. Fourier methods describe an image in terms of frequencies that are determined by the sizes and shapes of features within the image. Wavelet methods have the added advantage of encapsulating information about the spatial location of image features in addition to their frequency characteristics. A wide range of wavelet transforms are available that have the advantage of representing textures at the most suitable scale (multi-resolution). Some wavelet methods are orthogonal (where the signal is decomposed in octaves) and therefore offer limited ability to selectively tune the filter to highlight image features of a particular size. This drawback can be avoided by choosing a non-orthogonal wavelet filter (e.g. LoG spatial filter)[10]. Fig. 1 provides an illustration of an image transformation approach using a LoG band-pass filter to extract features of fine, medium and coarse texture features.
Figure 1.

Conventional CT image of a CRC lesion (A) and corresponding images selectively displaying fine (B), medium (C) and coarse (D) texture obtained by using LoG filter values of 1.0 (width, 4 pixels or 3.9 mm), 1.5 (width, 6 pixels or 5.9 mm) and 2.5 (width, 12 pixels or 11.8 mm), respectively (courtesy of Professor Ashley Groves, Institute of Nuclear Medicine, University College Hospital, London, UK).
Quantification
There are several approaches to the derivation of parameters that quantify image texture, which are usually categorized as structural, model-based, statistical and frequency methods[11–14]. Structural approaches are useful when there is an idea of the definite shape of the object boundary under consideration and the probability of the chosen boundary to be placed at a particular location[15,16]. Functional or pathologic characteristics, which form the basis for most variations in medical images, do not have a constant shape. Model-based approaches represent texture using mathematical models such as fractal and stochastic models, and interpret texture by using images generated by models[17–20]. Besides being computationally complex and non-intuitive, model-based approaches lack orientation selectivity (non-directional) and are not suitable for describing local image structures[12]. There has been some interest in measuring the fractal dimension as an indicator of surface-texture complexity within medical images. The fractal dimension of a surface gives an indication of the resemblance between shapes seen at different scales[21–27]. Lacunarity (a measure of lumpiness) of the computed fractal dimension values in the image could be used to differentiate between two textures with similar/identical fractal dimension values.
Statistical approaches are based on representations of texture using the properties governing the distribution and relationships of grey-level values in the image. Frequency domain-based image power spectral analysis (analysing different bands of frequencies) has shown potential in assessing mechanical properties and mineral density within bone radiographs[28]. However, in medical image quantification, generally statistical methods have proved to be better than frequency domain power spectrum analysis, showing higher discrimination rates than transform-based and structural methods[29–31]. There are different order statistics (first-, second- and higher-order statistics) that basically differ in their approach to describing the image grey-level distribution, often displayed as a histogram. An image of the histogram of a filtered image (after image transformation) is given in Fig. 2. Numerous statistical and probabilistic parameters can be quantified from an image histogram. First-order statistics are based on the probability distributions of individual grey-level pixel values (mean, entropy–irregularity, uniformity–inhomogeneity), whereas second-order is based on the joint probability distributions of pairs of pixels (e.g. variance or standard deviation of the histogram, correlation, grey-level run length or co-occurrence matrices) and so on for higher-order statistics (e.g. third-order: skewness–asymmetry of the histogram, Fig. 3; fourth-order: kurtosis–peakedness or pointiness of the histogram, Fig. 4).
Figure 2.
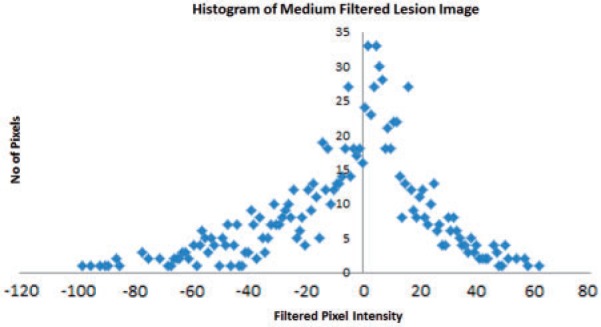
The histogram displays the range and frequency of pixel intensity values within the medium filtered (filter value 1.5) image of a CRC lesion (courtesy of Professor Ashley Groves, Institute of Nuclear Medicine, University College Hospital, London, UK).
Figure 3.
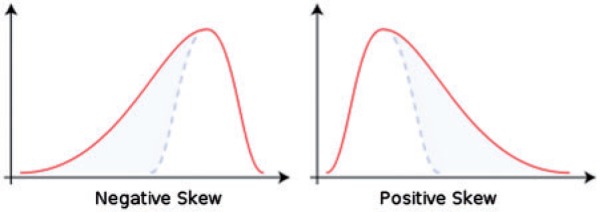
An illustration of positive and negative skewed histogram (courtesy of http://en.wikipedia.org/wiki/Skewness).
Figure 4.
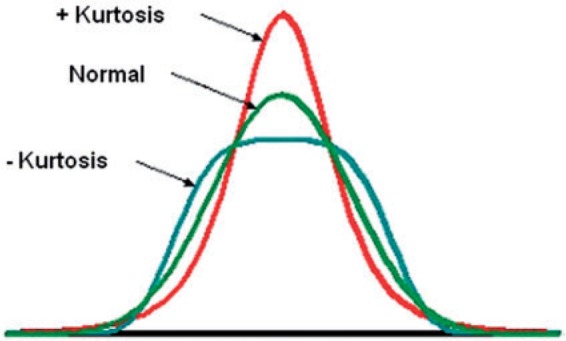
An illustration of positive and negative kurtosis (courtesy of http://en.wikipedia.org/wiki/Kurtosis).
First- and second-order measures are more commonly used in medical image TA. A co-occurrence matrix contains the probabilities for pairwise occurrences of grey values within the original image. In addition to being directionally dependent, a co-occurrence matrix has the disadvantage of being computationally more expensive. A number of metrics from the co-occurrence matrix are often derived to get a more useful set of features (e.g. Haralick features, which include entropy, contrast, variance, angular moment, correlation, mean and their derivatives)[32]. First- and second-order statistics are more useful when the histogram resembles a Gaussian (normal) distribution. When the image histogram is not Gaussian, higher-order statistics are needed to fully describe the distribution. In addition, higher-order statistics (such as skewness and kurtosis) are inherently normalized to the standard deviation of the overall image histogram making it less sensitive to the image noise in comparison with first- and second-order statistics. The different statistical parameters convey different image characteristics and may be useful in quantifying different aspects of heterogeneity in medical imaging.
Possible biological correlates for CTTA
An important step in establishing a biological rationale for radiologic features of heterogeneity (CTTA) is to determine potential histopathologic correlates of clinical significance with regard to prognosis or treatment selection. These include tumour grade, hypoxia, angiogenesis and specific genetic/molecular features. An area where heterogeneity is visually perceptible on CT imaging and used to assess disease severity is in cerebral glioma, where high-grade gliomas are noticeably more heterogeneous than low-grade tumours. A recent study highlighted the ability of TA to quantify this visually appreciable heterogeneity on CT, thereby distinguishing high-grade (more heterogeneous) from low-grade gliomas (less heterogeneous)[33]. This study suggested that CTTA may be particularly useful for identifying high-grade gliomas that appear radiologically as low grade or indeterminate. Similarly, radiologic texture measures of small adenocarcinomas of the lung on CT correlated with histologic tumour classification defined by Noguchi; solid-density texture appearance was associated with histologic type C, D and F and opaque ground-glass texture appearance was associated with histologic type A and B[34]. A preliminary study in patients with early breast cancer on PET/CT has shown that tumour heterogeneity assessed by CTTA may be associated with tumour grade[35].
The basis for imaging tumour heterogeneity with CT is that misshapen, irregular, disorganized and tortuous architecture arising from tumour-induced angiogenesis eventually results in the formation of hypoxic voids, necrosis and an acidic milieu. These pathologic features have a fundamental role in tumorigenesis and this adverse microenvironment results in increased tumour invasion and metastasis, tumour tissue swelling, impaired delivery of chemotherapeutic agent, increased cellular resistance to chemotherapy and radiotherapy and inhibition of immune responses[36,37]. We postulate that heterogeneity measured on CT could potentially be a reflection of the above complex vascular environment seen within malignant neoplasms. This hypothesis is supported by previous clinical studies that have identified biological correlates for CTTA, confirming an association between CT heterogeneity and a hypoxic and angiogenic tumour microenvironment. Tumour heterogeneity at medium and coarse texture scale on CT correlated with hypoxia in primary non-small cell lung cancer (NSCLC, which included both extrinsic and intrinsic histopathologic markers of hypoxia: pimonidazole and Glut-1) and colorectal cancer (which included hypoxia-inducible factor 1alpha, carbonic anhydrase IX, Glut-1)[38,39]. Previous simulated modelling studies have shown that vascular heterogeneity is reflected in CT measurements of hepatic texture (e.g. entropy)[40]. Furthermore, in patient studies, tumour heterogeneity at medium and coarse texture scales on CT correlated with angiogenesis in primary NSCLC and colorectal cancer (CRC)[38,39]. In this CRC study, heterogeneity on CT combined with glucose uptake on PET correlated with vascular endothelial growth factor[39].
Tumour heterogeneity assessed by CTTA has shown an association with hormone receptor status in patients with early breast cancer on PET/CT and therefore could potentially be a useful adjunct to PET/CT[35]. A recent study has also highlighted the potential advantages of incorporating CTTA into a multi-parametric imaging approach to understanding tumour biology by identifying an imaging signature for the V-Ki-ras2 Kirsten rat sarcoma viral oncogene homolog mutation in CRC based on combined CT heterogeneity, CT perfusion and PET fluorodeoxyglucose (FDG) uptake[41].
Emerging clinical applications of CTTA
Lesion detection and characterization
Computer-aided detection (CAD) is increasingly used in radiologic diagnosis. CAD is mostly used for automated detection of lesions, whilst leaving the decision of the nature of the lesion to a radiologist. Common areas for application of CAD include identifying lesions within the breast, lung, liver and colonic polyps. Image analysis methodologies that underpin CAD systems in the above clinical areas include density variations within masses at the pixel and region level, feature extraction, wavelet analysis, fractal dimensions, support vector machines, and artificial neural networks[42–69].
Identification of focal lesions depends on differences in texture features between the lesion and surrounding tissue, whereas characterizing a focal lesion relies on differences in texture features between various pathologies. Therefore the use of TA to characterize, rather than detect, focal lesions is more challenging.
Benign vs malignant
CTTA has been applied to pulmonary nodule classification as benign or malignant, mostly focusing on transform-based, fractal-based and statistical-based approaches[70]. Morphological and statistical-based texture measurements (surface smoothness and shape irregularity) of the lung nodule on CT showed diagnostic potential (area under the receiver operating characteristic curve = 0.857 ± 0.023)[71]. Textural features describing the grey-level spatial variation (correlation and entropy) between the neighbouring pixels in high-resolution CT images have been shown to differentiate malignant tumours from benign lesions with an accuracy of 90.3%72,73]. Furthermore, fractal dimensions were found to be higher in pneumonias/tuberculomas than carcinomas/hamartomas (P < 0.0001)[74].
TA (using wavelets techniques and artificial neural network-based decision algorithms) of hepatic CT images was able to classify visible focal lesions as benign or malignant (hepatocellular carcinoma and colorectal metastases) with a sensitivity of 75% and specificity of 88.1%75–78]. In another study, fractal dimensions and abundance were found to be significantly higher in colon cancer than normal bowel (P ≤ 0.001)[79]. In rectal cancer, fractal dimension was higher in malignant lymph nodes compared with benign nodes with an accuracy of 88%[80].
Disease severity
Quantitative measures of image heterogeneity (degree of irregularity and clumpiness within the tumour and fractal dimension of the border between tumour and neighbouring tissues) have characterized either expansive or infiltrative growth patterns of various tumours[81]. A previous study has shown that irregularity associated with degree of texture coarseness (combination of transform and statistical approaches) is associated with lung tumour stage (rs = 0.71, P = 0.001; kappa = 0.7, sensitivity = 100%, specificity = 87.5%, P = 0.0001) and glucose uptake measure (obtained from FDG-PET, rs = 0.51, P = 0.03)[82].
Another fractal-based approach to lung nodule characterization demonstrated higher fractal dimension in adenocarcinomas from squamous cells (P < 0.05) as well as bronchioalveolar from non-bronchioalveolar cell carcinomas (P < 0.0001)[74,83].
Direction-oriented texture parameters based on second-order statistical methods have been used to extract relevant textural features from apparently normal liver on CT to determine risk of disease recurrence in patients with metastatic CRC (confidence level >99%)[84].
Another recent study demonstrated using computationally less intensive first-order statistics (entropy, uniformity and mean grey-level intensity) applied to different degrees of texture coarseness (transform approach) derived from conventional hepatic CT having apparently normal liver morphology could classify patients with CRC with and without disease recurrence (patients with hepatic metastases compared with patients with no recurrence, P = 0.0257 and patients with extra-hepatic disease, P = 0.0143)[85].
Preliminary analysis has provided an early indication that CTTA can differentiate node-negative from node-positive CRC patients but more work needs to be undertaken to specifically look at Dukes B patients[86]. CTTA risk stratification for these patients could potentially have implications for selection of therapy.
Prognosis
Determining tumour prognosis from CT could potentially affect therapy selection for patients with cancer. The few studies that have explored this application have focused on transform, model and statistical approaches.
Portal phase hepatic CTTA (coarse uniformity) predicted CRC patient survival (P < 0.005) better than hepatic perfusion (P > 0.05)[87]. CTTA’s ability to stratify survival in non-metastatic CRC could potentially be used to modify the post-operative surveillance strategy for low-risk patients. Tumour heterogeneity assessed by TA of the CT component of PET/CT showed potential as an independent predictor of survival (in comparison with clinical stage, perfusion and glucose uptake, where available) in NSCLC (P = 0.001) and oesophageal cancer (P = 0.0006)[88–90]. A recent study highlighted that heterogeneity (CTTA) within the whole primary colorectal tumour on contrast-enhanced CT was a biomarker of 5-year survival independent of stage (P = 0.001)[91].
In another study on pre-therapy contrast-enhanced CT, heterogeneity assessed via CTTA was a marker of overall survival (P = 0.005) along with patient body mass index, tumour N-stage and primary mass size in patients with locally advanced squamous cell cancers of the head and neck treated with neoadjuvant chemotherapy[92].
Treatment planning and response
The potential for CTTA to assist in radiotherapy planning has been shown by a recent study in which PET/CT texture parameters extracted from second-order co-occurrence matrices were used to delineate the tumour in head and neck tumour regions[93]. The regions were similar to those of the radiation oncologists (sensitivity 90 ± 12% and specificity 95 ± 2%), suggesting that CTTA-based automatic tumour segmentation could potentially improve treatment planning accuracy[94]. By reflecting hypoxia, CTTA could feasibly be used to identify tumour subregions that are relatively resistant to treatment, allowing a local boost in radiation delivery (e.g. dose painting). The differences in CT texture shown for benign and malignant lung lesions suggests a potential role for CTTA in distinguishing NSCLC from adjacent consolidated lung.
The potential for CTTA to provide an early marker of tumour response is highlighted by a recent study demonstrating that change in CT texture on contrast-enhanced images after 2 cycles of treatment with tyrosine kinase inhibitor in patients with metastatic renal cancer was an independent predictor of time to progression (P = 0.008)[95]. CTTA was more closely associated with clinical outcome than existing imaging size criteria (i.e. RECIST) and response assessments based on combinations of size and enhancement (Choi and modified Choi criteria). The implication of this study for patient care is that addition of CTTA to standard response assessment may improve the prediction of response to tyrosine kinase inhibitors in metastatic renal cell carcinoma. This could further help with optimal use and/or modification of the treatment regime using this novel, expensive and highly toxic drug based on individual patient response to treatment.
Health-economic analysis of CTTA
Cost-effectiveness studies are not only used to guide clinical practice but also to highlight the need to prioritize clinical trials on the basis of potential impact in clinical practice. A recent economic analysis of the impact of CTTA-based surveillance strategies in colorectal cancer indicated the potential economic benefits of reducing the frequency of carcinoembryonic antigen (CEA) ± CT in low-risk CRC patients as determined by CTTA. A CTTA-based surveillance strategy produced a minimal increase in mortality at 5 years (74.2% versus 73.9%) and a minimal reduction in average life expectancy (10–11 days) but with cost savings of up to £1248 per patient and net monetary benefit of £427 per patient (i.e. cost-effective; based on a willingness to pay £30,000 per life year)[96]. In another economic analysis study, CTTA-based strategies for selection of chemotherapy for patients with advanced NSCLC produced cost savings of £485 to £966 per patient, with a minimal reduction in quality-adjusted survival of 0.01–0.02 quality-adjusted life years, indicating a net monetary benefit of £264 to £544 per patient[97]. Given these potential savings, further large-scale studies to confirm the ability of CTTA to stratify patients with CRC and NSCLC should be prioritized. Similar cost-effectiveness studies in other applications of CTTA need to be undertaken.
Limitations, future research and developments, and anticipated direction
The previous sections have highlighted the possible biological correlates and potential clinical applications of CTTA in disease characterization, prognosis and treatment prediction, and response evaluation. However, the precise relationship between CTTA and tissue microstructure is less well defined. A previous computer-simulated study showed that liver texture on CT may reflect hepatic vascularity[40]. A recent study on simulated CT image of an object phantom indicated that CTTA measurements (uniformity and average brightness after image filtration) are sensitive to variations in the concentration and size of objects, respectively, which can potentially be considered to reflect the degree of image heterogeneity[98]. Development of a physical heterogeneity phantom that can simulate real CT images of soft tissue and tumour as closely as possible is needed.
The impact of CT image acquisition parameters on CTTA measurements of heterogeneity is an important consideration in the development of texture-based imaging biomarkers. This is especially the case for therapeutic and longitudinal studies whereby change in CTTA measurements of heterogeneity need to be related to biology rather than variation in image or scanner characteristics. A previous study highlighted that CTTA (measured as uniformity and average brightness after image filtration) from a water phantom was reasonably insensitive (a coefficient of variation consistently less than 5% was achieved) to image acquisition parameters (tube voltage, tube current and slice thickness)[87]. The impact of CT image photon noise is further reduced in CTTA methodologies that use initial image transformation techniques (e.g. band-pass image filtration). Such an approach has the desired capability to independently assess and extract fine, medium and coarse textures, where the fine texture is most influenced by image photon noise (i.e. image quality or the radiologist’s perception of visual heterogeneity) and medium to coarse texture reflects underlying relevant biological heterogeneity. Another important consideration is to assess inter- and intra-observer variation in the CTTA processing, particularly regarding the delineation of regions or volumes of interest. This source of variation is reduced by semi-automated and automated approaches to delineation of tumour regions or volumes. Although CT is a fairly robust imaging modality in which clinical protocols are consistently followed in routine practice and the CT image pixel values represent the tissue density (Hounsfield units), there is still a need to confirm the reproducibility (test re-test studies) of heterogeneity quantification via CTTA. With the current momentum generated around heterogeneity quantification, commercial clinical software platforms for CTTA are becoming available. Furthermore, there will be a need for standardization of CTTA in heterogeneity quantification both in terms analysis methodology and across different equipment manufacturers.
Dynamic CTTA to assess temporal changes in tumour heterogeneity after administration of contrast material could provide another dimension in the physiologic assessment of tumours. Preliminary studies indicate the potential of temporal changes in hepatic texture to provide diagnostic and prognostic information and increase the utility of contrast-enhanced CT[86,99]. Particularly change in fine texture within apparently normal liver between images acquired pre-contrast and at 26–30 s after contrast injection identified patients with node-positive CRC with 100% sensitivity and 71% specificity[86].
Heterogeneity is found across the entire volume of tumour. Measuring volumetric heterogeneity via CTTA may therefore provide an opportunity to extract even more subtle variations potentially providing a more robust association with histopathology and clinical outcomes[91,100]. As the large numbers of finely collimated images produced by current CT systems render CTTA more extensive and time consuming, developments that make CTTA less computationally expensive will be required for widespread use of volumetric analysis in clinical practice.
Conclusions
CTTA represents a novel imaging approach that can potentially help address clinically important areas in cancer imaging. CTTA can be easily incorporated into imaging workflows at very little additional cost and increase the utility of images acquired in routine clinical practice. CTTA can potentially be used as a non-invasive imaging biomarker in tumour characterization, prognosis and treatment prediction, and response evaluation. With standardization and refinement of existing applications and further novel developments, CTTA is set to emerge as a valuable tool in oncologic imaging.
Conflict of interest
Dr Balaji Ganeshan and Professor Ken Miles are directors and shareholders of TexRAD Ltd, a company developing and commercializing a novel texture analysis software in oncology.
Footnotes
This paper is available online at http://www.cancerimaging.org. In the event of a change in the URL address, please use the DOI provided to locate the paper.
References
- 1.Nelson DA, Tan TT, Rabson AB, Anderson D, Degenhardt K, White E. Hypoxia and defective apoptosis drive genomicin stability and tumourigenesis. Genes Dev. 2004;18:2095–2107. doi: 10.1101/gad.1204904. . PMid:15314031. [DOI] [PMC free article] [PubMed] [Google Scholar]
- 2.Gerlinger M, Rowan AJ, Horswell S, et al. Intratumor heterogeneity and branched evolution revealed by multiregion sequencing. N Engl J Med. 2012;366:883–892. doi: 10.1056/NEJMoa1113205. . PMid:22397650. [DOI] [PMC free article] [PubMed] [Google Scholar]
- 3.Ganeshan B, Hosur A, Skogen K, Tasker F, Dizdarevic S, Miles KA. Multi-parametric FDG PET-CT in thoracic malignancies: opportunities for combined prognostic imaging biomarkers; Presented at: UK Radiological Congress 2012, Manchester, UK. [Google Scholar]
- 4.Cubitt G. Investigation of texture analysis for assessing image quality of CT pancreas examinations. MSc thesis. University College London, London, UK; 2006. [Google Scholar]
- 5.Rosenfeld A, Weszka J. Picture recognition. In: Fu K, editor. Digital pattern recognition. Heidelberg: Springer-Verlag; 1980. pp. p. 135–166. [Google Scholar]
- 6.Mallat S. Multi-frequency channel decomposition of images and wavelet models. IEEE Trans Acoustic Speech Signal Processing. 1989;37:2091–2110. doi: 10.1109/29.45554. [DOI] [Google Scholar]
- 7.Laine A, Fan J. Texture classification by wavelet packet signatures. IEEE Trans Pattern Anal Machine Intelligence. 1993;15:1186–1191. doi: 10.1109/34.244679. [DOI] [Google Scholar]
- 8.Lu C, Chung P, Chen C. Unsupervised texture segmentation via wavelet transform. Pattern Recognition. 1997;30:729–742. doi: 10.1016/S0031-3203(96)00116-1. [DOI] [Google Scholar]
- 9.Strang G, Nguyen T. Wavelets and filter banks. Wellesley, MA: Wellesley-Cambridge Press; 1996. [Google Scholar]
- 10.Marr D. Representing the image: zero-crossings and the raw primal sketch. In: Wilson J, Monsour P, editors. Vision. San Francisco: WH Freeman; 1982. pp. p. 54–68. [Google Scholar]
- 11.Castellano G, Bonhilha L, Li LM, Cendes F. Texture analysis of medical images. Clin Radiol. 2004;59:1061–1069. doi: 10.1016/j.crad.2004.07.008. . PMid:15556588. [DOI] [PubMed] [Google Scholar]
- 12.Materka A, Strzelecki M. Texture analysis methods – a review. Institute of Electronics, Technical University of Lodz, Brussels; 1998. [Google Scholar]
- 13.Van Gool L, Dewaele P, Oosterlink A. Texture analysis Anno 1983. Computer Vision Graphics Image Processing. 1985;29:337–357. [Google Scholar]
- 14.Reed TR, Hans Du Bui JM. A review of recent texture segmentation and feature extraction techniques. Computer Vision Graphics Image Processing. 1993;57:359–372. [Google Scholar]
- 15.Haralick R. Statistical and structural approaches to texture. Proc IEEE. 1979;67:786–804. doi: 10.1109/PROC.1979.11328. [DOI] [Google Scholar]
- 16.Levine M. Vision in man and machine. New York: McGraw-Hill; 1985. [Google Scholar]
- 17.Cross G, Jain A. Markov random field texture models. IEEE Trans Pattern Anal Machine Intell. 1983;PAMI-5:25–39. doi: 10.1109/TPAMI.1983.4767341. [DOI] [PubMed] [Google Scholar]
- 18.Pentland A. Fractal-based description of natural scenes. IEEE Trans Pattern Anal Machine Intell. 1984;6:661–674. doi: 10.1109/TPAMI.1984.4767591. [DOI] [PubMed] [Google Scholar]
- 19.Chellappa R, Chatterjee S. Classification of textures using Gaussian Markov Random Fields. IEEE Trans Acoustic Speech Signal Processing. 1985;33:959–963. doi: 10.1109/TASSP.1985.1164641. [DOI] [Google Scholar]
- 20.Derin H, Elliot H. Modelling and segmentation of noisy and textured images using Gibbs Random Fields. IEEE Trans Pattern Anal Machine Intell. 1987;9:39–55. doi: 10.1109/TPAMI.1987.4767871. [DOI] [PubMed] [Google Scholar]
- 21.Sarkar N, Chaudhuri BB. An efficient differential box-counting approach to compute fractal dimension of image. IEEE Trans Systems Man Cybernetics. 1994;24:115–120. doi: 10.1109/21.259692. [DOI] [Google Scholar]
- 22.Buczkowski S, Kyriacos S, Nekka F, Cartilier L. The modified box counting method: analysis of some characteristic parameters. Pattern Recognition. 1998;31:411–418. doi: 10.1016/S0031-3203(97)00054-X. [DOI] [Google Scholar]
- 23.Keller JM, Chen S, Crownover RM. Texture description and segmentation through fractal geometry. Computer Vision Graphics Image Processing. 1989;45:150–166. doi: 10.1016/0734-189X(89)90130-8. [DOI] [Google Scholar]
- 24. Feng J, Lin WC, Chen CT. Functional box-counting approach to fractal dimension estimation. In: Proceedings of the 13th International Conference on Pattern Recognition (ICPR), vol. 2. Los Alamitos, CA: IEEE Computer Society Press; 1996; p. 854–858.
- 25.Chen SS, Keller JM, Crownover RM. On the calculation of fractal features from images. IEEE Trans Pattern Anal Machine Intell. 1993;15:1087–1090. doi: 10.1109/34.254066. [DOI] [Google Scholar]
- 26.Traina CJ, Traina A, Wu L, Faloutsos C. Proceedings of the 15th Brazilian Symposium on Databases. 2000. Fast feature selection using fractal dimension; pp. 158–171. [Google Scholar]
- 27.Penn AI, Loew MH. Estimating fractal dimension with fractal interpolation function models. IEEE Trans Med Imaging. 1997;16:930–937. doi: 10.1109/42.650889. . PMid:9533593. [DOI] [PubMed] [Google Scholar]
- 28.Millard J, Augat P, Link TM, et al. Power spectral analysis of vertebral trabecular bone structure from radiographs: orientation dependence and correlation with bone mineral density and mechanical properties. Calcif Tissue Int. 1998;63:482–489. doi: 10.1007/s002239900562. . PMid:9817942. [DOI] [PubMed] [Google Scholar]
- 29.Coleman AJ, Tonge KA, Rankin SC. The power spectral density as a measure in computed tomographic scans of liver. Br J Radiol. 1982;55:601–603. doi: 10.1259/0007-1285-55-656-601. . PMid:7116093. [DOI] [PubMed] [Google Scholar]
- 30.Weszaka JS, Dyer CR, Rosenfeld A. A comparative study of texture measures for terrain classification. IEEE Trans Systems Man Cybernetics. 1976;6:269–285. [Google Scholar]
- 31.Conners RW, Harlow CA. A theoretical comparison of texture algorithms. IEEE Trans Pattern Anal Machine Intell. 1980;PAMI-2:204–222. doi: 10.1109/TPAMI.1980.4767008. [DOI] [PubMed] [Google Scholar]
- 32.Haralick RM, Shanmugam K, Dinstein I. Textural features for image classification. IEEE Trans Systems Man Cybernetics. 1973;3:610–621. doi: 10.1109/TSMC.1973.4309314. [DOI] [Google Scholar]
- 33.Skogen K, Ganeshan B, Good T, Critchley G, Miles KA. Measurements of heterogeneity in gliomas on computed tomography relationship to tumour grade. J Neurooncol. 2013;111:213–219. doi: 10.1007/s11060-012-1010-5. . PMid:23224678. [DOI] [PubMed] [Google Scholar]
- 34.Shimizu K, Yamada K, Noda K. Computed tomography analysis of resected small adenocarcinomas of the lung less than 15 mm in diameter–correlation of radiologic and histologic characteristics. Nihon Kokyuki Gakkai Zasshi. 1998;36:672–678. [in Japanese] [PubMed] [Google Scholar]
- 35.Ganeshan B, Keshtgar MR, Endozo R, Meagher M, Malhotra A, Miles KA. CT texture analysis as an adjunct to PET-CT in early breast cancer: a potential marker of tumour receptor status and grade; In: UK Radiological Congress 2012. Manchester, UK. [Google Scholar]
- 36.Folkman J. Tumor angiogenesis: therapeutic implications. N Engl J Med. 1971;285:1182–1181. doi: 10.1056/NEJM197111182852108. PMid:4938153. [DOI] [PubMed] [Google Scholar]
- 37.Swinson DE, O’Byrne KJ. Interactions between hypoxia and epidermal growth factor receptor in non-small cell lung cancer. Clin Lung Cancer. 2006;7:250–256. doi: 10.3816/CLC.2006.n.002. . PMid:16512978. [DOI] [PubMed] [Google Scholar]
- 38.Ganeshan B, Goh V, Mandeville HC, Ng QS, Hoskin PJ, Miles KA. Non-small cell lung cancer: histopathologic correlates for texture parameters at CT. Radiology. 2013;266:326–336. doi: 10.1148/radiol.12112428. . PMid:23169792. [DOI] [PubMed] [Google Scholar]
- 39.Quantitative Imaging Biomarkers from PET-CT as potential correlates for Angiogenesis and Hypoxia in Colorectal Cancer; In European Congress of Radiology 2012, Vienna, Austria. [Google Scholar]
- 40.Bezy-Wendling J, Kretowski M, Rolland Y, Le Bidon W. Towards a better understanding of texture in vascular CT scan simulated images. IEEE Trans Biomed Eng. 2001;48:120–124. doi: 10.1109/10.900272. . PMid:11235585. [DOI] [PubMed] [Google Scholar]
- 41.Ganeshan B, Miles K, Ziauddin Z, Engledow A, Rodriquez-Justo M, Groves A. Identification of KRAS mutation in colorectal cancer by multi-parametric PET-CT; In: International Cancer Imaging Society (ICIS) 2012; Oxford, UK. [Google Scholar]
- 42.Bilello M, Gokturk SB, Desser T, Napel S, Jeffrey RB, Jr, Beaulieu CF. Automatic detection and classification of hypodense hepatic lesions on contrast-enhanced venous-phase CT. Med Phys. 2004;31:2584–2593. doi: 10.1118/1.1782674. [DOI] [PubMed] [Google Scholar]
- 43. AfaqHussain S, Shigeru E. Use of neural networks for feature based recognition of liver region on CT images. Neural networks for signal processing X, 2000. Proceedings of the 2000 IEEE Signal Processing Society Workshop, vol. 2. 2000; p. 831–840.
- 44.Mala K, Sadasivam V. Automatic segmentation and classification of diffused liver diseases using wavelet based texture analysis and neural network. INDICON, 2005 Annual IEEE; p. 216–219. [Google Scholar]
- 45.Gupta R, Undrill PE. The use of texture analysis to delineate suspicious masses in mammography. Phys Med Biol. 1995;40:835–855. doi: 10.1088/0031-9155/40/5/009. . PMid:7652011. [DOI] [PubMed] [Google Scholar]
- 46.Wei D, Chan HP, Helvie MA, et al. Classification of mass and normal breast tissue on digital mammograms: multiresolution textureanalysis. Med Phys. 1995;22:1501–1513. doi: 10.1118/1.597418. . PMid:8531882. [DOI] [PubMed] [Google Scholar]
- 47.Byng JW, Boyd NF, Fishell E, Jong RA, Yaffe MJ. Automated analysis of mammographic densities. Phys Med Biol. 1996;41:909–923. doi: 10.1088/0031-9155/41/5/007. . PMid:8735257. [DOI] [PubMed] [Google Scholar]
- 48.Thiele DL, Kimme-Smith C, Johnson TD, McCombs M, Bassett LW. Using tissue texture surrounding calcification clusters to predict benign vs malignant outcomes. Med Phys. 1996;23:549–555. doi: 10.1118/1.597901. . PMid:9157269. [DOI] [PubMed] [Google Scholar]
- 49.Sahiner B, Chan HP, Petrick N, Helvie MA, Goodsitt MM. Computerized characterization of masses on mammograms: the rubber band straightening transform and texture analysis. Med Phys. 1998;25:516–526. doi: 10.1118/1.598228. . PMid:9571620. [DOI] [PubMed] [Google Scholar]
- 50.Sahiner B, Chan HP, Petrick N, Helvie MA, Hadjiiski LM. Improvement of mammographic mass characterization using spiculation meausures and morphological features. Med Phys. 2001;28:1455–1465. doi: 10.1118/1.1381548. . PMid:11488579. [DOI] [PubMed] [Google Scholar]
- 51.Brake GM, Karssemeijer N, Hendriks JH. An automatic method to discriminate malignant masses from normal tissue in digital mammograms. Phys Med Biol. 2000;45:2843–2857. doi: 10.1088/0031-9155/45/10/308. [DOI] [PubMed] [Google Scholar]
- 52.Mudigonda NR, Rangayyan RM, Desautels JE. Gradient and texture analysis for the classification of mammographic masses. IEEE Trans Med Imaging. 2000;19:1032–1043. doi: 10.1109/42.887618. PMid:11131493. [DOI] [PubMed] [Google Scholar]
- 53.Mudigonda NR, Rangayyan RM, Desautels JE. Detection of breast masses in mammograms by density slicing and texture flow-field analysis. IEEE Trans Med Imaging. 2001;20:1215–1227. doi: 10.1109/42.974917. . PMid:11811822. [DOI] [PubMed] [Google Scholar]
- 54.Gulsrud TO, Husøy JH. Optimal filter-based detection of microcalcifications. IEEE Trans Biomed Eng. 2001;48:1272–1281. doi: 10.1109/10.959323. . PMid:11686626. [DOI] [PubMed] [Google Scholar]
- 55.Rangayyan RM, Prajna S, Ayres FJ, Desautels JE. Detection of architectural distortion in prior screening mammograms using Gabor filters, phase portraits, fractal dimension and texture analysis. Int J Comput Assist Radiol Surg. 2008;2:347–361. doi: 10.1007/s11548-007-0143-z. [DOI] [PubMed] [Google Scholar]
- 56.Guo Q, Shao J, Ruiz VF. Characterization and classification of tumor lesions using computerized fractal based texture analysis and support vector machines in digital mammograms. Int J Comput Assist Radiol Surg. 2009;4:11–25. doi: 10.1007/s11548-008-0276-8. . PMid:20033598. [DOI] [PubMed] [Google Scholar]
- 57.Giger ML, Bae KT, MacMahon H. Computerized detection of pulmonary nodules in computed tomography images. Invest Radiol. 1994;29:459–465. doi: 10.1097/00004424-199404000-00013. . PMid:8034453. [DOI] [PubMed] [Google Scholar]
- 58.Armato SG, III, Giger ML, MacMahon H. Automated detection of lung nodules in CT scans: preliminary results. Med Phys. 2001;28:1552–1561. doi: 10.1118/1.1387272. . PMid:11548926. [DOI] [PubMed] [Google Scholar]
- 59.Lou S-L, Chang C-L, Lin K-P, Chen T-S. Object-based deformation technique for 3-D CT lung nodule detection. SPIE Proc. 1999;3661:1544–52. [Google Scholar]
- 60.Brown MS, McNitt-Gray MF, Goldin JG, et al. Patient-specific models for lung nodule detection and surveillance in CT images. IEEE Trans Med Imaging. 2001;20:1242–1250. doi: 10.1109/42.974919. . PMid:11811824. [DOI] [PubMed] [Google Scholar]
- 61.Cavouras D, Prassopoulos P, Pantelidis N. Image analysis methods for solitary pulmonary nodule characterization by computed tomography. Eur J Radiol. 1992;14:169–172. doi: 10.1016/0720-048X(92)90079-O. . PMid:1563422. [DOI] [PubMed] [Google Scholar]
- 62.Henschke CI, Yankelevitz DF, Mateescu I, et al. Neural networks for the analysis of small pulmonary nodules. Clin Imaging. 1997;21:390–399. doi: 10.1016/S0899-7071(97)81731-7. . PMid:9391729. [DOI] [PubMed] [Google Scholar]
- 63.McNitt-Gray MF, Hart EM, Wyckoff N, et al. A pattern classification approach to characterizing solitary pulmonary nodules imaged on high resolution CT: preliminary results. Med Phys. 1999;26:880–888. doi: 10.1118/1.598603. . PMid:10436888. [DOI] [PubMed] [Google Scholar]
- 64.Armato SG, III, Li F, Giger ML, et al. Lung cancer: performance of automated lung nodule detection applied to cancers missed in a CT screening program. Radiology. 2002;225:685–692. doi: 10.1148/radiol.2253011376. . PMid:12461246. [DOI] [PubMed] [Google Scholar]
- 65.Armato SG, III, Altman MB, La Riviere PJ. Automated detection of lung nodules in CT scans: effect of image reconstruction algorithm. Med Phys. 2003;30:461–472. doi: 10.1118/1.1544679. . PMid:12674248. [DOI] [PubMed] [Google Scholar]
- 66.Mang T, Bogoni L, Salganicoff M, et al. Computer-aided detection of colorectal polyps in CT colonography with and without fecal tagging: a stand-alone evaluation. Invest Radiol. 2012;47:99–108. doi: 10.1097/RLI.0b013e31822b41e1. . PMid:21934519. [DOI] [PubMed] [Google Scholar]
- 67.Lawrence EM, Pickhardt PJ, Kim DH, Robbins JB. Colorectal polyps: stand-alone performance of computer-aided detection in a large asymptomatic screening population. Radiology. 2010;256:791–798. doi: 10.1148/radiol.10092292. . PMid:20663973. [DOI] [PubMed] [Google Scholar]
- 68.Li J, Van Uitert R, Yao J, Petrick N, Franaszek M, Huang A, Summers RM. Wavelet method for CT colonography computer-aided polyp detection. Med Phys. 2008;35:3527–3538. doi: 10.1118/1.2938517. . PMid:18777913. [DOI] [PMC free article] [PubMed] [Google Scholar]
- 69.Halligan S, Mallett S, Altman DG, et al. Incremental benefit of computer-aided detection when used as a second and concurrent reader of CT colonographic data: multi-observer study. Radiology. 2011;258:469–476. doi: 10.1148/radiol.10100354. . PMid:21084409. [DOI] [PubMed] [Google Scholar]
- 70.Farag A, Elhabian S, Graham J, Farag A, Falk R. Toward precise pulmonary nodule descriptors for nodule type classification. Med Image Comput Assist Interv. 2010;13:626–633. doi: 10.1007/978-3-642-15711-0_78. [DOI] [PubMed] [Google Scholar]
- 71.Way TW, Sahiner B, Chan HP, et al. Computer-aided diagnosis of pulmonary nodules on CT scans: improvement of classification performance with nodule surface features. Med Phys. 2009;36:3086–3098. doi: 10.1118/1.3140589. . PMid:19673208. [DOI] [PMC free article] [PubMed] [Google Scholar]
- 72.Petkovska I, Shah SK, McNitt-Gray MF, et al. Pulmonary nodule characterization: a comparison of conventional with quantitative and visual semi-quantitative analyses using contrast enhancement maps. Eur J Radiol. 2006;59:244–252. doi: 10.1016/j.ejrad.2006.03.005. . PMid:16616822. [DOI] [PMC free article] [PubMed] [Google Scholar]
- 73.McNitt-Gray MF, Hart EM, Wyckoff N, Sayre JW, Goldin JG, Aberle DR. A pattern classification approach to characterizing solitary pulmonary nodules imaged on high resolution CT: preliminary results. Med Phys. 1999;26:880–888. doi: 10.1118/1.598603. . PMid:10436888. [DOI] [PubMed] [Google Scholar]
- 74.Kido S, Kuriyama K, Higashiyama M, Kasugai T, Kuroda C. Fractal analysis of small peripheral pulmonary nodules in thin-section CT: evaluation of the lung-nodule interfaces. J Comput Assist Tomogr. 2002;26:573–578. doi: 10.1097/00004728-200207000-00017. . PMid:12218822. [DOI] [PubMed] [Google Scholar]
- 75.Huang YL, Chen JH, Shen WC. Diagnosis of hepatic tumors with texture analysis in non enhanced computed tomography images. Acad Radiol. 2006;13:713–720. doi: 10.1016/j.acra.2005.07.014. . PMid:16679273. [DOI] [PubMed] [Google Scholar]
- 76.Bilello M, Gokturk SB, Desser T, Napel S, Jeffrey RB, Jr, Beaulieu CF. Automatic detection and classification of hypodense hepatic lesions on contrast-enhanced venous-phase CT. Med Phys. 2004;31:2584–2593. doi: 10.1118/1.1782674. . PMid:15487741. [DOI] [PubMed] [Google Scholar]
- 77.Gletsos M, Mougiakakou SG, Metsopoulos GK, Nikita KS, Nikita AS, Kelekis D. A computer-aided diagnostic system to characterize CT focal liver lesions: design and optimization of a neural network classifier. IEEE Trans Inf Technol Biomed. 2003;7:153–162. doi: 10.1109/TITB.2003.813793. . PMid:14518728. [DOI] [PubMed] [Google Scholar]
- 78.Klein HM, Klose KC, Eisele T, Brenner M, Ameling W, Günther RW. The diagnosis of focal liver lesions by the texture analysis of dynamic computed tomograms. Rofo. 1993;159:10–15. doi: 10.1055/s-2008-1032713. . PMid:8334247. [DOI] [PubMed] [Google Scholar]
- 79.Goh V, Sanghera B, Wellsted DM, Sundin J, Halligan S. Assessment of the spatial pattern of colorectal tumour perfusion estimated at perfusion CT using two-dimensional fractal analysis. Eur Radiol. 2009;19:1358–1365. doi: 10.1007/s00330-009-1304-y. . PMid:19190914. [DOI] [PubMed] [Google Scholar]
- 80.Cui C, Cai H, Liu L, Li L, Tian H, Li L. Quantitative analysis and prediction of regional lymph node status in rectal cancer based on computed tomography imaging. Eur Radiol. 2011;21:2318–2325. doi: 10.1007/s00330-011-2182-7. . PMid:21713526. [DOI] [PubMed] [Google Scholar]
- 81.Shac YZ, Liu LZ, Wang FH, Cui CY, Bie MJ, Zhong WR, Li L. Quantitative evaluation of CT-MRI images of various tumors with expansive or infiltrative growth pattern. Zhonghua Yi Xue Za Zhi. 2008;88:1503–1506. PMid:18953860. [PubMed] [Google Scholar]
- 82.Ganeshan B, Abaleke S, Young RC, Chatwin CR, Miles KA. Texture analysis of non-small cell lung cancer on unenhanced computed tomography: initial evidence for a relationship with tumour glucose metabolism and stage. Cancer Imaging. 2010;10:137–143. doi: 10.1102/1470-7330.2010.0021. . PMid:20605762. [DOI] [PMC free article] [PubMed] [Google Scholar]
- 83.Kido S, Kuriyama K, Higashiyama M, Kasugai T, Kuroda C. Fractal analysis of internal and peripheral textures of small peripheral bronchogenic carcinomas in thin-section computed tomography: comparison of bronchioalveolar cell carcinomas with non-bronchioalveolar cell carcinomas. J Comput Assist Tomogr. 2003;27:56–61. doi: 10.1097/00004728-200301000-00011. . PMid:12544244. [DOI] [PubMed] [Google Scholar]
- 84.Mir AH, Hanmandlu M, Tandon SN. Texture analysis of CT-images for early detection of liver malignancy. Biomed Sci Instrum. 1995;31:213–217. PMid:7654965. [PubMed] [Google Scholar]
- 85.Ganeshan B, Miles KA, Young RC, Chatwin CR. Texture analysis in non-contrast enhanced CT: impact of malignancy on texture in apparently disease-free areas of the liver. Eur J Radiol. 2009;70:101–110. doi: 10.1016/j.ejrad.2007.12.005. . PMid:18242909. [DOI] [PubMed] [Google Scholar]
- 86.Ganeshan B, Burnand K, Young R, Chatwin C, Miles K. Dynamic contrast-enhanced texture analysis of the liver: initial assessment in colorectal cancer. Invest Radiol. 2011;46:160–168. doi: 10.1097/RLI.0b013e3181f8e8a2. . PMid:21102348. [DOI] [PubMed] [Google Scholar]
- 87.Miles KA, Ganeshan B, Griffiths MR, Young RCD, Chatwin CR. Colorectal cancer: texture analysis of portal phase hepatic CT images as a potential marker of survival. Radiology. 2009;250:444–452. doi: 10.1148/radiol.2502071879. . PMid:19164695. [DOI] [PubMed] [Google Scholar]
- 88.Ganeshan B, Panayiotou E, Burnand K, Dizdarevic S, Miles K. Tumour heterogeneity in non-small cell lung carcinoma assessed by CT texture analysis: a potential marker of survival. Eur Radiol. 2012;22:796–802. doi: 10.1007/s00330-011-2319-8. . PMid:22086561. [DOI] [PubMed] [Google Scholar]
- 89.Win T, Miles KA, James SM, et al. Tumor heterogeneity and permeability as measured on the CT component of PET/CT predicts survival in patients with non-small cell lung cancer. Clin Cancer Res. 2012 doi: 10.1158/1078-0432.CCR-12-1307. submitted. [DOI] [PubMed] [Google Scholar]
- 90.Ganeshan B, Skogen K, Pressney I, Coutroubis D, Miles K. Tumour heterogeneity in oesophageal cancer assessed by CT texture analysis: preliminary evidence of an association with tumour metabolism, stage, and survival. Clin Radiol. 2012;67:157–164. doi: 10.1016/j.crad.2011.08.012. . PMid:21943720. [DOI] [PubMed] [Google Scholar]
- 91.Ng F, Ganeshan B, Kozarski R, Miles KA, Goh V. Assessment of primary colorectal cancer heterogeneity by using whole-tumor texture analysis: contrast-enhanced CT texture as a biomarker of 5 year survival. Radiology. 2013;266:177–184. doi: 10.1148/radiol.12120254. . PMid:23151829. [DOI] [PubMed] [Google Scholar]
- 92.Zhang H, Graham C, Elci O, et al. Washington, DC: American Roentgen Ray Society (ARRS); 2013. Predicting survival in locally advanced SSC of the head and neck on neoadjuvant TPF therapy using pre-therapy clinical parameters, standard CT image findings, and CT texture analysis. PMid:23472221. [Google Scholar]
- 93.Yu H, Caldwell C, Mah K, Mozeg D. Co-registered FDG PET/CT-based textural characterization of head and neck cancer for radiation treatment planning. IEEE Trans Med Imaging. 2009;28:374–383. doi: 10.1109/TMI.2008.2004425. PMid:19244009. [DOI] [PubMed] [Google Scholar]
- 94.Yu H, Caldwell C, Mah K, et al. Automated radiation targeting in head-and-neck cancer using region-based texture analysis of PET and CT images. Int J Radiat Oncol Biol Phys. 2009;75:618–625. doi: 10.1016/j.ijrobp.2009.04.043. . PMid:19683403. [DOI] [PubMed] [Google Scholar]
- 95.Goh V, Ganeshan B, Nathan P, Juttla JK, Vinayan A, Miles KA. Assessment of response to tyrosine kinase inhibitors in metastatic renal cell cancer: CT texture as a predictive biomarker. Radiology. 2011;261:165–171. doi: 10.1148/radiol.11110264. . PMid:21813743. [DOI] [PubMed] [Google Scholar]
- 96.Miles KA, Ganeshan B. Potential for texture analysis of hepatic CT to cost-effectively modify post-operative surveillance of patients with colorectal cancer; Presented at: European Congress of Radiology 2011, Vienna, Austria. [Google Scholar]
- 97.Miles KA, Ganeshan B. Selection of patients with advanced non-small cell lung cancer for chemotherapy: potential cost-effectiveness of CT texture analysis; Presented at: European Congress of Radiology 2012, Vienna, Austria. [Google Scholar]
- 98.Ganeshan B, Liu J, Lutkin J, Miles KA. Quantification of image heterogeneity on CT: computer simulated validation of relative texture analysis; Presented at: European Congress of Radiology 2011, Vienna, Austria. [Google Scholar]
- 99.Ganeshan B, Miles KA, Young RC, Chatwin CR. Hepatic entropy and uniformity: additional parameters that can potentially increase the effectiveness of contrast enhancement during abdominal CT. Clin Radiol. 2007;62:761–768. doi: 10.1016/j.crad.2007.03.004. . PMid:17604764. [DOI] [PubMed] [Google Scholar]
- 100.Ng F, Kozarski R, Ganeshan B, Goh V. Assessment of tumor heterogeneity by CT texture analysis: can the largest cross-sectional area be used as an alternative to whole tumor analysis? Eur J Radiol. 2013;82:342–348. doi: 10.1016/j.ejrad.2012.10.023. . PMid:23194641. [DOI] [PubMed] [Google Scholar]