Abstract
Under earth surface conditions, in ocean and natural water, calcium carbonate is ubiquitous, forming anhydrous and hydrous minerals. These hydrous phases are of considerable interest for their role as precursors to stable carbonate minerals. Atomistic simulation techniques have been employed here to perform a comprehensive and quantitative study of the structural and energetic stability of dry and hydrous surfaces of calcium carbonate polymorphs using two recently developed forcefields. Results show that the dry forms are prone to ductility; while hydrous phases are found to be brittle. The (001) surface of monohydrocalcite appears to be the most stable (0.99 J/m2) whereas for the ikaite phase, the (001) surface is the most stable. The corresponding value is 0.2 J/m2, i.e. even lower than the surface energy of the  Beautiful computed morphology pictures are obtained with Xiao's model and are very similar to the observed SEM images.
Carbonates are among the most abundant minerals in the environment. We can found them in aquatic systems forming huge amounts of scale and ocean sediment1, in the atmosphere2 and as part of the sediment and rock record3. These minerals affect the chemistry of aquatic systems by regulating pH and alkalinity through dissolution/precipitation equilibrium. Moreover, they can govern the mobility and cycling of metal contaminants and radionuclides via ion exchange, adsorption, and co-precipitation reactions4. Calcium carbonate (CaCO3) is one of the constituents of argillite used for the wastes disposal. It has an important role in restraining the swelling properties of smectitic layers and produce hydraulic and mechanical reinforcement of the clay phase. It is one of the most abundant materials found in sedimentary rock in all parts of the Earth surface (it makes up 4% of the earth's crust). CaCO3 occurs naturally in six different forms: three crystalline polymorphs, calcite, aragonite, and the metastable vaterite; two hydrate phases (monohydrocalcite (CaCO3–H2O) and Ikaite (CaCO3–6H2O)); and amorphous calcium carbonate (ACC). The monohydrocalcite structure has 8-fold coordinated calcium ions. Water is situated between the screw axes (parallel to the c-axis), bound to the carbonate ions via hydrogen bridges5. Additionally, monohydrocalcite is found to be metastable under all conditions6. However, it does form in some predominantly freshwater environments7. The structure of ikaite is characterized by hydrated calcium carbonate chains, aligned along the a- axis and are linked together by hydrogen bonds; the calcium ions are 8-fold coordinated8. It is found that ikaite is stable at high pressure and low temperatures in an alkaline aqueous environment9,10,11. It can be found in bottom waters in fjords and on deep sea floors12.
Calcite is one of the most stable phase at atmospheric pressure and temperature, while aragonite is found to be the most stable polymorph in high-pressure environments, although it is possible for aragonite to form at atmospheric pressure in certain conditions, such as hot springs13. Vaterite, the metastable form of calcium carbonate, changes to form another polymorph, or is stabilized by water adsorption on its surfaces14. We can explain the differences between the three polymorphs from the different arrangement of the CO3 ions in their crystal structures.
Many forcefields have been developed to describe the CaCO3 interactions14,15,16,17,18,19,20,21,22. Other empirical models have been used to explore the bulk and surface properties of CaCO3 at ambient conditions18,23,24,25. Parker et al.26, using an atomistic model, examined the surface precipitation and dissolution processes. On the other hand, Fisler et al.22 used the shell model to simulate the rhombohedral carbonates and their point defects. Archer et al.17 developed a new empirical potential to study the first-order phase transition between calcite I and calcite II. Recently, new models have been developed describing the interaction of the system with water, and even organics, with a view to addressing biomineralization. Raiteri et al.20 proposed a new potential model, which gives successful atomic-resolution simulations of the growth of amorphous calcium carbonate. However, the forcefield reproduces well structural and thermodynamic properties of CaCO3 but not the elastic behavior. The latest forcefield published by Xiao et al.21 for CaCO3 derived a new set of forcefield parameters, which reproduces accurately the elastic and shear modulus for bulk aragonite crystal.
Results
The broad objective in this paper is to use, for the first time, two latest forcefields developed recently by Raiteri20 and Xiao21 in order to find out the best model to analyze the surface of dry and hydrous calcite and its polymorphs. X-Rays diffraction patterns will be evaluated and compared to experimental findings. Structural and mechanical quantities will be evaluated for calcite, aragonite, vaterite, monohydrocalcite and Ikaite phases. We will discuss about the structural and energetic stability of CaCO3 polymorphs through the calculation of the surface and attachment energies as well as the equilibrium morphologies.
Bulk properties of calcium carbonate polymorphs
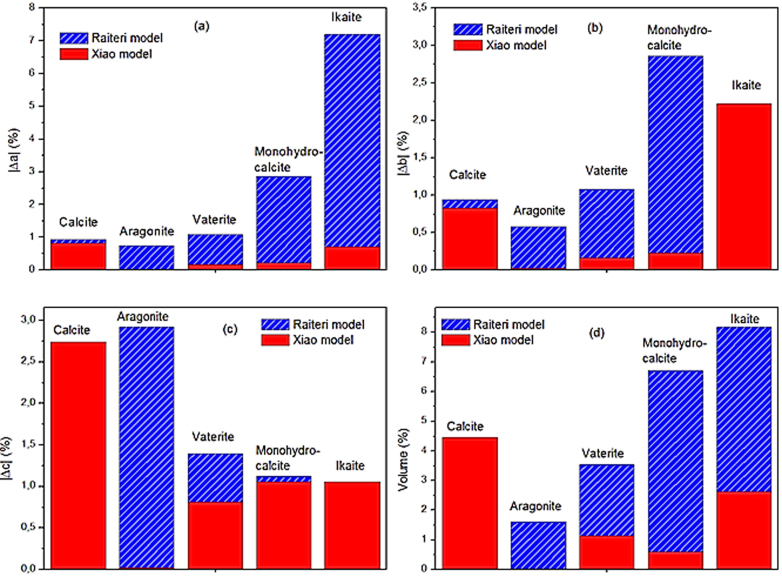
Calculations are performed using the General Utility Lattice Program 4.0 (GULP)27. Internal energy minimizations have been done in NPT ensemble allowing all individual ionic coordinates and lattice parameters to vary. The unit cell was fully optimized in order to obtain the equilibrium crystal structure. The search of the local minima adopts the Newton-Raphson procedure, with the Broyden-Fletcher-Gold-farb-Shanno (BFGS) scheme to update the Hessian. Structural parameters of the known anhydrous (calcite, aragonite, vaterite) as well as hydrous polymorphs of CaCO3 (monohydrocalcite and Ikaite), have been evaluated with both models (Raiteri's and Xiao's). They are compared to experimental data taken from the American Mineralogist database. The absolute errors of the lattice parameters a, b, c, and equilibrium volume are displayed in Figure 1 (a, b, c, d). We can see that for the case of calcite, the Raiteri's model reproduces better the structure with a lower error (less than 2%). However, when studying aragonite or vaterite structures and the hydrous phases (monohydrocalcite and Ikaite), our results show that the Xiao's forcefield reproduces well the structure of hydrated CaCO3 minerals, since the deviations of the unit cell parameters are less than 3%. Figure 1 (d) illustrates that the volume evaluated with Xiao model is obtained with an error less than 4.5% for the dry and hydrated phases, while Raiteri model gives a higher error (7–8%) for monohydrocalcite and ikaite and around 4% for the dry phases.
Figure 1. The absolute errors of the lattice parameters and volumes for CaCO3 phases.
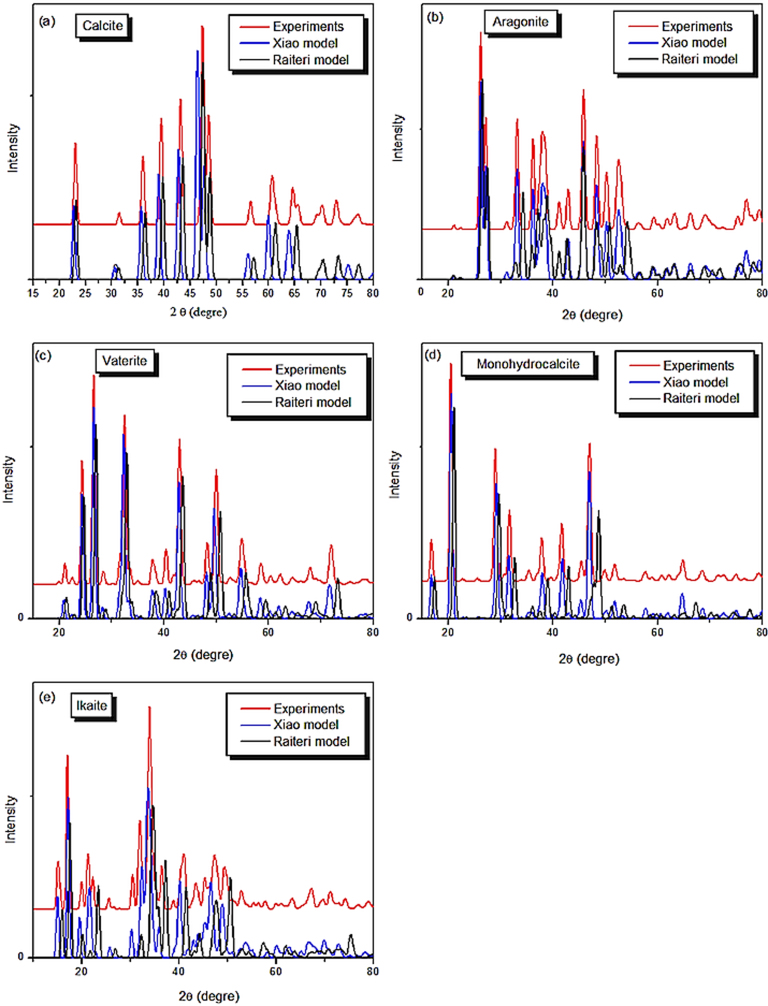
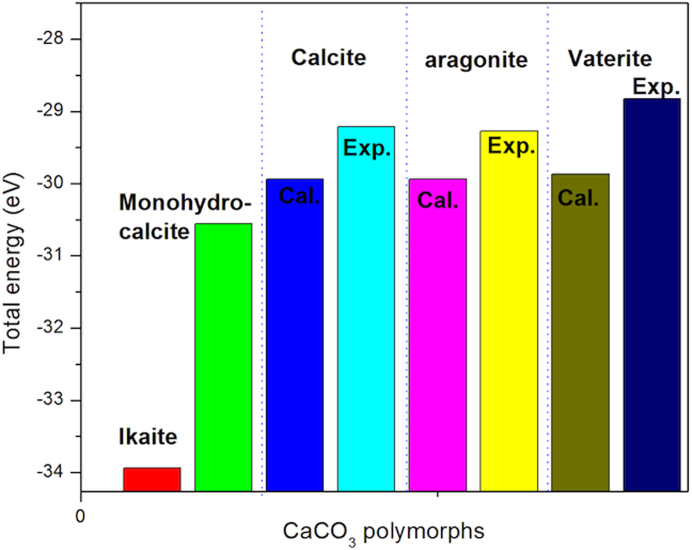
In Figure 2, we plot our calculated X-Ray diffraction patterns (λ = 1.54Å for calcite carbonate polymorphs using Raiteri's and Xiao's forcefield, compared with experimental findings. As one would expect, the Raiteri's forcefield reproduces perfectly the calcite phase than Xiao's model (Figure 2 (a)). This confirms our structural data as discussed above. We can see that from 2θ = 70°, the curve obtained from Xiao forcefield does not match the experimental findings. For the case of aragonite phase (Figure 2 (b)), the obtained X-Rays patterns from Xiao model are very similar to the experimental curve. We note a shift of the Raiteri's curve along x, which is more pronounced from 2θ = 30° to 42°. For the case of vaterite, the monohydrocalcite and ikaite phases, X-Rays diffraction patterns obtained from Xiao's model are similar to experimental curves (Figure 2 (c), (d), (e)). In Figure 3, the energetic stability of CaCO3 polymorphs is presented compared to experimental measurements28. We can see that ikaite has the lowest total energy (−33.9393 eV). Calcite (−29.9371 eV) and aragonite (−29.9358 eV) phases have a small energy difference, about 0.0013 eV. Vaterite with a total energy equal to −29.8682 eV is the less stable phase.
Figure 2. X-Rays diffraction patterns for dry and hydrous CaCO3 polymorphs calculated with Raiteri's and Xiao's forcefields and compared to experimental findings: (a) calcite, (b) aragonite, (c) vaterite, (d) monohydrocalcite, (e) Ikaite.
Figure 3. Energetic stability of CaCO3 polymorphs.
Concerning the mechanical properties, the elastic constants tensor is calculated from the second derivative matrix at the optimized structures and is listed in Table 1(a) for the hydrated phases. In a recent work of Xiao et al. the elastic data, for the dry phases, were reported and compared with experiments21,29,30. We can notice that C11 for Ikaite is smaller than C22 and C33 what means that this structure is more compressive in the direction perpendicular to the layers (layers parallel to (100)). We have also calculated the isotropic bulk (B) and shear (G) moduli obtained from the Voigt-Reuss-Hill averages31. We can define B as the amount of pressure required for a unit volume change of the material; G measures the shear forces required to induce a unit shape change measured, while E is the force per unit of cross-sectional area needed for a unit dimensional change. In Table 1(b) , we have listed the bulk modulus, B, shear modulus, G, Young's modulus, E and B/G for all phases. Using the ratio B/G (the resistance to fracture (B) relative to the plastic deformation resistance (G)) introduced by Pugh32, we can analyze the ductility of a material. A value of B/G higher than 1.75 indicates a tendency for ductility, while a value of B/G lower than 1.75 indicates a tendency for brittleness. The dry forms of calcium carbonate yield values higher than 1.75, suggesting that calcium carbonate materials are prone to ductility. Moreover, the value of B/G on going from CaCO3 to CaCO3–H2O and CaCO3–6H2O decreases, which suggests that the inclusion of water in the crystal makes the material more brittle. In fact, the bulk modulus decreases with about 36% from calcite to monohydrocalcite and about 56–82% from calcite to ikaite.
Table 1a. Elastic data for monohydrocalcite and Ikaite.
| Monohydro calcite | Ikaite | |||
|---|---|---|---|---|
| a | b | a | b | |
| C11(GPa) | 99.3 | 98.8 | 41.7 | 59.2 |
| C22(GPa) | 96.1 | 75.4 | ||
| C33(GPa) | 91.9 | 88.1 | 82.0 | 62.7 |
| C12(GPa) | 25.6 | 28.9 | 18.8 | 20.4 |
| C13(GPa) | 34.8 | 42.2 | 27.8 | 26.3 |
| C23(GPa) | 18.7 | 16.8 | ||
| C44(GPa) | 52.8 | 32.1 | 8.0 | 4.2 |
| C55(GPa) | 8.9 | 2.7 | ||
| C66(GPa) | 36.8 | 34.9 | 16.2 | 12.9 |
aOur calculations using Raiteri's model, b using Xiao's model.
Table 1b. Elastic data for monohydrocalcite and Ikaite.
| Calcite | Aragonite | Vaterite | Monohydro calcite | Ikaite | ||||||||
|---|---|---|---|---|---|---|---|---|---|---|---|---|
| a | b | c | a | b | d | a | b | a | b | a | b | |
| B | 83.1 | 85.7 | 80.6 | 72.6 | 67.7 | 67.1 | 88.1 | 69.1 | 53.4 | 44.4 | 36.3 | 15.6 |
| G | 32.6 | 35.7 | 32.7 | 38.8 | 35.8 | 35.8 | 36.9 | 18.8 | 36.9 | 27.6 | 31.1 | 13.7 |
| B/G | 2.5 | 2.4 | 2.4 | 1.8 | 1.9 | 1.8 | 2.3 | 3.6 | 1.4 | 1.6 | 1.16 | 1.13 |
| Ex | 108.6 | 78.1 | 185.7 | 132.7 | −75.0 | 58.3 | 80.4 | 75.1 | 38.4 | 45.4 | ||
| Ey | 108.6 | 78.1 | 81.0 | 69.3 | −75.0 | 58.33 | 80.4 | 75.1 | 96.4 | 66.8 | ||
| Ez | 54.62 | 39.45 | 58.56 | 76.95 | 145.9 | 110.6 | 72.52 | 60.2 | 81.9 | 44.2 | ||
Surface analysis
Starting from the experimental structure (a = b = 4.988 Å, c = 17.061 Å; α = β = 90° and γ = 120° the optimized bulk structure of calcite was cut to obtain the surfaces  Ca+2,
Ca+2,  CO3−2,
  (see Table 2). Cleavage along the
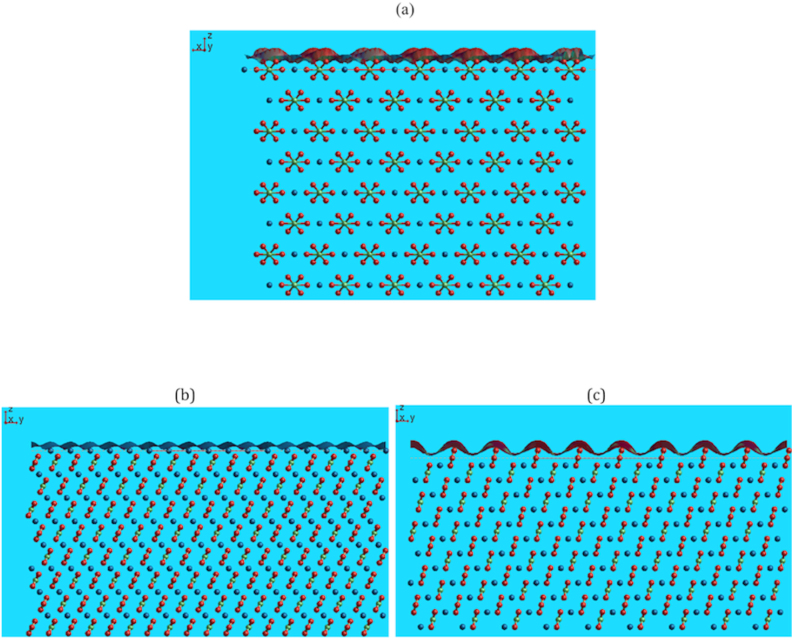
  plane gives rise to the characteristic rhombohedra shape of calcite crystals. This plane contains both Ca+2 and CO3−2 ions, making the surface charge neutral (Figure 4 (a)), and thus stable with a low surface energy. Furthermore, it has also a higher density of ions compared to other possible neutral planes. For instance, the
  and the
  planes are polar as they are terminated by either a layer of calcium or carbonate ions, leading to a positively or negatively charged surface respectively (Figure 4 (b), (c)). We plot in the top of the slabs the iso-surfaces. These are obtained using the Gaussian description of molecular shape. It is similar to the idea of rolling a probe atom over the surface of the system being studied.
Table 2. Relaxed surface and attachment energy of Calcite.
| Surface energy (J.m−2) | Attachment energy (eV) | |||||
|---|---|---|---|---|---|---|
| Surface (Hexagonal indices) | Raiteri's forcefield | Xiao's forcefield | Other results a | Raiteri's forcefield | Xiao's forcefield | Other results a |
 |
0.71 | 0.51 | 0.59 | −11.34 | −8.69 | −7.82 |
 |
1.11 | 0.76 | 1.39 | −33.91 | −24.58 | −30.24 |
 |
1.04 | 0.64 | 0.97 | −33.29 | −14.37 | −78.86 |
 |
1.61 | 1.63 | 1.23 | −11.92 | −30.63 | −31.89 |
 |
1.36 | 0.97 | 1.14 | −17.88 | −24.58 | −28.72 |
 |
4.85 | 1.56 | −206.70 | −100.78 | ||
a 14
Figure 4.
(a)  surface of calcite; on the top are presented iso-surfaces. (b)
  surface of calcite with Ca termination, (c)
  surface of calcite with CO3 termination. Blue atoms represent calcium, green atoms are carbon and red atoms represent oxygen.
For the aragonite phase, the crystal was cut to obtain the following low index surfaces: (010), (100), (001), (110), (011), (101), and (111). The (010) and (110) surfaces are cleavage planes while the (110) is also a twinning plane (see Table 3). The surfaces can be cut in more than one way, giving rise to planes terminated by either calcium ions or oxygen atoms of the carbonate groups. In the case of the metastable vaterite phase, all surfaces have both calcium and carbonate terminated planes as presented in Table 4. Surfaces are allowed to relax, the calculated surface and attachment energies with both forcefields are given in Tables 2, 3, and 4 and are compared to other theoretical results14.
Table 3. Relaxed surface and attachment energy of Aragonite.
| Surface energy (J.m−2) | Attachment energy (eV) | |||||
|---|---|---|---|---|---|---|
| Surface | Raiteri's forcefield | Xiao's forcefield | Other resultsa | Raiteri's forcefield | Xiao's forcefield | Other resultsa |
| (010) Ca | 1.14 | 0.80 | 0.96 | −4.62 | −3.20 | −10.91 |
| (010) CO3 | 1.57 | 1.10 | 1.50 | −11.96 | −10.48 | −32.68 |
| (100) | 1.71 | 1.23 | 1.50 | −15.95 | −10.75 | −39.58 |
| (001) Ca | 1.59 | 1.36 | 1.05 | −12.73 | −9.58 | −35.41 |
| (001) CO3 | 1.01 | 0.78 | 0.85 | −5.35 | −3.92 | −12.46 |
| (110) Ca | 1.03 | 0.73 | 0.88 | −8.61 | −6.10 | −10.50 |
| (110) CO3 | 1.30 | 0.92 | 1.04 | −28.14 | 4.37 | −31.45 |
| (101) Ca | 1.19 | 0.90 | 0.99 | −10.54 | −6.18 | −15.11 |
| (101) CO3 | 1.31 | 1.00 | 1.08 | −14.52 | −12.03 | −16.14 |
| (011) CO3 | 0.90 | 0.84 | 0.69 | −5.97 | −9.08 | −6.38 |
| (011) CO3 | 1.09 | 1.33 | 1.16 | −14.33 | −16.37 | −17.40 |
| (011) CO3 | 1.33 | 1.20 | 0.99 | −10.08 | −16.23 | −10.61 |
| (111) Ca | 1.30 | 0.94 | 1.40 | −23.39 | −3.82 | −33.19 |
| (111) CO3 | 1.09 | 0.83 | 0.84 | −14.94 | −6.50 | −18.38 |
a14
Table 4. Relaxed surface and attachment energy of vaterite.
| Surface energy (J.m−2) | Attachment energy (eV) | |||||
|---|---|---|---|---|---|---|
| Surface | Raiteri's forcefield | Xiao's forcefield | Other studies a | Raiteri's forcefield | Xiao's forcefield | Other studies a |
| (010) Ca | 1.51 | 1.34 | 1.35 | −92.65 | 4.04 | −35.58 |
| (010) CO3 | 0.75 | 0.75 | 0.62 | −37.48 | −37.48 | −8.29 |
| (100) Ca | 1.55 | 1.34 | 1.31 | −115.51 | 4.04 | −17.50 |
| (100) CO3 | 0.75 | 1.54 | 1.39 | −37.48 | −91.41 | −14.23 |
| (110) Ca | 1.54 | 0.87 | 1.18 | −146.66 | −107.35 | −25.94 |
| (110) CO3 | 0.87 | 0.98 | 1.04 | −49.33 | −55.29 | −15.47 |
| (011) Ca | 1.29 | 1.16 | 1.22 | −41.10 | −32.70 | −59.90 |
| (011) CO3 | 1.12 | 1.12 | 0.93 | −55.23 | −55.23 | −19.37 |
| (101) Ca | 1.35 | 0.86 | 1.47 | −34.66 | −20.14 | −19.33 |
| (101) CO3 | 1.22 | 0.79 | 1.07 | −43.46 | −16.62 | −18.29 |
| (111) Ca | 1.48 | 0.78 | 0.82 | −190.73 | −109.70 | −19.47 |
| (111) CO3 | 2.39 | 0.86 | 0.85 | −125.23 | −100.57 | −25.47 |
a 14
Discussion
In this part we will discuss about the best forcefield for modeling the surface of calcite and its polymorphs. We will analyze, for the first time the equilibrium morphology of dry and hydrous phases of CaCO3.
In the case of calcite (Table 2), it is clear that the relaxed  surface is the most stable surface, with a lowest surface value and attachment energy. The corresponding values are found to be equal to 0.51 J/m2 and −8.69 eV. We notice also that Xiao's forcefiled gives lower values, which agree better with the experiment and other theoretical data33,34,35. The other polar surfaces are unstable by themselves and will either reconstruct to neutralize the dipole moment or adsorb ions to remove the dipole moment. However, they can be stabilized when grown on charged substrates.
Concerning the surface of the aragonite phase and according to the above structural calculations, we remark (Table 3) that the surface energies obtained with Xiao's model agree better with the other theoretical works14. In the other hand, we can see that the surface energy of the pure (010) surface quoted in Table 3 shows the calcium terminated plane to have a lower surface energy than the carbonate surface and hence to be the most stable surface plane. This is due to the rotation of carbonate groups rotate, which tend to lie flat in the surface rather than upright as in a bulk termination. On the other hand the calcium-terminated plane shows hardly any relaxation. In addition, the attachment energies agree well with the surface energies, where we notice that the calcium plane is favored over the carbonate plane through its low value indicating a small growth rate. The same remarks for the (110) surface. Concerning the (011) surface, it has different cuts with one or more surface oxygen ions. However, their surface energies vary greatly as shown in Table 3 from a very stable surface with γ = 0.84 J m–2 to the least stable with a surface energy of 1.33 J m–2. We notice that the attachment energies show the same trend as the relaxed surface energies with a very low value for the most stable plane. Consequently, this surface would be expressed in the growth morphology.
For the relaxed surface of vaterite phase, we note that our results based on Xiao's model are generally in good agreement with the theoretical calculations14. It is clear from Table 4 that the (010) carbonate plane is the dominant surface, with the lowest surface and attachment energies of the series. Moreover, the (100), (001), and (110) surfaces have relatively large surface and attachment energies, even if some surfaces have been relaxed sufficiently. We remark that the (011) calcium plane and both (101) surfaces are dipolar and both need extensive relaxation on energy minimization.
In Table 5 and 6, we present our results for the relaxed surface of hydrated CaCO3, monohydrocalcite and Ikaite, using Raiteri's and Xiao's forcefields. For Monohydrocalcite (CaCO3–H2O), the surface energies found using Xiao' model are 1.54, 1.21 and 0.99 J/m2 for the x, y, and z surfaces, respectively (Table 5). The corresponding attachment energies are −7.82, −6.62 and −5.66 eV for the x, y, and z surfaces, respectively. These results show that the (100) surface is less stable than the other two surfaces, which implies that the (100) surface will not appear in the monohydrocalcite equilibrium morphology. For the case of relaxed Ikaite surface, the obtained surface energies (Table 6) are equal to 0.52, 0.37, 0.20 J/m2 for (100), (010) and (001) planes, respectively. The corresponding attachment energies are −8.19, −5.79, −2.57 eV for (100), (010) and (001) planes, respectively. We can clearly see that the (001) surface is the most stable (0.2 J/m2), with a value lower than that found for the most stable  However, the (100) plane with 0.52 J/m2 would not be expressed in the growth morphology.
Table 5. Relaxed surface and attachment energy of monohydrocalcite.
| Surface energy (J.m−2) | Attachment energy (eV) | |||
|---|---|---|---|---|
| (hkl) | Raiteri's model | Xiao's model | Raiteri's model | Xiao's model |
| (100) | 1.48 | 1.54 | −13.75 | −7.82 |
| (010) | 1.39 | 1.21 | −10.94 | −6.62 |
| (001) | 1.00 | 0.99 | −24.94 | −5.66 |
Table 6. Relaxed surface and attachment energy of Ikaite.
| Surface energy (J.m−2) | Attachment energy (eV) | |||
| (hkl) | Raiteri's model | Xiao's model | Raiteri's model | Xiao's model |
| (100) | 1.46 | 0.52 | −13.65 | −8.19 |
| (010) | 0.35 | 0.37 | −7.48 | −5.79 |
| (001) | 0.23 | 0.20 | −3.04 | −2.57 |
In order to measure the relative stability of the surfaces, it is necessary to compute the equilibrium morphology of a crystal, which is determined by the surface energy and the related growth rate for the various surfaces. The Gibbs-Wulff theory provides a simple mathematical approach that predicts the equilibrium crystal shape, which should possess a minimal total surface energy for a given volume36,37. This induces that a surface with a high surface free energy has a large growth rate, and this fast growing surface will not be expressed in the equilibrium morphology of the resulting crystal. Therefore, we consider only surfaces with low surface energies and hence slow growth will be expressed. It is well known that at 0 K, the surface free energy is a close approximation of the surface energy as calculated by static lattice simulations. In fact, this is due to the entropy term, which is found small when included in the surface free energy. Thus, the surface energies can be assumed to determine the equilibrium morphology of the crystal.
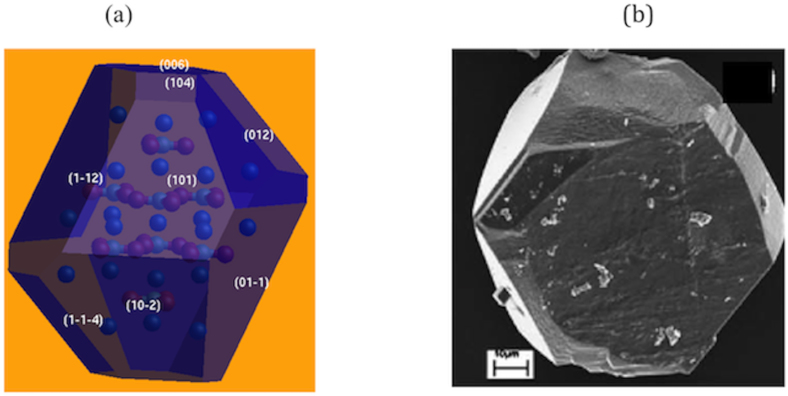
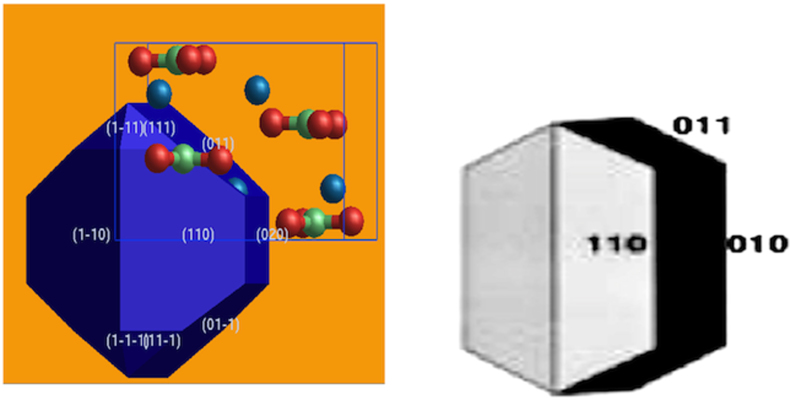
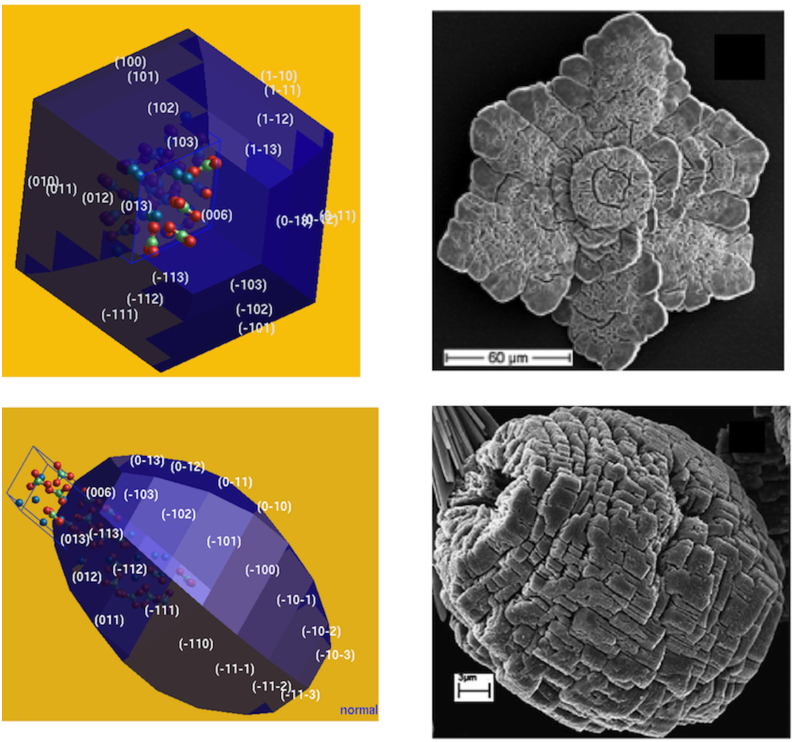
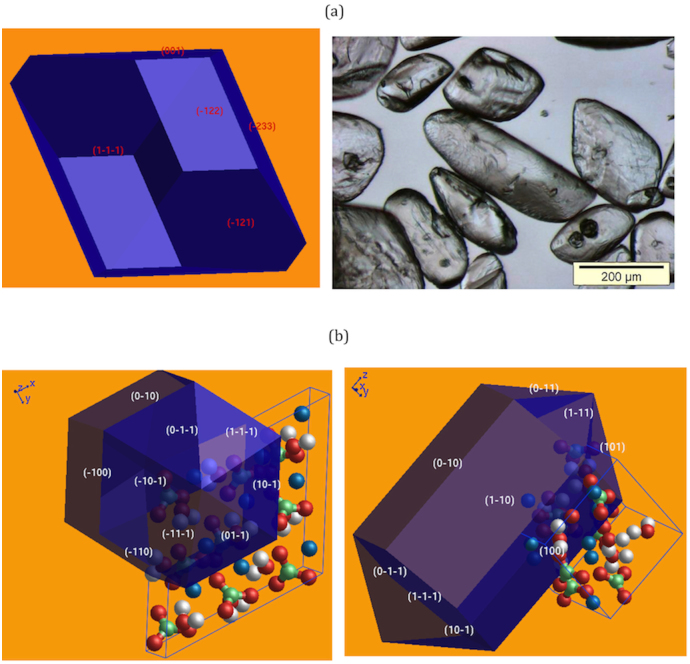
Figures 5, 6 and 7 show the equilibrium morphologies of dry calcium carbonate (calcite, aragonite, vaterite) obtained for all allowed faces and compared to the experimental images of scanning electron microscopy (SEM)38. We remark that our computed morphologies are very similar to the experimental ones. For the hydrated phases, we show in Figure 8 (a) the equilibrium morphology of Ikaite compared to the SEM image39. In Figure 8(b) the predicted equilibrium morphology for monohydrocalcite phase is presented since no experimental images are available. These results confirm once again the potential models employed and support strongly our findings.
Figure 5. Equilibrium morphology of calcite compared to SEM images38.
Figure 6. Equilibrium morphology of aragonite compared to SEM images38 .
Figure 7. Equilibrium morphology of vaterite compared to SEM images38 .
Figure 8. Equilibrium morphology of hydrous CaCO3 polymorphs: (a) Ikaite compared to SEM image39; (b) monohydrocalcite.
Methods
Potential model and surface simulation
In Raiteri's model19, the oxygen-oxygen and calcium-oxygen interactions are modeled via a Buckingham potential. The covalency within the  group is modeled by a Morse potential plus a three-body potential and a torsional potential function to restrain the planar
  group from folding. The interaction between the calcium ions and water is represented by the Lennard-Jones (12,6) potential including molecular flexibility20 using the SPC/Fw model40.
Xiao et al.21 proposed a new forcefield to describe interatomic interactions for the bulk aragonite crystal in an aqueous and/or protein environment using the TIP3P water model41. In comparison to Raiteri's model, Xiao et al.21 use Lennard-Jones (LJ) potentials rather than Buckingham potentials to describe all van der Waals interactions. They included a LJ potential for the C_C interaction, which was neglected in Pavese's work18.
The simulation model of surface follows the approach of Tasker42 in which the crystal consists of two blocks, each comprising two regions that are periodic in two dimensions. Region I contains the surface layers and few layers immediately below; these atoms are allowed to relax to their mechanical equilibrium. Region II contains those atoms further away, which are kept fixed at their bulk equilibrium position and represent the rest of the crystal. The size of region 2 is chosen to be thick enough so that the atoms represent the effect of the bulk upon the atoms in region 1. The size of region 1 is generally chosen depending upon the convergence of surface energy. This quantity is computed using the following expression:
where Us is the energy of the surface block of the crystal, Ubis the energy of an equal number of atoms of the bulk crystal, and A is the surface area. The energies of the blocks are essentially the sum of the energies of interaction between all atoms. The surface energy is a measure of the thermodynamic stability of a cleavage plane. On the other hand there is a widely used alternative criterion named the attachment energy: it is the energy associated with the addition of a stoichiometric layer of material onto the surface cut. This implies that for any stable material, the attachment energy must be exothermic. Therefore, those faces will tend to grow most rapidly.
Author Contributions
A.Z. conceived and designed the study. W.S. performed the theoretical studies and simulations. W.S. and A.Z. analysed and discussed the results. W.S. and A.Z. wrote the manuscript. All authors discussed the conceptual and practical implications of the method at all stages.
Acknowledgments
The authors would like to thank the National Radioactive Waste Management Agency (ANDRA) for financial support. The authors are grateful to Dr F. Plas and A. Pasteau for valuable discussions.
References
- Morse J. W. & Mackenzie F. T. Geochemistry of Sedimentary Carbonates. Develop. Sedimentol. 48, Elsevier: Amsterdam, 724 pages (1990). [Google Scholar]
- Usher C. R. et al. Reactions on mineral dust. Chem. Rev. 103, 4883–4939 (2003). [DOI] [PubMed] [Google Scholar]
- Morse J. W. et al. Calcium carbonate formation and dissolution. Chem. Rev. 107, 342–381 (2007). [DOI] [PubMed] [Google Scholar]
- Van Cappellen P. et al. A surface complexation model of the carbonate mineral-aqueous solution interface. Geochim. Cosmochim. Acta. 57, 3505–3518 (1993). [Google Scholar]
- Swainson I. P. The structure of monohydrocalcite and the phase composition of the beachrock deposits of Lake Butler and Lake Fellmongery. South Australia 93, 1014–1018 (2008). [Google Scholar]
- Hull H. & Turnbull A. G. Thermochemical Study of Monohydrocalcite. Geochim. Cosmochim. Acta 37, 685–694 (1973). [Google Scholar]
- Dahl K. & Buchardt B. Monohydrocalcite in the arctic Ikka fjord, SW Greenland: First reported marine occurrence. Jour. of Sedim. Res. 76, 460–471 (2006). [Google Scholar]
- Lennie A. R. et al. The structure and thermal expansion behaviour of ikaite, CaCO36H2O, from T = 114 to T = 293 K. Miner. Mag. 68, 135–146 (2004). [Google Scholar]
- Bischoff J. L. et al. The Solubility and Stabilization of Ikaite (CaCO3.6H2O) from 0° to 25°C: Environmental and paleoclimatic implications for thinolite tufa. The Jour. of Geo. 101, 21–33 (1993). [Google Scholar]
- Marland G. The stability of CaCO3·6H2O (ikaite). Geoch. et Cosmoch. Acta 39, 83–91 (1975). [Google Scholar]
- Shahar A. et al. The stability and Raman spectra of ikaite, CaCO3.6H2O, at high pressure and temperature. Amer. Miner. 90, 1835–1839 (2005). [Google Scholar]
- Jansen J. H. F. et al. Ikaite pseudomorphs in the Zaire deep-sea fan: An intermediate between calcite and porous calcite. Geol. 15, 245–248 (1987). [Google Scholar]
- Frye R. editor. Aragonite Group in Encyclopedia of Mineralogy. Hutchinson Ross Publishing Company, Stroudsbourg, Pennsylvania, USA, 1 edition (1981). [Google Scholar]
- De Leeuw N. H. & Parker S. C. Surface structure and morphology of calcium carbonate polymorphs calcite, aragonite, and vaterite: An atomistic approach. Jour. of Phys. & Chem. B 102, 2914–2922 (1998). [Google Scholar]
- De Leeuw N. H. & Parker S. C. Atomistic simulation of the effect of molecular adsorption of water on the surface structure and energies of calcite surfaces. J. Chem. Soc. Faraday Trans. 93(3), 467–475 (1997). [Google Scholar]
- Pavese A. et al. Interatomic potentials for CaCO3 polymorphs (calcite and aragonite), fitted to elastic and vibrational data. Phys. & Chem. of Miner. 19, 80–87 (1992). [Google Scholar]
- Archer T. D. et al. An interactomic potential model for carbonates allowing for polarisation effects. Phys. & Chem. of Miner. 30, 416–424 (2003). [Google Scholar]
- Pavese A. et al. Modelling of the thermal dependence of structural and elastic properties of calcite, CaCO3. Phys. & Chem. of Miner. 23, 89–93 (1996). [Google Scholar]
- Raiteri P. & Gale J. D. Water Is the Key to Nonclassical Nucleation of Amorphous Calcium Carbonate. Amer. Chem. Soc. 132, 17623–17634 (2010). [DOI] [PubMed] [Google Scholar]
- Raiteri P. et al. Derivation of an Accurate Force–Field for Simulating the Growth of Calcium Carbonate from Aqueous Solution: A New model for the Calcite-Water Interface. Jour. of Phys. & Chem. C. 114, 5997–6010 (2010). [Google Scholar]
- Xiao S. et al. A New Transferable Forcefield for Simulating the Mechanics of CaCO3 Crystals. Jour. of Phys. Chem. C. 115, 20067–20075 (2011). [Google Scholar]
- Fisler D. K. et al. A shell model for the simulation of rhombohedral carbonate minerals and their point defects. Amer. Miner. 85, 217–224 (2000). [Google Scholar]
- Sekkal W. et al. A lattice dynamical study of the aragonite and post-aragonite phases of calcium carbonate rock. Amer. Miner. 93, 1608–1612 (2008). [Google Scholar]
- Dove M. T. et al. A new interatomic potential mlodel for calcite: Applications to lattice dynamics studies, phase transition, and isotope fractionation. Amer. Miner. 77, 244–250 (1992). [Google Scholar]
- Catti M. et al. Thermodynamic properties of CaCO3 calcite and aragonite: A quasi-harmonic calculation. Phys. & Chem. of Miner. 19, 472–479 (1993). [Google Scholar]
- Parker S. C. et al. Phil. Trans. of the Roy. Soc. of London Series A – Phys. Sci. and Eng. 344, 37 (1993). [Google Scholar]
- Gale D. J. GULP: A computer program for the symmetry-adapted simulation of solids. Chem. Soc. Faraday Transactions. 93, 629–637 (1997). [Google Scholar]
- Glasser L. & Jenkins H. D. B. Lattice energies and unit cell volumes of complex ionic solids. J. Amer. Chem. Soc. 122, 632–638 (2000). [Google Scholar]
- Chen C. C. et al. Elasticity of single-crystal calcite and rhodochrosite by Brillouin spectroscopy. Amer. Miner. 86, 1525–1529 (2001). [Google Scholar]
- Liu L. et al. Elasticity of single-crystal aragonite by Brillouin spectroscopy. Phys. and Chem. of Miner. 32, 97–102 (2005). [Google Scholar]
- Hill R. Elastic properties of reinforced solids : some theoretical principles. Jour. of the Mech. and Phys. of Solids. 11, 357–372 (1963). [Google Scholar]
- Pugh S. F. Relations between the elastic moduli and the plastic properties of polycrystalline pure metals. Philos. Mag. 45, 823–843 (1954). [Google Scholar]
- Ayoub A. et al. High pressure structural phase transitions and mechanical properties of calcite rock. Comput. Mater. Sci. 50, 852–857 (2011). [Google Scholar]
- Dove P. M. & Hochella M. F. Calcite precipitation mechanisms and inhibition by orthophosphate: In situ observations by scanning force microscopy. Geoch. Cosmoch. Acta 57, 705–714 (1993). [Google Scholar]
- Heywood B. R. & Mann S. Molecular Construction of Oriented Inorganic Materials: Controlled Nucleation of Calcite and Aragonite under Compressed Langmuir Monolayers. Chem. of Mater. 6, 311 (1994). [Google Scholar]
- Wulff G. Zur Frage der Geschwindigkeit des Wachstums und der Auflösung der Krystallflagen. Zeitsch. für Kristall. 34, 449–480 (1901). [Google Scholar]
- Gibbs J. W. Collected Works. Longma. New York (1928). [Google Scholar]
- Mukkamala S. B. et al. Modelling calcium carbonate biomineralisation processes. Jour. of Inorg. Biochem. 100, 1128–1138 (2006). [DOI] [PubMed] [Google Scholar]
- Dieckmann G. S. et al. Ikaite (CaCO3*6H2O) discovered in Arctic sea ice. The Cryosphere, 4, 227–230 (2010). [Google Scholar]
- Wu Y. J. et al. Flexible simple point-charge water model with improved liquid-state properties. J. of Chem. Phys. 124, 024503 (2006). [DOI] [PubMed] [Google Scholar]
- Jorgensen W. L. et al. Comparison of simple potential functions for simulating liquid water. The J. of Chem. Phys. 79, 926–935 (1983). [Google Scholar]
- Tasker P. W. The stability of ionic crystal surfaces. J. of Phys. C. Solid State Phys. 12, 4977–4983 (1979). [Google Scholar]


