

Abstract
Thalamocortical circuits are central to sensory and cognitive processing. Recent work suggests that the thalamocortical inputs onto L4 and L6, the main input layers of neocortex, are activated differently by visual stimulation. Whether these differences depend on layer-specific organization of thalamocortical circuits; or on specific properties of synapses onto receiving neurons is unknown. Here we combined optogenetic stimulation of afferents from the visual thalamus and paired recording electrophysiology in L4 and L6 of rat primary visual cortex to determine the organization and plasticity of thalamocortical synapses. We show that thalamocortical inputs onto L4 and L6 differ in synaptic dynamics and sensitivity to visual drive. We also demonstrate that the two layers differ in the organization of thalamocortical and recurrent intracortical connectivity. In L4, a significantly larger proportion of excitatory neurons responded to light activation of thalamocortical terminal fields than in L6. The local microcircuit in L4 showed a higher degree of recurrent connectivity between excitatory neurons than the microcircuit in L6. In addition, L4 recurrently connected neurons were driven by thalamocortical inputs of similar magnitude indicating the presence of local subnetworks that may be activated by the same axonal projection. Finally, brief manipulation of visual drive reduced the amplitude of light-evoked thalamocortical synaptic currents selectively onto L4. These data are the first direct indication that thalamocortical circuits onto L4 and L6 support different aspects of cortical function through layer-specific synaptic organization and plasticity.
Introduction
Thalamocortical (TC) circuits are central to the coding of sensory information (Sherman and Guillery, 2002; Castro-Alamancos, 2004) and crucial for the synchronization of cortical activity (Llinás et al., 1999; Banitt et al., 2007; Wang et al., 2010; Bruno, 2011). Axons from the lateral geniculate nucleus of the thalamus (LGN) project largely to L4 of primary visual cortex (V1) and send a significant portion of their collateral afferents to L6 (LeVay and Gilbert, 1976; Peters and Feldman, 1977). While the inputs onto the two layers are thought to contribute to transfer of sensory information (Amitai, 2001; Lee and Sherman, 2008), experimental evidence suggests that neurons in L4 and L6 may play different functions in the processing of sensory stimuli (Gilbert, 1977; Sengpiel et al., 1998; Alonso et al., 2001). Whether the functional differences depend on layer-specific synaptic organization of the TC–intracortical (IC) circuits or on distinct responsiveness to changes in sensory input is unknown. Studies investigating the effect of long-lasting sensory deprivation suggest that reduction of driving input leads to alterations of TC projections (Tieman, 1985; Catalano and Shatz, 1998; Antonini et al., 1999) and changes in TC plasticity (Khibnik et al., 2010); however, the effects of brief sensory deprivation on these synapses have been less consistent (Coleman et al., 2010). To date, there is no direct evidence that brief changes in sensory experience affect TC inputs and that the effect is similar in L4 and L6. In V1, a major model for studying the effect of sensory drive on the synaptic organization of cortical circuits, the complex anatomy of the axons from LGN neurons has hampered the direct investigation of TC synapses. Here we devised an experimental approach that combines optogenetic stimulation of TC axons (Petreanu et al., 2007; Cruikshank et al., 2010) from the LGN with paired recordings in V1 to investigate directly the organization, synaptic properties, and plasticity of TC synapses onto L4 and L6 excitatory neurons in acute slices. Our data demonstrate that LGN afferents in L4 and L6 excitatory neurons have layer-specific properties. More specifically, we show that there are significant differences in the proportion of neurons responding to light activation of TC terminal fields in the two layers and that the amplitude and short-term dynamics of TC synaptic responses show layer specificity. In addition, L4 and L6 have distinct organization of TC and recurrent connectivity and show different sensitivity to changes in visual drive. While brief manipulation of visual drive induced a selective decrease of TC inputs onto L4 pyramidal neurons, recurrent L4 synapses as well as TC synapses onto L6 neurons remained unaffected. These results are consistent with the idea that the two main input layers of V1 may relay different aspects of cortical function via layer-specific properties and circuit organization of TC inputs. As TC inputs onto L4 alone are exquisitely sensitive even to brief changes in visual input, the organization of the circuit in layer 4 may bias its function toward sensory processing and experience-dependent circuit refinement, while the circuit in L6 may be organized to bias its function toward gain control (Olsen et al., 2012) and corticothalamic feedback (Andolina et al., 2007; Briggs, 2010; Briggs and Usrey, 2011; Krahe and Guido, 2011).
Materials and Methods
The surgery and experimental procedures were approved by the Stony Brook University Animal Use Committee and followed the guidelines of the National Institutes of Health. We developed an experimental approach for the direct investigation of TC synapses in acute slice preparation of V1. To allow for light activation of TC afferents in V1, adeno-associated virus serotype 9 (AAV9) (Gu et al., 2012) containing the ChR2-GFP gene (Zhang et al., 2010) was delivered with a Nanoject pressure injector in the LGN of postnatal day 14 (P14) rats anesthetized with a mixture containing 100 mg/kg Ketamine, 0.7 mg/kg Acepromazine, and 10 mg/kg Xylazine. Both male and female rats were included in the study. The location of the injection site and the titration of the number of viral particles required for reliable and successful expression were analyzed using histological analysis of fixed tissue. The coordinates of injection at P14 were 3.6 mm posterior from bregma, 3.05 mm lateral from midline, 3.8 mm below the pia. This resulted in positive expression of channelrhodopsin2 (ChR2)-GFP in the location expected for the LGN 14 d after surgery at P28. It should be noted that the position of the injection site at 14 d is 2–3 mm rostral to the location of V1, making it highly unlikely for the construct to leak in V1 during injection. Furthermore, no leak of the construct occurred in the cortical region above the injection site; therefore, nonspecific infection of corticocortical axons from other cortical areas cannot account for the ChR2-GFP-expressing axons in V1. The subtype of AAV used in this study did not show retrograde labeling of neuron somata in V1, indicating specific expression of the light-gated conductance in LGN terminal fields. The histological procedures used in this study are as follows. Briefly, 14 d after injection, P28 rats were anesthetized with 100 mg/kg Ketamine, 0.7 mg/kg Acepromazine, and 10 mg/kg Xylazine and perfused intracardially with cold fixative solution (4% Paraformaldehyde). The brain was dissected and postfixed in 30% sucrose solution. Slices (100 μm thick) from fixed brains were cut with a Vibroslicer (Leica VT1000). Confocal images of the LGN were obtained with a 20× objective. Confocal images of V1 were obtained at low magnification (5× objective; Fig. 1B, left) to visualize all layers in V1 simultaneously. The level of expression in V1 was quantified by analyzing the intensity of GFP expression across the cortical mantle (Fig. 1D). Once the most effective concentration was assessed (300 nl volume containing 50*1012 particles/nl), it was used throughout the study. To determine the success of each injection, the profile of GFP expression was quantified for each acute slice used for patch-clamp recordings. Only data obtained from slices whose expression profile was within one SD from the average were included in the analysis (Fig. 1D). This allowed for comparisons of recordings obtained from slices with similar levels of ChR2 expression in the LGN terminal fields in V1.
Figure 1.

Optogenetic approach to the study of TC synapses from the LGN onto V1. A, Example of injection of ChR2-GFP in the LGN. The injection was performed on P14 rats and the image was obtained at P28. Top right, Expanded image of the injection site. B, Diagram of experimental configuration and image of LGN recorded neuron (white cell stained with biocytin/Alexa647, see arrow). LS, Light stimulation was delivered using 3 pulses of 1 ms. LGN, Sample trace of LGN neuron activity in response to light stimulation. Note that light stimulation effectively activates LGN neurons above threshold. C, Image of LGN terminal fields in acute coronal slices containing V1. The white squares indicate regions of interest that were expanded in the images on the right. D, ChR2 expression in LGN axonal fields is reliable across slices and preparations. Left, Sample image of a coronal slice used for patch-clamp recordings. Right, Average (black) and SD (gray) of profile of the intensity of the fluorescence signal measured in the region of interest (ROI) indicated by the white line in the left image. Width of ROI: 20 μm. The average plot results from the average of measurements across all recorded slices in which neurons fit our criteria for inclusion in the data analysis. The depth axis is aligned in the plot and in the image. The shaded areas indicate the depth at which recordings in L4 and L6 were performed. Note that the low variability of the level of expression of our construct across preparations.
Electrophysiology.
Fourteen days after injection of AAV9 containing the ChR2-GFP construct, rats were anesthetized with isoflurane, and acute coronal slices containing the monocular portion of V1 were prepared as described previously (Maffei et al., 2006). To verify the localization of the effectiveness of ChR2 expression in the injection site, coronal slices containing the LGN were also prepared from each brain. Before recording in V1, patch-clamp recordings were performed in LGN slices to verify sufficient levels of expression of the light-sensitive protein (Fig. 1A). After verification of successful injections, patch-clamp recordings were obtained from visually identified neurons in L4 and L6 of coronal slices containing monocular V1. Triple simultaneous recordings were obtained from L4 and L6 neurons to allow for direct comparison of TC-EPSC properties in L4 and L6 of the same slice. Brief light pulses (1 ms) to activate the LGN terminal field (or LGN neurons in slices containing the LGN) were delivered using an LED blue optic fiber (470 nm) mounted on the fluorescence pathway of an upright microscope (Olympus BX51WI) through a 40× water-immersion objective. The intensity of the light was regulated with a power generator connected to the optic fiber (power: 0.1–0.3 mW/mm2). Duration and frequency of light pulses were synchronized with electrophysiological data acquisition through the analog output of a Multi-Patch clamp amplifier (HEKA). The power of light stimulation for our LED fiber was measured with an optical power meter (Coherent Inc.) placed in the recording chamber. For each recorded neuron a minimum of 50 repetitions of light pulses were delivered at a frequency of 0.05 Hz. Offline, light-evoked TC-EPSCs were aligned at 10–90% of rise time, to obtain the average synaptic response for each neuron and allow quantification of the TC-EPSC.
In a different experimental set, simultaneous triple patch-clamp recordings were obtained within L4 or L6 of slices from the same animal to test for differences in recurrent IC connectivity and TC responsiveness. The angle of slicing was adjusted to preserve the full extent of the neuronal processes in both L4 and L6 (Zarrinpar and Callaway, 2006). Patch-clamp recordings were routinely performed 75–100 μm below the slice surface to ensure well preserved neuronal morphology and connectivity in both layers. Identification of connected pairs was as previously described (Maffei et al., 2004, 2006; Maffei and Turrigiano, 2008). While we did not intentionally target a specific L6 neuron type, the post hoc morphological reconstruction of our recorded neurons indicated that most, if not all, L6 neurons we recorded corresponded to L6 pyramidal neurons with apical dendrites extending to the superficial layers. These neurons are similar in morphology to those described by Bannister et al. (2002)as extending their axonal projections mainly in the infragranular layers.
Light activation of LGN terminal fields were used to evoke TC-EPSCs onto cortical neurons (recorded in voltage-clamp mode) while the amplitude of recurrent EPSPs (recorded in current-clamp mode) was obtained for each triplet recorded. Recorded neurons in the LGN and in V1 were filled with biocytin, and their morphology and location were verified post hoc with immunohistochemical procedures.
Visual deprivation.
Visual deprivation with monocular eyelid suture (MD) was started at P24 ± 1 and maintained for 3 d. Briefly, the animals were anesthetized with a mixture of Ketamine (70 mg/kg) Xylazine (5 mg/kg), and Acepromazine (0.3 mg/kg). Once the animals were deeply anesthetized, the area surrounding one of the eyes was thoroughly cleaned with isopropanol and coated with lidocaine gel to provide local analgesia. The eye was moisturized with eye drops and 4 mattress sutures were placed using polyester suture thread (Ethicon 6-0). After the procedure the animals were allowed to recover on a heating pad and brought back to the animal facility only when fully alert. The experimentalist was blind to the eyelid suture and slice preparation.
Post hoc neuron identification.
After recording, slices were fixed in 4% paraformaldehyde for 1 week. After that, they were washed in PBS, permeabilized with 1% Triton X for 2 h, and then incubated overnight at 4°C in a solution containing Streptavidin-Alexa Fluor 594 1:2000 in PBS and 0.1% Triton X. After a final wash in PBS, slices were mounted with Fluoromount and imaged with a fluorescent microscope (Zeiss Axioskop). Only neurons with pyramidal morphology localized in L4 and L6 of the monocular portion of V1 were included in the analysis.
Statistical analysis for electrophysiology data.
Normality of data distributions was verified with the Kolmogorov–Smirnov test. Statistical significance was determined with two-tailed unpaired t tests. To test for differences across conditions, one-way ANOVAs were applied and followed by post hoc unpaired t tests. χ2 for contingency, Pearson correction, was applied to test for significant differences in IC connection probability or in the proportion of TC-responsive neurons. Spearman rank-order correlation analysis was performed on the amplitude of TC-EPSCs onto a population of recurrently connected and non-recurrently connected neurons in L4 and L6. Where appropriate, data are presented as mean ± SE. For all statistical tests, P values ≤ 0.05 were considered significant.
Solutions.
Artificial CSF contained (in mm): 126 NaCl, 3 KCl, 25 NaHCO3, 1 NaHPO4, 2 MgSO4, 2 CaCl2, 14 Dextrose. Internal solution contained (in mm): 100 K-Glu, 20 KCl, 10 K-HEPES, 4 Mg-ATP, 0.3 Na-GTP, 10 Phosphocreatine, 0.2% Biocytin. The pH of the internal solution was adjusted to 7.35 with KOH and the osmolarity was adjusted to 295 mOsm with sucrose.
Results
The presence of Meyer's Loops, large turns in the bundle of axons projecting from the LGN onto V1, has hampered the possibility to obtain acute slice preparations containing both LGN and V1 circuits. We bypassed this constraint by injecting a construct containing ChR2-GFP, expressing the light- activated conductance, ChR2 (Zhang et al., 2010), into the LGN of P14 rats. Injection of 300 nl of saline solution containing 50*1012 viral particles/nl allowed reliable injections producing consistent expression of the light-gated conductance in LGN terminal fields in V1 across preparations (Figs. 1A,C,D, 2A,B). To verify the site of injection and test that the level of expression of the light-sensitive ChR2 was sufficient to activate LGN neurons above threshold, acute coronal slices containing the LGN were prepared. Patch-clamp recordings were obtained from visually identified LGN neurons and brief (1 ms/0.1–0.3 mW/mm2) pulses of blue light were delivered through a 40× water-immersion objective using a blue LED optic fiber mounted in the fluorescence light path of an upright microscope. Light intensity was adjusted to elicit action potentials in LGN neurons (Fig. 1B) and different frequencies of stimulation were used to ensure that LGN neuron firing was time locked with the light pulses (data not shown). For each animal included in this study, a few LGN neurons were recorded to ensure reliable expression of our construct.
Figure 2.
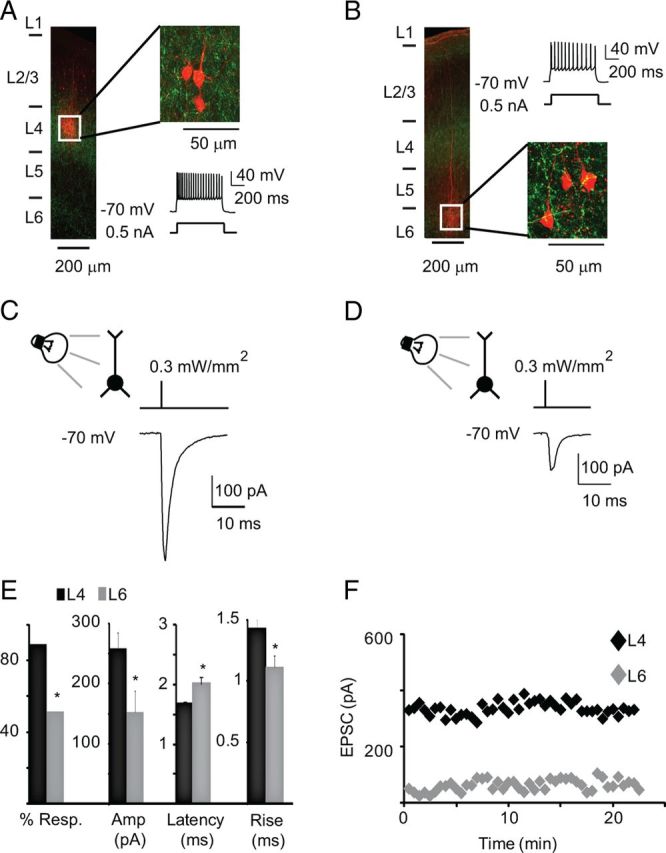
Pyramidal neurons in L4 and upper L6 respond to light activation of TC afferents. A, Post hoc reconstruction of recording configuration in L4. Left, Image of a coronal slice in which a triplet of star pyramidal neurons was recorded in L4. White square, Region in which neurons were recorded. Green, ChR2-GFP; red, biocytin-Alexa Fluor 594. Top right, Enlargement of the region indicated by the white square. Bottom right, Firing pattern of recorded neurons in response to a 0.5 nA current pulse. The firing pattern is typical of L4 star pyramids. B, Representative image of post hoc reconstruction of L6 recordings. Left, Image of coronal slice, with neurons recorded in L6 (see white square). Green, ChR2-GFP; red, biocytin-Alexa Fluor 594. Top right, Firing pattern of L6 neurons in response to a 0.5 nA current pulse. Firing pattern is typical of L6 pyramidal neurons. Bottom right, Enlargement of region indicated by the white square. C, Brief light pulses (1 ms/0.3 mW/mm2) evoke TC-EPSCs in L4 star pyramids. Top, Recording configuration and diagram of light stimulus. Bottom, TC-EPSC evoked from one of the neurons shown in A. D, Brief light pulses (1 ms/0.3 mW/mm2) elicit synaptic response in L6 pyramidal neurons. Top, Recording configuration and diagram of light stimulus. Bottom, Light-evoked response evoked in one of the neurons shown in B. E, Bar plot of the percentage of neurons responding to light pulses (% Resp.), of average TC-EPSC amplitude at 0.3 mW/mm2, of latency of the TC-EPSC onset from stimulus onset (Latency), and of the rise time of the light-evoked TC-EPSC (Decay) in L4 (black) and L6 (gray). F, Time course of the light-evoked responses for the neurons shown in C (L4; black) and D (L6; gray). Light intensity, 0.3 mW/mm2. Data are represented as mean ± SE; asterisks indicate significant differences.
To quantify the reproducibility of levels of expression of the construct in terminal fields in V1, we measured the fluorescence profile of the coronal slices containing V1 and included in the analysis only recordings from slices with comparable levels of expression (Fig. 1D). The reliability of this experimental approach allowed us to prepare acute coronal slices containing V1 and to use blue LED light to directly stimulate LGN terminal fields while recording from visually identified pyramidal neurons in layer 4 and in layer 6.
Baseline synaptic properties of TC inputs onto L4 and L6 neurons
Coronal slices containing V1 were prepared to visualize the extent of the LGN terminal fields. Figure 1C shows confocal images indicating an intense axonal projection from the LGN onto L4 and a significant projection onto L6. The LGN and V1 images shown in Figure 1, A and C, were taken from the same brain. Brief pulses of light (1 ms) successfully activated TC terminal fields and evoked postsynaptic currents in L4 and L6 neurons. The identity and location of recorded neurons were confirmed by analyzing firing properties in response to depolarizing current steps and by post hoc morphological reconstruction (Fig. 2A,B).
In L4 a significantly larger proportion of neurons responded to light stimulation than in L6, suggesting that TC axons contact a larger number of neurons in L4 (Fig. 2E; L4: 91 of 104 tested, 88%; L6: 28 of 58 tested, 48%; χ2 for contingency: p < 0.03). To verify that the evoked TC-EPSCs were indeed monosynaptic in both layers, delays from stimulus onset, rise time, and decay time constants of TC-EPSC were quantified. Latency of the responses and rise and decay time constants were normally distributed (Kolmogorov–Smirnov test, rise: p = 0.4; decay: p = 0.7; latency: p = 0.6). The latency of TC-EPSCs recorded from L4 pyramidal neurons was significantly shorter than that onto L6 pyramidal neurons, while rise time of TC-EPSCs was significantly longer in L4 (Fig. 2E; Latency, L4: 1.6 ± 0.03 ms, n = 54; L6: 2.0 ± 0.1 ms, n = 18; unpaired t test: p < 0.01; Rise, L4: 1.4 ± 0.06 ms; L6: 1.1 ± 0.09 ms; unpaired t test: p < 0.01). No differences in decay time constant were observed (L4: 6.4 ± 0.3 ms, n = 54; L6: 5.7 ± 0.5, n = 18; unpaired t test: p = 0.3). Both in L4 and L6 neurons the amplitude of the light-evoked TC-EPSC was stable for at least 20 min, the average recording time in our experiments (Fig. 2F).
TC-EPSCs onto L4 and L6 differed in a number of baseline synaptic properties. As shown in Figure 3, A and B, the amplitude of TC-EPSC was significantly larger onto L4 star pyramidal neurons at every light intensity tested, resulting in layer-specific input/output curves (Fig. 3A,B, L4, 0.1 mW/mm2: 19.6 ± 3.9 pA; 0.2 mW/mm2: 58.7 ± 10.4 pA; 0.25 mW/mm2: 167.0 ± 59.6 pA; 0.3 mW/mm2: 260.2 ± 25.9 pA; n = 34; L6, 0.1 mW/mm2: 9.6 ± 3.3 pA; 0.2 mW/mm2: 34.8 ± 13.6 pA; 0.25 mW/mm2: 93.4 ± 25.1 pA; 0.3 mW/mm2: 141.4 ± 34.2 pA; n = 14; unpaired t tests, 0.1 mW/mm2: p < 0.05; 0.2 mW/mm2: p < 0.03; 0.25 mW/mm2: p < 0.01; 0.3 mW/mm2: p < 0.03). The paired pulse ratio (PPR) of TC-EPSCs recorded in L4 and L6 pyramidal neurons in response to trains of 3 stimuli was significantly different for frequencies of stimulation up to 10 Hz (Fig. 3C,D; PPR, mean ± SD; 3.3 Hz, L4: 0.56 ± 0.13; L6: 0.68 ± 0.10, p < 0.01; 5 Hz, L4: 0.53 ± 0.13; L6: 0.63 ± 0.15, p < 0.03; 10 Hz, L4: 0.51 ± 0.12; L6: 0.62 ± 0.18, p < 0.05; 20 Hz, L4: 0.59 ± 0.17; L6: 0.66 ± 0.18, p = 0.2 L4: n = 21; L6: n = 14). The short-term plasticity (STP) of TC-EPSCs onto L4 and L6, expressed as ratio of the last to the first TC-EPSC in the train, was significantly different in the frequency range from 3.3 Hz to 20 Hz, further confirming that TC synaptic inputs show layer-specific dynamics (Fig. 3C,D; STP, mean ± SD, 3.3 Hz, L4: 0.43 ± 0.14; L6: 0.56 ± 0.13, p < 0.01; 5 Hz, L4: 0.4 ± 0.1; L6: 0.53 ± 0.13, p < 0.01; 10 Hz, L4: 0.36 ± 0.09; L6: 0.48 ± 0.15, p < 0.01; 20 Hz, L4: 0.42 ± 0.13; L6: 0.52 ± 0.13, p < 0.05; L4: n = 21; L6: n = 14). Frequencies >20 Hz were not tested as the ChR2 current is not reliably activated (Boyden et al., 2005). Together these data demonstrate that TC synapses onto the two main input layers in V1 are not equivalent. The differences in magnitude and dynamics suggest that L4 and L6 are likely to provide a different readout of incoming sensory stimuli.
Figure 3.

Baseline properties of TC-EPSCs in L4 and L6. A, Sample traces of light-evoked TC-EPSCs in L4 and L6 neurons using different light intensities. Left, 0.2 mW/mm2; right, 0.3 mW/mm2. Black, L4; gray, L6. B, Input/output curves for TC-EPSCs in L4 (black) and L6 (gray). C, Representative traces of TC-EPSC dynamics in response to repetitive stimulation at different frequencies. Left column, TC-EPSC1 and 2 in a train of stimuli (at 3, 5 Hz, and 10 Hz) evoked by 1 ms light pulses—0.3 mW/mm2 light intensity in L4 (black) and L6 (gray). Right column, TC-EPSC1 and TC-EPSC3 of a train of stimuli (at 3, 5, and 10 Hz) in L4 (black) and L6 (gray). Dashes indicate that the trace was cut to show only the indicated TC-EPSCs. Light intensity, 0.3 mW/mm2 for L4 and L6. D, Top, Plot of average PPR versus frequency of stimulation. Bottom, Average TC-EPSC3/TC-EPSC1 ratio versus the frequency of stimulation. For both plots, light intensity: 0.3 mW/mm2; black, L4; gray, L6. Data are presented as mean ± SE, asterisks indicate significant differences.
Differences in the IC circuitry of L4 and L6
TC inputs onto L4 and L6 differ in the proportion of responsive neurons, as well as in the amplitude and dynamics of evoked TC-EPSCs. Whether this layer specificity is occurring in the incoming input alone or may be accentuated by differences in the organization of the recurrent intracortical (rIC) circuit in each layer is unknown. To address this we combined optogenetic stimulation of TC afferents with paired recording electrophysiology within each input layer (Fig. 4A,F). Triple simultaneous patch-clamp recordings within layer allowed the detailed analysis of rIC local circuitry. This experimental approach was instrumental to determine the synaptic organization of TC projections contacting nearby neurons in L4 and L6.
Figure 4.
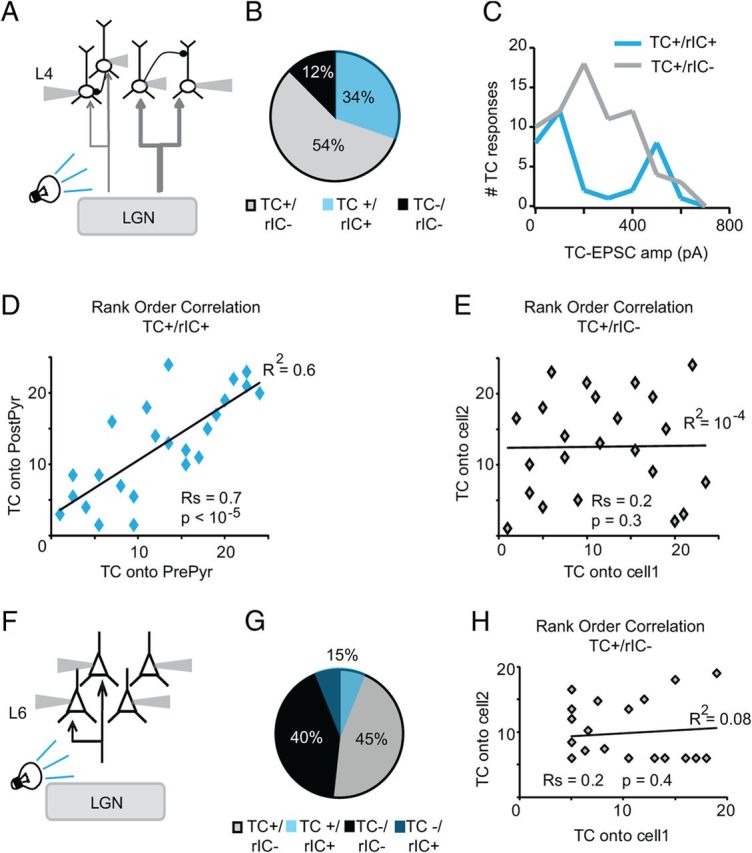
Layer-specific organization of TC circuits. A, Diagram of recording configuration. Light pulses activate LGN terminal fields in V1. Simultaneous patch-clamp recordings are obtained from visually identified star pyramids in L4. Stimulation and recordings are within an area of interest of 100 μm × 100 μm. Light intensity was set at 0.3 mW/mm2. B, Pie chart indicating proportion of star pyramids not responsive to light stimulation of TC afferents and not recurrently connected in L4 (black, TC−/rIC−); of neurons responding to light stimulation of TC afferents, but not recurrently connected (gray, TC+/rIC−); and of neurons responding to light stimulation of TC afferents and also recurrently connected (blue, TC+/rIC+). C, Distribution of the amplitude of light-evoked TC responses for the population of neurons that are not recurrently connected (gray) and for the population of neurons that are recurrently connected within L4 (blue). Note the bimodal distribution of the population of TC+/rIC+ neurons. D, Rank-order correlation of the TC-EPSC onto the presynaptic neurons versus that onto the postsynaptic neuron on TC+/rIC+ neurons. Rs: Spearman rank-order correlation coefficient; p value of the Spearman correlation, p values <0.05 are considered to be significant. E, Rank-order correlation of the TC-EPSC onto nearby neurons that are not recurrently connected. Note that all neurons were recorded within a 100 μm × 100 μm area of interest in L4 and often rIC− neurons were recorded in the same quadruplet with rIC+ ones. Rs: Spearman rank-order correlation coefficient; p value of the Spearman correlation. F, Diagram of recording configuration for L6. Light pulses activate the LGN terminal fields in V1, while multiple patch-clamp recordings are obtained from pyramidal neurons in L6 within a 100 μm × 100 μm area of interest. Light intensity: 0.3 mW/mm2. G, Pie chart indicating the proportion of neurons not responding to light activation of TC axons (black, TC−/rIC−), of neurons not responding to TC activation but recurrently connected (dark blue, TC−/rIC+), of neurons responsive to TC activation but not recurrently connected (gray, TC+/rIC−), and of neurons responsive to TC activation and recurrently connected in L6 (light blue, TC+/rIC+). H, Rank-order correlation of TC-EPSC amplitude onto TC+/rIC− neurons. Rs: Spearman rank-order correlation coefficient; p value of the Spearman correlation.
The synaptic organization of the TC and rIC circuitry in L4 differed significantly from that in L6. As shown in Figure 4B, only 12% of L4 pyramidal neurons did not respond to light activation of TC afferents (13 of 104). Of the 88% responsive neurons (n = 91), 34% were recurrently connected (n = 31), suggesting that, in L4, feedforward TC afferents contact a broad network of highly interconnected pyramidal neurons. The amplitude of TC-EPSCs onto L4 neurons simultaneously recorded within a 100 μm2 region, that were not recurrently connected, was broadly distributed and peaked around 260 pA, the average amplitude of the feedforward inputs recorded in L4 (n unconnected pairs: 23).
The distribution of amplitudes of TC inputs onto simultaneously recorded and recurrently connected neurons (within a 100 μm2 region), on the other hand, showed two clearly identifiable peaks, one centered around 162 pA and one centered around 454 pA (n connected pairs: 24). The distributions of the amplitude of TC-EPSCs onto recurrently connected and non-recurrently connected neurons were significantly different (Kolmogorov–Smirnov test, p < 10−4). The connected neurons receiving small and large TC inputs were further analyzed to test the possibility that they belonged to identifiable subpopulations of pyramidal neurons. No significant difference was detected in the morphology, short-term dynamics and location within L4. Rank-order correlation analysis of TC-EPSC onto the presynaptic neurons versus TC-EPSC onto the postsynaptic neurons unveiled a tight linear relationship between inputs onto recurrently connected neurons (Fig. 4D, Spearman rank-order coefficient: Rs = 0.6; p < 10−5). In contrast, the same analysis applied to TC-EPSCs onto nonconnected neurons recorded simultaneously with connected pairs within the same triplets revealed no significant correlation (Fig. 4E; Rs = 10−4; p = 0.4). In L4, thalamo-recipient neurons that belong to a recurrently interconnected circuit are more likely to receive feedforward inputs with similar magnitude, while neurons intermingled with recurrently connected neurons, but not belonging to a simultaneously recorded recurrently connected subnetwork, are likely to receive inputs with different magnitudes. These findings indicate that in L4, proximity does not predict similarity of the magnitude of the TC inputs, but recurrent connectivity does. In addition, weakly driven and strongly driven connected pairs of neurons were often found in the same group, indicating that the difference in TC drive is not due to differences in the levels of expression of our construct. Recurrently connected L4 pyramidal neurons thus are organized in distinct subcircuits driven either by distinct LGN axons or by the same axon contacting neurons with inputs of different power.
In Figure 4F–H we show the circuit analysis for L6 pyramidal neurons. Recordings in L6 were focused in the upper portion of the layer, where the density of the LGN terminal field was more prominent. By morphological reconstruction L6 neurons included in this analysis belonged to pyramidal neurons with apical dendrites extending into the superficial layers (Bannister et al., 2002; Zarrinpar and Callaway, 2006) (Fig. 2B). Of all recorded pyramidal neurons in this layer 52% responded to light stimuli (21 of 40). The remaining 48% did not respond to light stimulation at any intensity tested (19 of 40). A total of 15% of the recorded L6 neurons were recurrently connected (10 of 66) and evenly distributed among the TC-responsive and -nonresponsive populations (Fig. 4G). This probability of connection is ∼5 times higher than previously reported for rats, and similar to the connectivity reported in cats (Mercer et al., 2005). The discrepancy with previous reports of L6 connectivity in rats may depend on differences in technical approach, multiple simultaneous patch-clamp (this study) versus dual intracellular recordings (Mercer et al., 2005). The location of the recorded neurons may also account for the differences in connectivity as this study focused on neurons in the superficial portion of L6, while other studies tested the connectivity across all of L6 (Mercer et al., 2005).
Nearby, non-recurrently connected neurons within L6 received TC inputs with uncorrelated magnitudes as shown by the plot in Figure 4H (Spearman rank-order coefficient: −0.1; p = 0.6; n = 19 pairs). As expected from the low response probability, non-TC-responsive neurons were often recorded simultaneously with nearby, TC-responsive ones. Our data suggest that TC afferents reaching L6 activate a recurrent IC microcircuit that is less interconnected compared with L4 [IC probability of finding connected pairs: 34% (L4) vs 15% (L6); two-tailed χ2 for contingency: p < 0.04]. In L6 the probability of finding recurrently connected pairs of pyramidal neurons that were also responsive to light stimuli was very low and did not allow us to obtain a sufficiently large population of connected pairs to run a rank-order correlation analysis. Only 40% of recurrently connected L6 neurons belonged to a pair in which both neurons responded to LGN stimulation (4 of 10) and only 1 of 4 received inputs of similar magnitude on presynaptic and postsynaptic neurons. In the remaining 60% of recurrently connected pairs, 2 pairs had only one neuron responding to light stimulation, without a specific preference for the presynaptic or the postsynaptic neuron; while the last 4 connected pairs were not driven by TC stimulation. In addition, in L6, nonconnected neurons that were recorded simultaneously within a 100 μm2 area were activated by afferent TC axons with different synaptic strength, and in most groups recorded only half of the neurons responded to light pulses. These data further confirm that in L6 and L4 both TC and recurrent microcircuits have distinct synaptic organization.
Brief visual deprivation selectively decreases TC inputs onto L4
TC inputs onto L4 and L6 carry information about sensory stimuli (LeVay and Gilbert, 1976). However, our data show distinct magnitude, dynamics, and synaptic organization of TC inputs in the main thalamo-recipient layers in V1. We therefore asked whether L4 and L6 may differ in their responsiveness to changes in sensory drive. To address this we performed a brief (3 d) MD (Maffei et al., 2006) and compared the properties of TC inputs onto L4 and L6 neurons recorded in the monocular region of the hemispheres contralateral (MD) and ipsilateral (C) to the closed eye.
TC-EPSCs recorded in L4 of the deprived hemisphere were significantly smaller than in C at every tested intensity of light stimulation (Fig. 5A,B; 0.1 mW/mm2, C: 21.9 ± 4.3 pA; n = 33; MD 6.9 ± 2.0 pA; n = 25; p < 0.003; 0.2 mW/mm2, C: 54.7 ± 9.7 pA; MD: 22.4 ± 4.5 pA; p < 0.004; 0.25 mW/mm2, C: 191.7 ± 26.7 pA; MD: 94.6 ± 17.3 pA; p < 0.003; 0.3 mW/mm2, C: 259.7 ± 30.8 pA; MD: 132.7 ± 21.6 pA; p < 0.001). The reduction in TC-EPSC amplitude was not accompanied by changes in paired pulse ratio at any frequency of stimulation tested (Fig. 5C; 0.3 mW/mm2, C: n = 33; MD: n = 25; one-way ANOVA: p = 0.6; post hoc unpaired t test: 3.3 Hz: p = 0.6; 5 Hz: p = 0.9; 10 Hz: p = 0.64; 20 Hz: p = 0.69). In addition, the latency of TC-EPSC from the time of stimulation was increased, and the decay time constant of TC-EPSCs decreased significantly (Fig. 5D; Latency, C: 1.6 ± 0.04 ms; n = 33; MD: 1.9 ± 0.09 ms; n = 25; p < 0.004; Decay, C: 6.4 ± 0.3 ms; MD: 5.2 ± 0.2 ms; p = 0.01).
Figure 5.

Layer-specific experience-dependent depression of TC-EPSCs. A, Example traces of TC-EPSCs evoked in L4 star pyramids by light activation of TC afferents in control (black) and deprived (gray) slices. Light intensity: 0.3 mW/mm2. B, Input/output curve of TC-EPSCs in L4. Control, Black; deprived, gray. C, Plot of PPR in response to stimulation at 0.3 mW/mm2 and different frequencies. Control, Black; deprived, gray. D, Bar plot of average latency of L4 TC-EPSC onset from onset of light pulse and decay time constant of L4 TC-EPSCs. Light intensity: 0.3 mW/mm2. Control, Black; deprived, gray. E, Example traces of TC-EPSCs evoked in L6 pyramidal neurons by light activation of TC afferents in control (black) and deprived (gray) slices. Light intensity: 0.3 mW/mm2. F, Input/output curve of TC-EPSCs from L6 pyramidal neurons. Control, Black; deprived, gray. G, Plot of PPR in response to stimulation at different frequencies. Light intensity: 0.3 mW/mm2. Control, Black; deprived, gray. H, Bar plot of average latency of L6 TC-EPSC onset from the onset of the light pulse and decay time constant of L6 TC-EPSCs. Light intensity: 0.3 mW/mm2. Control, Black; deprived, gray. Data are presented as mean ± SE, asterisks indicate significant differences.
In L6 MD did not affect TC-EPSC amplitude onto pyramidal neurons at any intensity of light stimulation (Fig. 5E,F; 0.1 mW/mm2, C: 10.2 ± 3.5 pA; n = 14; MD 8.1 ± 4.3 pA; n = 19; p = 0.82; 0.2 mW/mm2, C: 35.9 ± 14.5 pA; MD: 28.2 ± 16.9 pA; p = 0.84; 0.25 mW/mm2, C: 96.9 ± 26.5 pA; MD: 78.8 ± 34.7 pA; p = 0.88; 0.3 mW/mm2, C: 152.6 ± 35.1 pA; MD: 140.6 ± 46.9 pA; p = 0.85). No significant differences in paired pulse ratio were observed at any frequency of stimulation (Fig. 5G; C: n = 14; MD: n = 19; ANOVA: p = 0.5; post hoc unpaired t test: 3.3 Hz: p = 0.3; 5 Hz: p = 0.8; 10 Hz: p = 0.5; 20 Hz: p = 0.8). The latency of TC-EPSC onset from light stimulation and decay time constant were also unchanged (Fig. 5H; Latency, C: 2.0 ± 0.11 ms, n = 14; MD: 2.4 ± 0.2 ms, n = 19; p = 0.1; Decay, C: 5.1 ± 0.4 ms; MD: 5.4 ± 0.6 ms; p = 0.7). Thus, TC-EPSCs onto L6 pyramidal neurons are not affected by MD. Based on these results we conclude that LGN inputs onto V1 pyramidal neurons have distinct sensitivity to changes in visual drive depending on the location of the postsynaptic neuron. LGN synapses onto L4 are significantly weakened even by MD too short to induce anatomical reorganization of axonal arbors (Antonini et al., 1999); in contrast, TC inputs onto L6 pyramidal neuron are stable in the face of brief changes in sensory drive.
Layer-specific experience-dependent reorganization of TC–IC circuits
The layer specificity of the effects of MD on LGN inputs onto L4 and L6 prompted us to investigate whether rIC circuits within these layers might be affected by 3 d MD differently. In a subset of experiments paired recordings within L4 or in L6 were combined with light stimulation of TC afferents. In L6 we observed no changes in the overall patterns of rIC connectivity and responsiveness to activation of LGN afferents (Fig. 6A). The overall proportion of nonresponsive neurons was 40%, while the remaining 60% produced reliable TC-EPSCs in response to light activation of LGN terminal fields (χ2 for contingency, %TC-responsive neurons in C vs %TC-responsive neurons after MD: p = 0.5). A total of 8% of pyramidal neurons in L6 were recurrently connected. This group was evenly distributed across the population of neurons that responded to activation of TC afferents and the ones that were not responsive (total connected pairs, C: 6 of 58; MD: 4 of 49; χ2 for contingency: p = 0.4). The distribution of TC-EPSC amplitudes was not significantly different in slices from the Control and Deprived hemispheres, confirming the stability of TC as well as rIC connectivity in L6 after brief MD (Fig. 6B).
Figure 6.

MD does not affect the organization of TC/rIC inputs onto L6 pyramidal neurons. A, Pie charts of the proportion of L6 pyramidal neurons not responding to light activation of TC afferents and not recurrently connected (black, TC−/rIC−), of L6 pyramidal neurons not responding to light activation of TC afferents but recurrently connected (dark blue, TC−/rIC+), of L6 pyramidal neurons responding to light activation of TC afferents and not recurrently connected (gray, TC+/rIC−), and of L6 pyramidal neurons responding to light activation of TC afferents and recurrently connected (light blue, TC+/rIC+). Left chart, Control hemisphere (C); right chart, deprived hemisphere (MD). B, Distribution of TC-EPSC amplitudes for L6 TC+/rIC− pyramidal neurons. Light intensity: 0.3 mW/mm2. Control, Black dotted line; deprived, gray solid line.
When a similar analysis was performed in L4 we found that the proportions of TC and rIC connected neurons were not affected by MD (Fig. 7A; χ2 for contingency, %TC-responsive neurons in C versus %TC-responsive neurons after MD: p = 0.6). The amplitude of TC-EPSCs onto all L4 star pyramids was reduced significantly (Fig. 7B–D; TC-EPSC onto TC+ /rIC+, C: 270 ± 35 pA; MD: 172 ± 25 pA; p < 0.03; TC+/rIC−, C: 280 ± 22 pA; MD: 160 ± 23 pA; p < 0.001). Differently, the amplitude of recurrent IC EPSPs was not affected by MD, as shown in previous reports (Maffei et al., 2006; Wang et al., 2012) (Fig. 7B; rIC EPSP, C: 0.8 ± 0.1 mV; MD: 0.6 ± 0.1 mV; p = 0.2). These results indicate that MD specifically weakened TC inputs onto L4 star pyramids, while leaving recurrent rIC excitatory synapses unaffected. A closer analysis of the distribution of TC-EPSC amplitudes on the population of nearby-not recurrently connected neurons revealed a uniform shift toward smaller amplitudes after MD (Fig. 7C; Kolmogorov–Smirnov test: p < 0.003). The distribution of TC-EPSC amplitudes onto recurrently connected neurons, instead, showed that MD affected predominantly the proportion of large-amplitude TC-EPSCs (Fig. 7D, arrow), which was reduced from 33% to 8% (χ2 for contingency: p < 0.01). Thus, the MD-dependent decrease in TC-EPSC amplitude is driven by a reduction in the proportion of the more powerful TC inputs onto L4 star pyramidal neurons. In addition, there was a loss of correlation of TC-EPSC amplitude onto recurrently connected neurons (Fig. 7D, inset; Rs = 0.04; p = 0.1). Although MD did not affect the probability of finding recurrent connections and the proportion of L4 neurons responding to TC afferents, it induced a reorganization of the relationship between TC and recurrent IC connectivity through a nonuniform decrease of TC-EPSC amplitude onto L4 neurons.
Figure 7.

Experience-dependent reorganization of TC/IC inputs onto L4 star pyramids. A, Pie charts of the proportion of L4 star pyramids not responsive to activation of TC afferents and not recurrently connected (black, TC−/rIC−), of L4 star pyramids responsive to activation of TC afferents and not recurrently connected (gray, TC+/rIC−), and of recurrently connected L4 star pyramids that responded to light activation of TC afferents (light blue, TC+/rIC+). Left chart, Control hemisphere (C); right chart, deprived hemisphere (MD). B, Bar plot of average amplitude of TC-EPSC onto TC+/rIC+ L4 star pyramids, of TC-EPSCs onto TC+/rIC− star pyramids, and of rIC-EPSP between L4 star pyramids. Light intensity: 0.3 mW/mm2. Control, Black; deprived, gray. Data are represented as average ± SE; asterisks indicate significant differences. C, Distribution of TC-EPSC amplitudes onto TC+/rIC− L4 star pyramids. Control, Dashed black line; deprived, gray line. Note that the entire distribution is shifted toward smaller amplitudes. D, Distribution of TC-EPSC amplitudes onto TC+/rIC+ star pyramids in L4. Control, Dashed black line; deprived, light blue line. Arrow, Peak of the distribution strongly affected by MD. Inset, Spearman rank-order correlation of TC-EPSP amplitudes onto presynaptic (Pre) and postsynaptic (Post) neurons of TC+/rIC+ L4 star pyramids. Note the MD-induced loss of correlation compared with control conditions (see Fig. 4D). Rs: Spearman rank-order correlation coefficient; p value of the Spearman correlation.
Discussion
L4 and L6 excitatory neurons receive direct input from the LGN (Gilbert, 1977; Hendrickson et al., 1978; Kageyama and Robertson, 1993) and are characterized by fairly large TC-EPSC amplitude and short-term depression in response to trains of stimuli (Sherman, 2012). Studies of thalamocortical (TC) inputs focused primarily on the basic properties of these inputs (Bannister et al., 2002; Binzegger et al., 2004; da Costa and Martin, 2009; Medini, 2011), but did not address possible differences in capacity for plasticity in thalamo-recipient circuits (LeVay and Gilbert, 1976; Landry and Deschênes, 1981; Rose and Metherate, 2001; Bruno and Sakmann, 2006; Cruikshank et al., 2007, 2010 Lee and Sherman, 2008). Differently, studies of experience-dependent plasticity addressed layer specificity, but focused on the comparison of TC and IC circuits (Feldman et al., 1998; Desai et al., 2002; McLaughlin and Juliano, 2003; Maffei et al., 2004; Fox and Wong, 2005; Hensch, 2005; Maffei et al., 2006; Jiang et al., 2007; Maffei and Turrigiano, 2008; Feldman, 2009; Nataraj et al., 2010; Medini, 2011; Oberlaender et al., 2012). In this article we compared synaptic organization and plasticity of LGN inputs onto excitatory neurons in the two main thalamo-recipient layers in V1. Our data demonstrate for the first time that TC inputs onto excitatory neurons in L4 and L6 of V1 have layer-specific magnitude, connectivity, short-term dynamics, and sensitivity to changes in visual experience.
Our data indicate that fewer L6 excitatory neurons responded to stimulation of TC afferents than did those in L4 (88% in L4 vs 48% in L6; χ2 for contingency: p < 0.01). This effect was not due to spatial sampling: in both layers recordings were within a 100 μm2 region and our L6 study was limited to the upper portion of the layer, where the density of TC afferents was highest. Our data suggest that in L6 LGN afferents contact fewer neurons as previously reported (Hubel and Wiesel, 1972; Hendrickson et al., 1978; da Costa and Martin, 2009). The proportion of TC-responsive neurons accounts for a macroscopic organization of LGN inputs in L4 and L6, but does not explain differences in TC-EPSC amplitude. Minimal TC-EPSCs onto V1 pyramidal neurons, similar in size to those expected for putative single axons (Cruikshank et al., 2010), was significantly smaller in L6 than in L4. Input/output curves for L4 and L6 neurons showed similar trends: increasing stimulation intensity successfully recruited inputs in both layers, but activated smaller TC-EPSCs onto L6. Anatomical studies showed that pyramidal neurons in L6 have fewer synapses than those onto L4 neuron (Bannister et al., 2002; Binzegger et al., 2004; da Costa and Martin, 2009). Fewer synaptic contacts could justify the difference in TC-EPSC amplitude. In L4 and L6 the TC-EPSC we recorded could be classified as type A responses: fast, fairly large, and characterized by short-term depression, indicating that the differences in TC-EPSCs did not depend on activation of different populations of inputs (Viaene et al., 2011a,b). Short-term synaptic dynamics of TC-EPSC were layer-specific, with less short-term depression onto L6 neurons, suggesting distinct release properties or saturation of postsynaptic receptors (Zucker and Regher, 2002). Thus, the differences in TC-EPSCs amplitude and dynamics onto L4 and L6 neurons are likely to depend on differences in the number of inputs and on distinct synaptic properties. Short-term dynamics may have a prominent role in information processing at synapses (Klug et al., 2012); thus, L4 and L6 may process incoming information differently because of the different dynamics of TC-EPSCs.
The onset of TC-EPSCs onto L6 showed longer delays from stimulus than those onto L4. Understanding this difference will require direct investigation; however, a number of possibilities can be excluded. Both synaptic delays are below 2 ms; thus, both inputs were monosynaptic. TC-EPSC rise times were shorter in L6; therefore, dendritic filtering does not explain longer delays. As TC afferents send collaterals to L4 and L6 neurons (Freund et al., 1989; Wiser and Callaway, 1996), differences in axonal conduction velocity are not expected to occur. As many L4 and L6 neurons were recorded simultaneously within the same slice, intrinsic properties of ChR2 do not account for the layer specificity of TC synapses. One may speculate that the distinct delay from stimulus may be due, in part, to different dynamics of release or properties of postsynaptic receptors (Hull et al., 2009).
Organization of TC circuits in L4 and L6
TC afferents contact profoundly different IC circuits within L4 and L6. While in L4 approximately one third of TC-responsive pyramidal neurons were recurrently connected, in L6 only a small proportion of thalamo-recipient neurons were interconnected (∼34% in L4 vs 5% in L6; χ2 for contingency: p < 0.01). In L4, recurrently connected neurons received TC-ESPCs with similar magnitude and bimodal amplitude distribution, suggesting that L4 is composed of strongly driven and weakly driven subcircuits. The functional significance of a bimodal distribution of TC-EPSC amplitudes at the moment is unclear. No differences in synaptic and intrinsic properties, or morphology, were identified between neurons receiving strong or weak TC inputs, suggesting that the distribution may represent contacts from different LGN axons. Weakly and strongly driven subcircuits were found in the same slice, thus variability in the level of expression of the ChR2 does not account for the results. Recordings were performed in the monocular region of V1, which is thought to be driven by the contralateral eye. A contribution of weaker ipsilateral inputs is unlikely, but cannot be fully excluded. The relationship between amplitude and distribution of TC inputs does not depend on the distance between neurons. Connected and nonconnected neurons were often part of the same triplet and in close proximity. A possible interpretation of these data is that nonconnected neurons are part of different subcircuits, possibly driven either by inputs with different synaptic properties or by distinct TC afferents. Together, these data suggest that geometrical proximity is not sufficient to predict patterns of connectivity of neurons in L4 (Stepanyants et al., 2008), but that connectivity depends on coordination of TC and IC inputs. This finding is consistent with data about the synaptic organization of inputs from L4 onto L2/3 in V1 (Yoshimura et al., 2005).
Recent findings indicate that IC recurrently connected neurons are more likely to share similar orientation preference (Ko et al., 2011). In addition, recurrently connected neurons may belong to groups of sister-neurons originating from the same progenitor (Yu et al., 2009) and sister-neurons are more likely to share similar visual responsiveness (Li et al., 2012). When interpreting our results in the context of these findings, one may speculate that local subgroups of connected neurons, possibly sister-cells, might be driven by similar LGN inputs. The potential implication of these results would be that IC microcircuits may be composed of recurrently connected neurons with predetermined properties because they belong to a group of neurons generated from the same progenitor and are contacted by LGN afferents carrying the same information. Alternatively, the connectivity of subpopulations of neurons may be determined by experience-dependent refinement of TC and IC connectivity and Hebbian processes (Katz and Shatz, 1996).
We did not observe a significant projection from the LGN into L1 (Antonini et al., 1999). Only few sparse axonal fibers expressed the ChR2-GFP construct right below the pial surface. The age of the animals used in this study may explain these differences: our recordings were limited to P28 instead of adult rodents (Antonini et al., 1999).
Layer specificity and implication for cortical function
The differences in synaptic organization may represent circuit correlates of layer-specific functions. TC inputs to L4 and L6 are carriers of information (Sherman, 2012); however, several findings, including those in this article, suggest that sensory inputs are relayed through very powerful and numerous TC inputs to L4, but weaker and fewer TC inputs to L6 (Hubel and Wiesel, 1972; Binzegger et al., 2004; da Costa and Martin, 2009). The number and amplitude of LGN inputs onto L4 excitatory neurons may explain the similarity between the receptive fields of LGN neurons and L4 simple cells (Alonso et al., 2001). The propagation of similar functional properties from the LGN to L4 may also be favored by high recurrent IC connectivity and by recurrent IC subcircuit driven by similar TC inputs.
Differences in the proportion of TC-responsive neurons, layer-specific synaptic dynamics, and distinct sensitivity to visual experience suggest that L4 and L6 are activated differently by the sensory input, and may convey different sensory information to V1 (Klug et al., 2012). Brief MD reduces TC-EPSC amplitude onto L4 neurons only. This effect was specific to TC synapses as the amplitude of IC inputs between L4 pyramidal neurons was unchanged. Thus, L4 detects changes in visual activity rapidly and possibly relays them to the other layers in V1. On the other hand, TC inputs onto L6 pyramidal neurons are not affected by brief MD, but can adjust in response to longer periods of visual deprivation (Krahe and Guido, 2011; Petrus et al., 2011). L4 and L6 neurons are interconnected (Binzegger et al., 2004), thus the layer-specific changes in TC-EPSCs may unbalance TC and IC activity, initiating a cascade of events that will lead to loss of visual responsiveness (Frenkel and Bear, 2004). Recent findings indicate that L6 plays a major role in gain modulation and actively suppresses the activity of all other layers (Olsen et al., 2012). Delayed response of L6 to altered visual drive (Petrus et al., 2011) may allow L4 to sense differential activation from the LGN and rewire accordingly, while L6-dependent gain modulation is adjusted only later. This process may lead to desynchronized activation of TC and IC circuits, a phenomenon occurring in several brain areas (Butler et al., 2001; Llinás and Ribary, 2001; Butler and Javitt, 2005; Normann et al., 2007; Oberlaender et al., 2012) and thought to be implicated in neurological disorders of sensory (Sehatpour et al., 2010) and cognitive functions (Yeap et al., 2006, 2009; Leitman et al., 2010).
Footnotes
This work was supported by National Institutes of Health Grant NIH/R01 EY019885 to A.M. We thank Dr. Paul Adams, Dr. Alfredo Fontanini, Dr. Yury Garkun, Trevor Griffen, Dr. Giancarlo La Camera, Dr. Lorna Role (SUNY-Stony Brook), Dr. Gina Turrigiano (Brandeis University), and Dr. Jose-Manuel Alonso (SUNY-Optometry) for useful comments and discussion on data and manuscript.
References
- Alonso JM, Usrey WM, Reid RC. Rules of connectivity between geniculate cells and simple cells in cat primary visual cortex. J Neurosci. 2001;21:4002–4015. doi: 10.1523/JNEUROSCI.21-11-04002.2001. [DOI] [PMC free article] [PubMed] [Google Scholar]
- Amitai Y. Thalamocortical synaptic connections: efficacy, modulation, inhibition and plasticity. Rev Neurosci. 2001;12:159–173. doi: 10.1515/revneuro.2001.12.2.159. [DOI] [PubMed] [Google Scholar]
- Andolina IM, Jones HE, Wang W, Sillito AM. Corticothalamic feedback enhances stimulus response precision in the visual system. Proc Natl Acad Sci U S A. 2007;104:1685–1690. doi: 10.1073/pnas.0609318104. [DOI] [PMC free article] [PubMed] [Google Scholar]
- Antonini A, Fagiolini M, Stryker MP. Anatomical correlates of functional plasticity in mouse visual cortex. J Neurosci. 1999;19:4388–4406. doi: 10.1523/JNEUROSCI.19-11-04388.1999. [DOI] [PMC free article] [PubMed] [Google Scholar]
- Banitt Y, Martin KA, Segev I. A biologically realistic model of contrast invariant orientation tuning by thalamocortical synaptic depression. J Neurosci. 2007;27:10230–10239. doi: 10.1523/JNEUROSCI.1640-07.2007. [DOI] [PMC free article] [PubMed] [Google Scholar]
- Bannister NJ, Nelson JC, Jack JJ. Excitatory inputs to spiny cells in layers 4 and 6 of cat striate cortex. Philos Trans R Soc Lond B Biol Sci. 2002;357:1793–1808. doi: 10.1098/rstb.2002.1160. [DOI] [PMC free article] [PubMed] [Google Scholar]
- Binzegger T, Douglas RJ, Martin KA. A quantitative map of the circuit of cat primary visual cortex. J Neurosci. 2004;24:8441–8453. doi: 10.1523/JNEUROSCI.1400-04.2004. [DOI] [PMC free article] [PubMed] [Google Scholar]
- Boyden ES, Zhang F, Bamberg E, Nagel G, Deisseroth K. Millisecond-timescale, genetically targeted optical control of neural activity. Nat Neurosci. 2005;8:1263–1268. doi: 10.1038/nn1525. [DOI] [PubMed] [Google Scholar]
- Briggs F. Organizing principles of cortical layer 6. Front Neural Circuits. 2010;4:3. doi: 10.3389/neuro.04.003.2010. [DOI] [PMC free article] [PubMed] [Google Scholar]
- Briggs F, Usrey WM. Corticogeniculate feedback and visual processing in the primate. J Physiol. 2011;589:33–40. doi: 10.1113/jphysiol.2010.193599. [DOI] [PMC free article] [PubMed] [Google Scholar]
- Bruno RM. Synchrony in sensation. Curr Opin Neurobiol. 2011;21:701–708. doi: 10.1016/j.conb.2011.06.003. [DOI] [PMC free article] [PubMed] [Google Scholar]
- Bruno RM, Sakmann B. Cortex is driven by weak but synchronously active thalamocortical synapses. Science. 2006;312:1622–1627. doi: 10.1126/science.1124593. [DOI] [PubMed] [Google Scholar]
- Butler PD, Javitt DC. Early-stage visual processing deficits in schizophrenia. Curr Opin Psychiatry. 2005;18:151–157. doi: 10.1097/00001504-200503000-00008. [DOI] [PMC free article] [PubMed] [Google Scholar]
- Butler PD, Schechter I, Zemon V, Schwartz SG, Greenstein VC, Gordon J, Schroeder CE, Javitt DC. Dysfunction of early-stage visual processing in schizophrenia. Am J Psychiatry. 2001;158:1126–1133. doi: 10.1176/appi.ajp.158.7.1126. [DOI] [PubMed] [Google Scholar]
- Castro-Alamancos MA. Dynamics of sensory thalamocortical synaptic networks during information processing states. Prog Neurobiol. 2004;74:213–247. doi: 10.1016/j.pneurobio.2004.09.002. [DOI] [PubMed] [Google Scholar]
- Catalano SM, Shatz CJ. Activity-dependent cortical target selection by thalamic axons. Science. 1998;281:559–562. doi: 10.1126/science.281.5376.559. [DOI] [PubMed] [Google Scholar]
- Coleman JE, Nahmani M, Gavornik JP, Haslinger R, Heynen AJ, Erisir A, Bear MF. Rapid structural remodeling of thalamocortical synapses parallels experience-dependent functional plasticity in mouse primary visual cortex. J Neurosci. 2010;30:9670–9682. doi: 10.1523/JNEUROSCI.1248-10.2010. [DOI] [PMC free article] [PubMed] [Google Scholar]
- Cruikshank SJ, Lewis TJ, Connors BW. Synaptic basis for intense thalamocortical activation of feedforward inhibitory cells in neocortex. Nat Neurosci. 2007;10:462–468. doi: 10.1038/nn1861. [DOI] [PubMed] [Google Scholar]
- Cruikshank SJ, Urabe H, Nurmikko AV, Connors BW. Pathway-specific feedforward circuits between thalamus and neocortex revealed by selective optical stimulation of axons. Neuron. 2010;65:230–245. doi: 10.1016/j.neuron.2009.12.025. [DOI] [PMC free article] [PubMed] [Google Scholar]
- da Costa NM, Martin KA. Selective targeting of the dendrites of corticothalamic cells by thalamic afferents in area 17 of the cat. J Neurosci. 2009;29:13919–13928. doi: 10.1523/JNEUROSCI.2785-09.2009. [DOI] [PMC free article] [PubMed] [Google Scholar]
- Desai NS, Cudmore RH, Nelson SB, Turrigiano GG. Critical periods for experience-dependent synaptic scaling in visual cortex. Nat Neurosci. 2002;5:783–789. doi: 10.1038/nn878. [DOI] [PubMed] [Google Scholar]
- Feldman DE. Synaptic mechanisms for plasticity in neocortex. Annu Rev Neurosci. 2009;32:33–55. doi: 10.1146/annurev.neuro.051508.135516. [DOI] [PMC free article] [PubMed] [Google Scholar]
- Feldman DE, Nicoll RA, Malenka RC, Isaac JT. Long-term depression at thalamocortical synapses in developing rat somatosensory cortex. Neuron. 1998;21:347–357. doi: 10.1016/s0896-6273(00)80544-9. [DOI] [PubMed] [Google Scholar]
- Fox K, Wong RO. A comparison of experience-dependent plasticity in the visual and somatosensory systems. Neuron. 2005;48:465–477. doi: 10.1016/j.neuron.2005.10.013. [DOI] [PubMed] [Google Scholar]
- Frenkel MY, Bear MF. How monocular deprivation shifts ocular dominance in visual cortex of young mice. Neuron. 2004;44:917–923. doi: 10.1016/j.neuron.2004.12.003. [DOI] [PubMed] [Google Scholar]
- Freund TF, Martin KA, Soltesz I, Somogyi P, Whitteridge D. Arborisation pattern and postsynaptic targets of physiologically identified thalamocortical afferents in striate cortex of the macaque monkey. J Comp Neurol. 1989;289:315–336. doi: 10.1002/cne.902890211. [DOI] [PubMed] [Google Scholar]
- Gilbert CD. Laminar differences in receptive field properties of cells in cat primary visual cortex. J Physiol. 1977;268:391–421. doi: 10.1113/jphysiol.1977.sp011863. [DOI] [PMC free article] [PubMed] [Google Scholar]
- Gu Y, Arruda-Carvalho M, Wang J, Janoschka SR, Josselyn SA, Frankland PW, Ge S. Optical controlling reveals time-dependent roles for adult-born dentate granule cells. Nat Neurosci. 2012;15:1700–1706. doi: 10.1038/nn.3260. [DOI] [PMC free article] [PubMed] [Google Scholar]
- Hendrickson AE, Wilson JR, Ogren MP. The neuroanatomical organization of pathways between the dorsal lateral geniculate nucleus and visual cortex in Old World and New World primates. J Comp Neurol. 1978;182:123–136. doi: 10.1002/cne.901820108. [DOI] [PubMed] [Google Scholar]
- Hensch TK. Critical period plasticity in local cortical circuits. Nat Rev Neurosci. 2005;6:877–888. doi: 10.1038/nrn1787. [DOI] [PubMed] [Google Scholar]
- Hubel DH, Wiesel TN. Laminar and columnar distribution of geniculo-cortical fibers in the macaque monkey. J Comp Neurol. 1972;146:421–450. doi: 10.1002/cne.901460402. [DOI] [PubMed] [Google Scholar]
- Hull C, Isaacson JS, Scanziani M. Postsynaptic mechanisms govern the differential excitation of cortical neurons by thalamic inputs. J Neurosci. 2009;29:9127–9136. doi: 10.1523/JNEUROSCI.5971-08.2009. [DOI] [PMC free article] [PubMed] [Google Scholar]
- Jiang B, Treviño M, Kirkwood A. Sequential development of long-term potentiation and depression in different layers of the mouse visual cortex. J Neurosci. 2007;27:9648–9652. doi: 10.1523/JNEUROSCI.2655-07.2007. [DOI] [PMC free article] [PubMed] [Google Scholar]
- Kageyama GH, Robertson RT. Development of geniculocortical projections to visual cortex in rat: evidence early ingrowth and synaptogenesis. J Comp Neurol. 1993;335:123–148. doi: 10.1002/cne.903350109. [DOI] [PubMed] [Google Scholar]
- Katz LC, Shatz CJ. Synaptic activity and the construction of cortical circuits. Science. 1996;274:1133–1138. doi: 10.1126/science.274.5290.1133. [DOI] [PubMed] [Google Scholar]
- Khibnik LA, Cho KK, Bear MF. Relative contribution of feedforward excitatory connections to expression of ocular dominance plasticity in layer 4 of visual cortex. Neuron. 2010;66:493–500. doi: 10.1016/j.neuron.2010.04.012. [DOI] [PMC free article] [PubMed] [Google Scholar]
- Klug A, Borst JG, Carlson BA, Kopp-Scheinpflug C, Klyachko VA, Xu-Friedman MA. How do short-term changes at synapses fine-tune information processing? J Neurosci. 2012;32:14058–14063. doi: 10.1523/JNEUROSCI.3348-12.2012. [DOI] [PMC free article] [PubMed] [Google Scholar]
- Ko H, Hofer SB, Pichler B, Buchanan KA, Sjöström PJ, Mrsic-Flogel TD. Functional specificity of local synaptic connections in neocortical networks. Nature. 2011;473:87–91. doi: 10.1038/nature09880. [DOI] [PMC free article] [PubMed] [Google Scholar]
- Krahe TE, Guido W. Homeostatic plasticity in the visual thalamus by monocular deprivation. J Neurosci. 2011;31:6842–6849. doi: 10.1523/JNEUROSCI.1173-11.2011. [DOI] [PMC free article] [PubMed] [Google Scholar]
- Landry P, Deschênes M. Intracortical arborizations and receptive fields of identified ventrobasal thalamocortical afferents to the primary somatic sensory cortex in the cat. J Comp Neurol. 1981;199:345–371. doi: 10.1002/cne.901990304. [DOI] [PubMed] [Google Scholar]
- Lee CC, Sherman SM. Synaptic properties of thalamic and intracortical inputs to layer 4 of the first- and higher-order cortical areas in the auditory and somatosensory systems. J Neurophysiol. 2008;100:317–326. doi: 10.1152/jn.90391.2008. [DOI] [PMC free article] [PubMed] [Google Scholar]
- Leitman DI, Sehatpour P, Higgins BA, Foxe JJ, Silipo G, Javitt DC. Sensory deficits and distributed hierarchical dysfunction in schizophrenia. Am J Psychiatry. 2010;167:818–827. doi: 10.1176/appi.ajp.2010.09030338. [DOI] [PubMed] [Google Scholar]
- LeVay S, Gilbert CD. Laminar patterns of geniculocortical projection in the cat. Brain Res. 1976;113:1–19. doi: 10.1016/0006-8993(76)90002-0. [DOI] [PubMed] [Google Scholar]
- Li Y, Lu H, Cheng PL, Ge S, Xu H, Shi SH, Dan Y. Clonally related visual cortical neurons show similar stimulus feature selectivity. Nature. 2012;486:118–121. doi: 10.1038/nature11110. [DOI] [PMC free article] [PubMed] [Google Scholar]
- Llinás R, Ribary U. Consciousness and the brain. The thalamocortical dialogue in health and disease. Ann N Y Acad Sci. 2001;929:166–175. [PubMed] [Google Scholar]
- Llinás RR, Ribary U, Jeanmonod D, Kronberg E, Mitra PP. Thalamocortical dysrhythmia: a neurological and neuropsychiatric syndrome characterized by magnetoencephalography. Proc Natl Acad Sci U S A. 1999;96:15222–15227. doi: 10.1073/pnas.96.26.15222. [DOI] [PMC free article] [PubMed] [Google Scholar]
- Maffei A, Turrigiano GG. Multiple modes of network homeostasis in visual cortical layer 2/3. J Neurosci. 2008;28:4377–4384. doi: 10.1523/JNEUROSCI.5298-07.2008. [DOI] [PMC free article] [PubMed] [Google Scholar]
- Maffei A, Nelson SB, Turrigiano GG. Selective reconfiguration of layer 4 visual cortical circuitry by visual deprivation. Nat Neurosci. 2004;7:1353–1359. doi: 10.1038/nn1351. [DOI] [PubMed] [Google Scholar]
- Maffei A, Nataraj K, Nelson SB, Turrigiano GG. Potentiation of cortical inhibition by visual deprivation. Nature. 2006;443:81–84. doi: 10.1038/nature05079. [DOI] [PubMed] [Google Scholar]
- McLaughlin DF, Juliano SL. Developmental regulation of plasticity in the forepaw representation of ferret somatosensory cortex. J Neurophysiol. 2003;89:2289–2298. doi: 10.1152/jn.01053.2002. [DOI] [PubMed] [Google Scholar]
- Medini P. Layer- and cell-type-specific subthreshold and suprathreshold effects of long-term monocular deprivation in rat visual cortex. J Neurosci. 2011;31:17134–17148. doi: 10.1523/JNEUROSCI.2951-11.2011. [DOI] [PMC free article] [PubMed] [Google Scholar]
- Mercer A, West DC, Morris OT, Kirchhecker S, Kerkhoff JE, Thomson AM. Excitatory connections made by presynaptic cortico-cortical pyramidal cells in layer 6 of the neocortex. Cereb Cortex. 2005;15:1485–1496. doi: 10.1093/cercor/bhi027. [DOI] [PubMed] [Google Scholar]
- Nataraj K, Le Roux N, Nahmani M, Lefort S, Turrigiano G. Visual deprivation suppresses L5 pyramidal neuron excitability by preventing the induction of intrinsic plasticity. Neuron. 2010;68:750–762. doi: 10.1016/j.neuron.2010.09.033. [DOI] [PMC free article] [PubMed] [Google Scholar]
- Normann C, Schmitz D, Fürmaier A, Döing C, Bach M. Long-term plasticity of visually evoked potentials in humans is altered in major depression. Biol Psychiatry. 2007;62:373–380. doi: 10.1016/j.biopsych.2006.10.006. [DOI] [PubMed] [Google Scholar]
- Oberlaender M, Ramirez A, Bruno RM. Sensory experience restructures thalamocortical axons during adulthood. Neuron. 2012;74:648–655. doi: 10.1016/j.neuron.2012.03.022. [DOI] [PMC free article] [PubMed] [Google Scholar]
- Olsen SR, Bortone DS, Adesnik H, Scanziani M. Gain control by layer six in cortical circuits of vision. Nature. 2012;483:47–52. doi: 10.1038/nature10835. [DOI] [PMC free article] [PubMed] [Google Scholar]
- Peters A, Feldman ML. The projection of the lateral geniculate nucleus to area 17 of the rat cerebral cortex. IV. Terminations upon spiny dendrites. J Neurocytol. 1977;6:669–689. doi: 10.1007/BF01176379. [DOI] [PubMed] [Google Scholar]
- Petreanu L, Huber D, Sobczyk A, Svoboda K. Channelrhodopsin-2-assisted circuit mapping of long-range callosal projections. Nat Neurosci. 2007;10:663–668. doi: 10.1038/nn1891. [DOI] [PubMed] [Google Scholar]
- Petrus E, Anguh TT, Pho H, Lee A, Gammon N, Lee HK. Developmental switch in the polarity of experience-dependent synaptic changes in layer 6 of mouse visual cortex. J Neurophysiol. 2011;106:2499–2505. doi: 10.1152/jn.00111.2011. [DOI] [PMC free article] [PubMed] [Google Scholar]
- Rose HJ, Metherate R. Thalamic stimulation largely elicits orthodromic, rather than antidromic, cortical activation in an auditory thalamocortical slice. Neuroscience. 2001;106:331–340. doi: 10.1016/s0306-4522(01)00282-2. [DOI] [PubMed] [Google Scholar]
- Sehatpour P, Dias EC, Butler PD, Revheim N, Guilfoyle DN, Foxe JJ, Javitt DC. Impaired visual object processing across an occipital-frontal-hippocampal brain network in schizophrenia: an integrated neuroimaging study. Arch Gen Psychiatry. 2010;67:772–782. doi: 10.1001/archgenpsychiatry.2010.85. [DOI] [PMC free article] [PubMed] [Google Scholar]
- Sengpiel F, Baddeley RJ, Freeman TC, Harrad R, Blakemore C. Different mechanisms underlie three inhibitory phenomena in cat area 17. Vision Res. 1998;38:2067–2080. doi: 10.1016/s0042-6989(97)00413-6. [DOI] [PubMed] [Google Scholar]
- Sherman SM. Thalamocortical interactions. Curr Opin Neurobiol. 2012;22:575–579. doi: 10.1016/j.conb.2012.03.005. [DOI] [PMC free article] [PubMed] [Google Scholar]
- Sherman SM, Guillery RW. The role of the thalamus in the flow of information to the cortex. Philos Trans R Soc Lond B Biol Sci. 2002;357:1695–1708. doi: 10.1098/rstb.2002.1161. [DOI] [PMC free article] [PubMed] [Google Scholar]
- Stepanyants A, Hirsch JA, Martinez LM, Kisvárday ZF, Ferecskó AS, Chklovskii DB. Local potential connectivity in cat primary visual cortex. Cereb Cortex. 2008;18:13–28. doi: 10.1093/cercor/bhm027. [DOI] [PubMed] [Google Scholar]
- Tieman SB. The anatomy of geniculocortical connections in monocularly deprived cats. Cell Mol Neurobiol. 1985;5:35–45. doi: 10.1007/BF00711084. [DOI] [PMC free article] [PubMed] [Google Scholar]
- Viaene AN, Petrof I, Sherman SM. Synaptic properties of thalamic input to the subgranular layers of primary somatosensory and auditory cortices in the mouse. J Neurosci. 2011a;31:12738–12747. doi: 10.1523/JNEUROSCI.1565-11.2011. [DOI] [PMC free article] [PubMed] [Google Scholar]
- Viaene AN, Petrof I, Sherman SM. Synaptic properties of thalamic input to layers 2/3 and 4 of primary somatosensory and auditory cortices. J Neurophysiol. 2011b;105:279–292. doi: 10.1152/jn.00747.2010. [DOI] [PMC free article] [PubMed] [Google Scholar]
- Wang HP, Spencer D, Fellous JM, Sejnowski TJ. Synchrony of thalamocortical inputs maximizes cortical reliability. Science. 2010;328:106–109. doi: 10.1126/science.1183108. [DOI] [PMC free article] [PubMed] [Google Scholar]
- Wang L, Fontanini A, Maffei A. Experience-dependent switch in sign and mechanisms for plasticity in layer 4 of primary visual cortex. J Neurosci. 2012;32:10562–10573. doi: 10.1523/JNEUROSCI.0622-12.2012. [DOI] [PMC free article] [PubMed] [Google Scholar]
- Wiser AK, Callaway EM. Contributions of individual layer 6 pyramidal neurons to local circuitry in macaque primary visual cortex. J Neurosci. 1996;16:2724–2739. doi: 10.1523/JNEUROSCI.16-08-02724.1996. [DOI] [PMC free article] [PubMed] [Google Scholar]
- Yeap S, Kelly SP, Sehatpour P, Magno E, Javitt DC, Garavan H, Thakore JH, Foxe JJ. Early visual sensory deficits as endophenotypes for schizophrenia: high-density electrical mapping in clinically unaffected first-degree relatives. Arch Gen Psychiatry. 2006;63:1180–1188. doi: 10.1001/archpsyc.63.11.1180. [DOI] [PubMed] [Google Scholar]
- Yeap S, Kelly S, Reilly R, Thakore J, Foxe J. Visual sensory processing deficits in patients with bipolar disorder revealed through high-density electrical mapping. J Psychiatry Neurosci. 2009;34:549–564. [PMC free article] [PubMed] [Google Scholar]
- Yoshimura Y, Dantzker JL, Callaway EM. Excitatory cortical neurons form fine-scale functional networks. Nature. 2005;433:868–873. doi: 10.1038/nature03252. [DOI] [PubMed] [Google Scholar]
- Yu YC, Bultje RS, Wang X, Shi SH. Specific synapses develop preferentially among sister excitatory neurons in the neocortex. Nature. 2009;458:501–504. doi: 10.1038/nature07722. [DOI] [PMC free article] [PubMed] [Google Scholar]
- Zarrinpar A, Callaway EM. Local connections to specific types of layer 6 neurons in the rat visual cortex. J Neurophysiol. 2006;95:1751–1761. doi: 10.1152/jn.00974.2005. [DOI] [PubMed] [Google Scholar]
- Zhang F, Gradinaru V, Adamantidis AR, Durand R, Airan RD, de Lecea L, Deisseroth K. Optogenetic interrogation of neural circuits: technology for probing mammalian brain structures. Nat Protoc. 2010;5:439–456. doi: 10.1038/nprot.2009.226. [DOI] [PMC free article] [PubMed] [Google Scholar]
- Zucker RS, Regher WG. Short term synaptic plasticity. Annu Rev Physiol. 2002;64:355–405. doi: 10.1146/annurev.physiol.64.092501.114547. [DOI] [PubMed] [Google Scholar]