Abstract
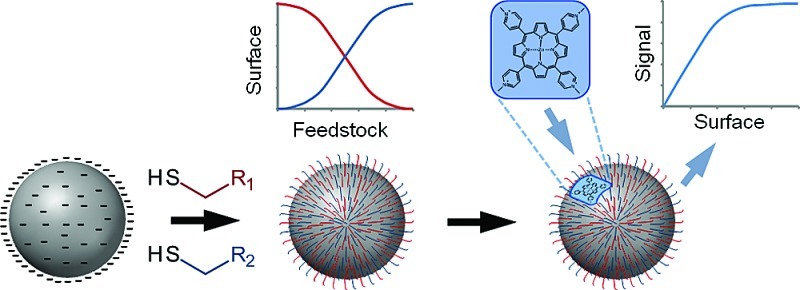
Modifying the surfaces of metal nanoparticles with self-assembled monolayers of functionalized thiols provides a simple and direct method to alter their surface properties. Mixed self-assembled monolayers can extend this approach since, in principle, the surfaces can be tuned by altering the proportion of each modifier that is adsorbed. However, this works best if the composition and microstructure of the monolayers can be controlled. Here, we have modified preprepared silver colloids with binary mixtures of thiols at varying concentrations and modifier ratios. Surface-enhanced Raman spectroscopy was then used to determine the effect of altering these parameters on the composition of the resulting mixed monolayers. The data could be explained using a new model based on a modified competitive Langmuir approach. It was found that the composition of the mixed monolayer only reflected the ratio of modifiers in the feedstock when the total amount of modifier was sufficient for approximately one monolayer coverage. At higher modifier concentrations the thermodynamically favored modifier dominated, but working at near monolayer concentrations allowed the surface composition to be controlled by changing the ratios of modifiers. Finally, a positively charged porphyrin probe molecule was used to investigate the microstructure of the mixed monolayers, i.e., homogeneous versus domains. In this case the modifier domains were found to be <2 nm.
Keywords: nanoparticles, surface modification, mixed monolayers, SERS, thiols, SAMs, colloid
Metal nanoparticles are ubiquitous throughout nanoscience.1,2 The two main approaches to designing particles with required properties are to change the size, shape, or composition of the bulk particles and/or to modify the surface. In many cases both the structure and surface properties need to be optimized, for example to create particles with appropriate optical properties that can also interact with a biochemical target.3,4 While there has been enormous effort and success in the development of methods for preparation of particles of controlled sizes and shapes, including prisms,5,6 rods,7 cubes,8 and nanostars,9,10 as well as bumpy gold nanoparticles,11 hollow gold nanoparticles,12 and nanoshells,13 less research has been carried out on methods for controlling nanoparticle surface properties. For Au and Ag nanoparticles, by far the most popular method is to use self-assembled monolayers (SAMs) of ω-substituted thiols that spontaneously bond to the surface via strong covalent metal–thiol bonds.2 This approach is a simple extension of methods that were first developed for modification of bulk metal substrates, e.g., electrodes and metal films.14
Modification of nanoparticles with single thiols allows gross control of the surface chemical properties by changing the nature of the modifier, but the possibilities for finer tunability, e.g., by using alkanethiols with different chain lengths,15 are limited. However, it should be possible to use mixed monolayers of two or more thiols to create nanoparticles with properties intermediate between those obtained with the pure modifiers by altering the relative proportion of both on the surface. The advantage of this method is that it potentially allows continuous tuning of the surface properties between very different extremes. Indeed, methods for preparing mixed thiol monolayers on bulk metal surfaces are well established, and these have allowed tuning of properties, such as contact angles, between extreme values simply by altering the relative proportions of hydrophilic and hydrophobic thiols on the surface.16 However, the most widely used methods for modifying bulk metals, which are based on sequential immersion in solutions of different thiols (which may also include addition and removal of chemical templating agents)17 or immersion in a single solution of a mixture of thiols,18,19 do not transfer readily to direct modification of colloids, which cannot be immersed and then removed at will. An alternative approach, in which the particles are synthesized in the presence of capping agents, has become popular.20 Originally, only single capping agents were used, but the use of mixtures is becoming more common. For example, Stellacci et al. have produced Au nanoparticles capped with thiols such as octanethiol and mercaptopropionic acid via a one-step route21 and shown that they form ribbon-like domains on the surface due to the surface curvature,21−23 which disappear when surface curvature is reduced.24 Alternatively, a place exchange reaction may be used to partly replace the capping agent with a different compound.25,26
While there is some degree of control over the size of nanoparticles produced using capping agents,27 most previous studies have focused on small gold spherical nanoparticles or rhomboid nanoclusters.28,29 The major problem of the capping agent approach for functionalizing nanoparticles is that it removes the simplicity and flexibility of being able to prepare particles with the desired size and shape before selecting their surface properties through chemical modification. We prefer the more flexible approach of first synthesizing the nanoparticles and then functionalizing them with mixtures of thiols, since this should allow us, for example, to make nanoprisms, rods, or spherical particles using different preparation methods but then to use a standard method to functionalize their surfaces. There have been some reports of the approach being followed for spherical Au nanoparticles.4,30,31The main difficulty of this method is that the composition of the feedstock is not necessarily reflected in the resulting SAM.30,32 While it is possible to use trial and error to find appropriate reaction conditions, these are not expected to be generally transferable between different particles and modifier mixtures. Here our objective is to develop an understanding that will allow the process to be controlled and surfaces to be generated in a predictable way. The model systems investigated were hydroxylamine-reduced silver colloid (HRSC),33 citrate-reduced silver colloid (CRSC),34 or Ag nanoprisms,35 which were synthesized by literature methods, then modified using mixed thiol feedstocks of various concentrations. All of the particles used in this study provide strong enhancement of the surface species’ Raman signals, which allows the SAM composition to be monitored in situ using surface-enhanced Raman spectroscopy (SERS), since each compound gives its own characteristic Raman spectrum.4,36
An additional important aspect of mixed SAMs on nanoparticles is that cooperative effects from both modifiers may provide properties that cannot be introduced using single modifiers.37 For example, we have recently developed a SERS sensor that used a mixed monolayer composed of mercaptopropanesulfonate (MPS) and benzyl mercaptan (BZM) and promoted 3,4-methylenedioxy-N-methylamphetamine (MDMA) adsorption, while those modified with only MPS or BZM showed no MDMA binding.36 The microstructure of the mixed monolayer is crucial in determining whether such synergy is possible. If the modifiers sit in large domains on the surface, the only part of the surface where both compounds are found in close proximity is at the boundaries of these domains (this is also believed to be the site of nucleation for some place exchange reactions).38 Alternatively, if there is intimate mixing of the modifiers, then the entire surface will have properties that are different from either of the two modifiers. In this work we have developed a method that allows nanoparticles modified with mixed SAMs to be prepared with a desired composition and have then used a charged SERS-active porphyrin molecule to probe the microstructure of the surfaces of these modified nanoparticles.
Results and Discussion
Figure 1 illustrates the general approach we have followed, which is to add dilute mixtures of thiol modifiers to SERS-active Ag colloids that had been prepared using standard literature methods33−35 and to monitor the surface composition of the resulting modified nanoparticles using SERS. Mercaptopropanesulfonate (MPS) and 1-pentanethiol (PT) modifiers were used in this test system, since their SERS spectra were quite distinct and simple comparison of the strong bands at 802 (MPS) and 896 cm–1 (PT) allows the relative proportions of each to be estimated directly. Figure 1C shows the SERS spectra of a series of colloids prepared with simple 1:1 MPS:PT modifying feedstocks that had different total modifier concentrations (between 10–3 and 10–5 M, corresponding to approximately 0.1–10 monolayers). Surprisingly, the relative intensities of the marker bands changed dramatically over the series. At high total modifier concentrations, only PT bands could be observed in the spectra, and MPS bands only appeared as the total concentration of modifiers was reduced. A plot of the ratio of the heights of marker bands at 896 cm–1 (PT) and 802 cm–1 (MPS) against the total concentration of modifiers in the feedstock (Figure 1C, Inset) shows that above 1 × 10⁻⁴ M (corresponding to monolayer coverage) PT preferentially adsorbs, but below monolayer coverage the ratios of peak heights are similar.
Figure 1.
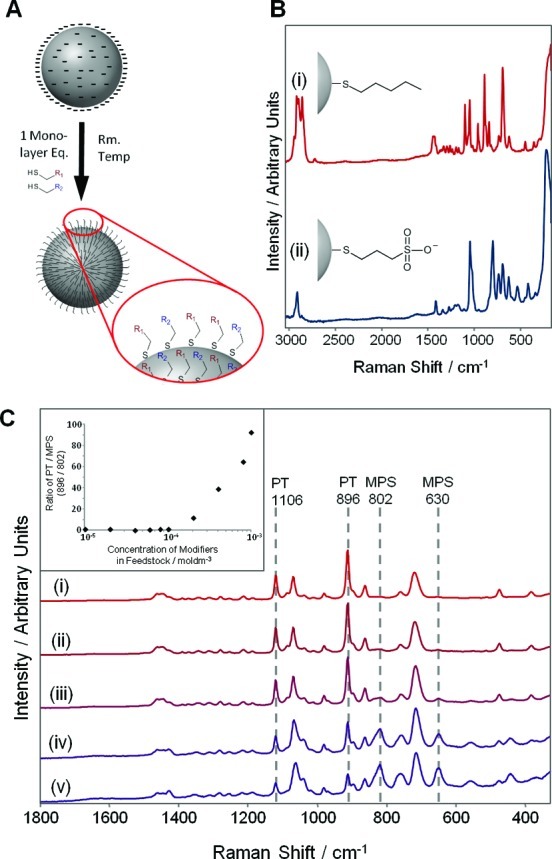
(A) Modification of a preprepared silver nanoparticle with a mixed thiol feedstock. (B) SERS spectra of (i) PT and (ii) MPS adsorbed on HRSC. (C) SERS spectra of 1:1 mixtures of MPS and PT added to HRSC at total modifier concentrations of (i) 1 × 10⁻³ M, (ii) 4 × 10⁻⁴ M, (iii) 2 × 10⁻⁴ M, (iv) 1 × 10⁻⁴ M, and (v) 6 × 10⁻⁵ M. Spectra have been scaled and vertically offset to emphasize the change in the relative intensities of MPS and PT bands. (Inset) Semilog plot of the ratios of the heights of PT (896 cm–1) and MPS (802 cm–1) bands against total modifier concentration.
We believe that this effect is a result of competition between MPS and PT for surface sites. At high concentrations the relative proportion of each modifier on the surface is determined by their relative binding affinities. However, at total modifier concentrations that are closer to those required for monolayer coverage, the equilibrium position resulting from the competitive adsorption will be perturbed because surface binding of the modifier with the highest affinity will deplete its concentration in the bulk phase, reducing its ability to compete for the remaining sites. This can be modeled using an approach similar to the kinetic derivation of the standard competitive Langmuir isotherm.39 In the standard model the rates of adsorption and desorption of a modifier, A, are equal at equilibrium:
| 1 |
where k1A and k2A are the rate constants for adsorption and desorption of A and θA and θB are the fractions of the surface covered by modifiers A and B. However, in this case we modify the adsorption term to account for the loss of modifier in the bulk phase due to adsorption onto the surface:
| 2 |
By expressing the concentration in monolayer units (i.e., relative to the number of molecules required to cover the surface of all the nanoparticles in the sample) so that N is the number of potential monolayers in the modifying solution, xA is the proportion of A in the modifying feedstock, and by combining rate constants it can be shown that
| 3 |
where K′ is a composite quantity determined by the adsorption and desorption rate constants for A and B (k1Ak2B/k2Ak1B). Figure 2 shows plots of θA against N for various values of K′ obtained by solving eq 3 numerically. At high concentrations, eq 3 reduces to the standard Langmuir model, because the term correcting for the adsorbed modifier becomes negligible, i.e., (xAN – θA) = xAN. Since (1 – xA)N ≫ 1 ≫ θA at high N,
| 4 |
and at 1:1 feedstock the relative surface coverage is directly proportional to the relative sizes of the equilibrium constants.
Figure 2.
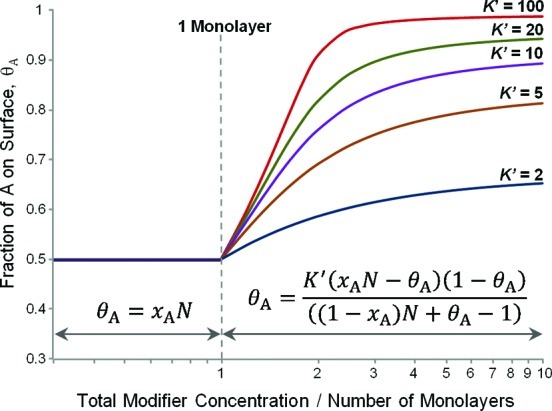
Predicted fractional surface coverage, θA, given by a 1:1 A:B feedstock with changing total modifier concentration. Simulations at different values of K′, the ratio of binding constants between the modifiers A and B, are shown. Above monolayer concentrations, the fractional coverage of A increases according to the value of K′; below monolayer concentrations, the fractional coverage of A will be 0.5 regardless of the value of K′.
At intermediate concentrations the proportions are less heavily weighted in favor of the modifier with the highest binding constant until at N = 1 the above model breaks down, since it assumes that θA + θB = 1, and this cannot be true for N < 1. At values of N < 1, there are not enough molecules in solution to form a complete monolayer, and the fraction of the surface covered in A, θA, will be limited by the amount of A present in the feedstock, i.e., xAN, (assuming k1A is large). Since there will still be free sites even if all of A has adsorbed to the surface, B is also free to adsorb without competition. Therefore, the ratio of A to B on the surface will be equal to their ratio in the modifying feedstock.
Figure 3 compares experimental data for 1:1 feedstocks of three different thiol mixtures over large concentration ranges. These mixtures were chosen because their relative K′ values were also expected to span a large range. Similarly, in order to demonstrate the generality of this approach, the measurements were made on three different colloids, HRSC (predominantly spherical, diameter ca. 62 nm), CRSC (mixed morphology spheres, rods, truncated prisms, etc.) and silver nanoprisms (edge length ca. 20–30 nm). Data from replicate experiments on spheres and nanoprisms showing the reproducibility of the measurements are given in the Supporting Information.
Figure 3.
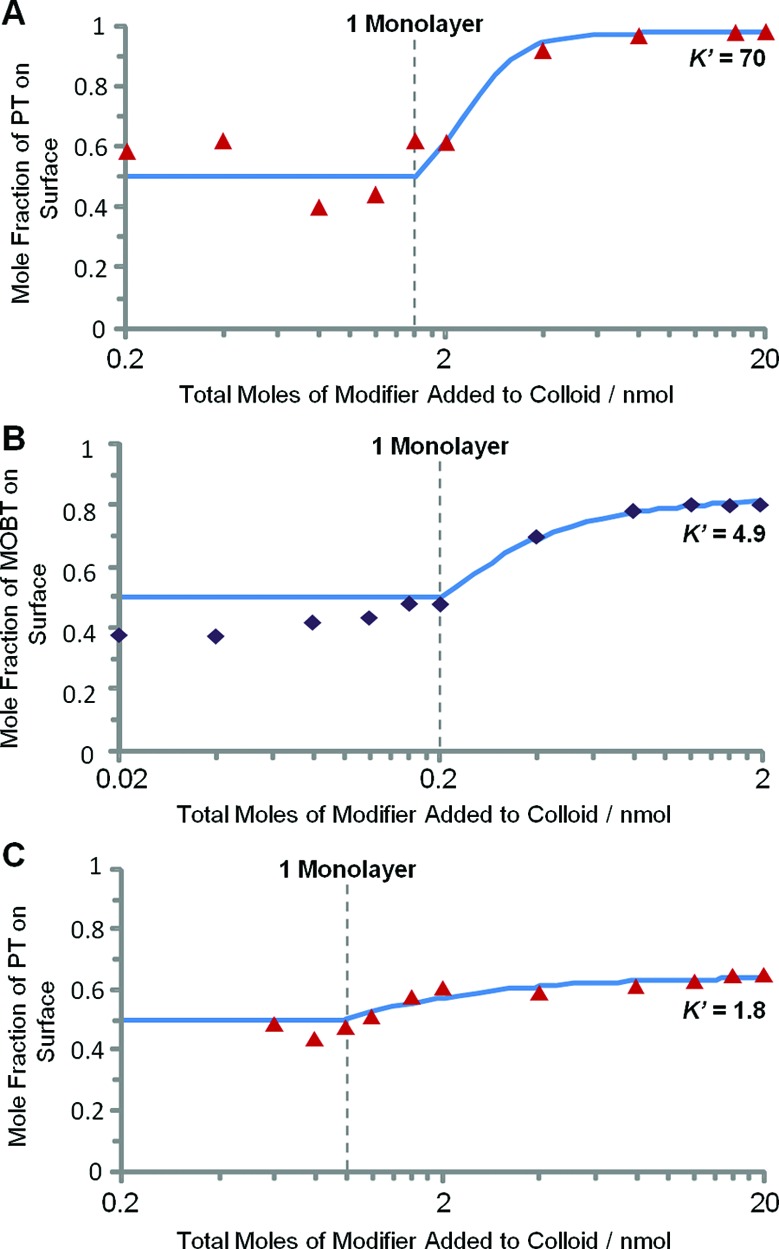
Plots showing how the surface mole fractions of various modifiers adsorbed from 1:1 binary modifier mixtures change with total amount of modifier. Solid lines are the fits to the competitive binding model discussed in the text. Plots show the fractions of (A) PT adsorbed from a PT:MPS feedstock on HRSC, (B) MOBT from a MOBT:TP feedstock on Ag nanoprisms, (C) PT from a PT:BZM feedstock on CRSC. 200 μL of silver colloid was used in each case.
The data for PT:MPS mixtures on HRSC show the trend that the model predicts, with approximately equal proportions of each modifier at submonolayer coverage and a dramatic rise in the proportion of the thermodynamically favored modifier at higher concentrations. These data fit to a model with a high K′ value of 70, reflecting the much more favorable binding of PT compared to MPS. In contrast, in the PT:BZM system the binding constants are much more similar to each other so that neither modifier dominates, even at higher concentration. The data on CRSC can be fitted to a low K′ value of 1.8, which reflects the fact that the fraction of PT on the surface does rise slightly above 0.5 at higher concentrations. The difference between 3A and 3C is not due to the change in the morphology of the colloid; supplementary Figure S3 shows that PT:BZM on HRSC behaves similarly to the same mixture on CRSC. The methoxybenzenethiol (MOBT):thiophenol (TP) system, shown on silver nanoprisms in Figure 3B, lies between these two extremes of K′. Although PT:BZM comes close, none of the systems we have studied have a K′ value of exactly 1, which is what is required to have the surface monolayer composition match that of the feedstock at all values of total concentration.
The main implication for these results is that the composition of mixed monolayers is not simply controlled by the molar ratio of the modifiers in the feedstock and the relative binding constants; the overall concentration is also critical. The larger the difference in binding constants, the larger the effect that the concentration will have. This means that, in principle, the surface could be tuned by altering the total concentration at a fixed feedstock composition ratio, since at higher concentrations the more strongly binding modifier will occupy more surface than the weakly bound one, even if the ratio in the feedstock is 1:1. However, this approach will result in samples where the nanoparticles sit within solutions containing large amounts of unbound thiol modifiers. It is preferable to work at modifier concentrations near monolayer coverage, since this will minimize the amount of residual unbound modifier. In addition, working at this concentration should also minimize preferential binding effects and thus allow mixed monolayers composed of thiols with very different binding constants to be prepared by altering the relative concentrations in the modifier feedstock.
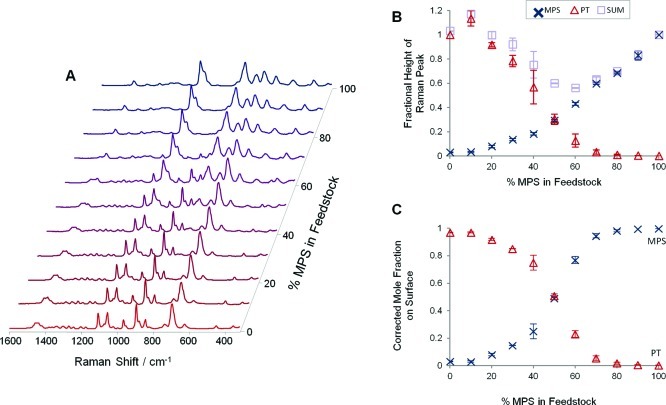
Here we have illustrated this effect using the PT:MPS system, which has very different binding constants (K′ = 70), and have carried out experiments where the total modifier concentration was fixed at 1 × 10⁻⁴ M (equivalent to ca. 1.25 monolayers with the volume of HRSC used). This ensured full monolayer coverage but still allowed the surface compositions to be varied by the experimental conditions, rather than be dominated the relative binding constants of the modifiers. For example, as shown in Figure 4, when the composition of the PT:MPS feedstock was varied in 10% increments from 0 to 100% (with a fixed total modifier concentration of 1 × 10⁻⁴ M), a smooth transition from the spectrum of PT to that of MPS was observed.
Figure 4.
(A) SERS spectra of HRSC modified using mixed MPS:PT feedstocks with different percentages of MPS, but where the total modifier concentration was kept constant at 1 × 10⁻⁴ M. Spectra are normalized to the highest peak for clarity. (B) Chart showing the fractional height of MPS (802 cm–1, ×) and PT (896 cm–1, Δ) along with the sum of these. (C) Plot of the mole fractions of MPS (×) and PT (Δ) obtained by correcting the fractional heights shown in (B). Error bars are ±1 s, calculated from 3 replicate experiments.
The heights of the MPS and PT peaks at 802 and 896 cm–1, respectively, could be used to track the surface composition of the monolayers. In principle, this should be simply a matter of calculating the mole fraction on the surface by determining the height of each peak as a fraction of its height when the colloid was completely covered in that component (Figure 4B). However, it was found that this gave apparent total mole fractions of MPS and PT that varied across the series, while the total should be 1.00 at all feedstock compositions. The most likely explanation for this change was that the extent of aggregation varied across the composition range. Nevertheless, irrespective of its origin, the variation could be corrected by finding the factor needed to give each sample a total mole fraction of 1 and then multiplying each height in that sample by this correction factor, as shown in Figure 4C.
It is striking that although the curves in Figure 4C cross at 50% MPS in feedstock, they do not directly follow the composition of the feedstock, which would give straight line plots. In fact the model does not predict straight line behavior for N > 1, since if N > 1, competition for surface sites moves the crossover in favor of the more strongly binding modifier. Of course, if the conditions are close to N = 1 or if both modifiers are similarly binding (i.e., K′ = 1), then there will be no competition and straight line behavior will be observed. For example, the plot for the PT:BZM system at close to monolayer concentration shown in Figure 5 is near linear. However, the main point is that this approach allows the nanoparticles to be functionalized with mixed monolayers whose composition can be controlled in a rational way by altering the feedstock composition, even if they have very different binding constants.
Figure 5.
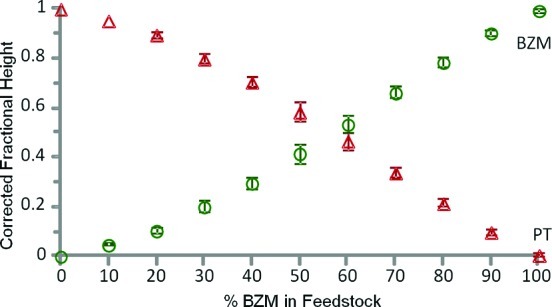
Corrected fractional coverages of modifiers in mixed monolayers of (a) BZM (○) and PT (Δ) on HRSC at total concentration 10–4 M, i.e., close to monolayer. Error bars are ±1 s calculated from 3 replicate experiments.
The reason for preparing mixed monolayers is to modulate the properties of the nanoparticles. In many cases this requires the surface to have a local composition that is mixed on an appropriate length scale, i.e., for any domains present to be smaller than the footprint of the probe technique. For example, in our work on using mixed modifiers to promote adoption of small molecule targets onto nanoparticles for SERS sensors, the binding requires the adsorbed molecules to interact simultaneously with different modifiers36 and particles covered with just one of the modifiers do not bind the targets. This means it is essential to understand not only the relative amounts of the modifier present on the surface but also how they are arranged on the surface, i.e., if they are in domains that are larger than the critical length scale. This general problem has previously been addressed using ESR,40 fluorescence,41 mass spectrometry,42 and chemical cross-linking approaches.43 Evidence for domain formation has been obtained, but it is not clear how system- dependent these effects are. Here we have used the simple PT and MPS thiol modifiers and a well-known cationic porphyrin complex test compound (zinc 5,10,15,20-tetrakis(1-methyl-4pyridyl)-21H,23H-porphine, tetra-p-tosylate salt (ZnTMPyP)). This probe is expected to be attracted to the anionic MPS but not the uncharged PT.
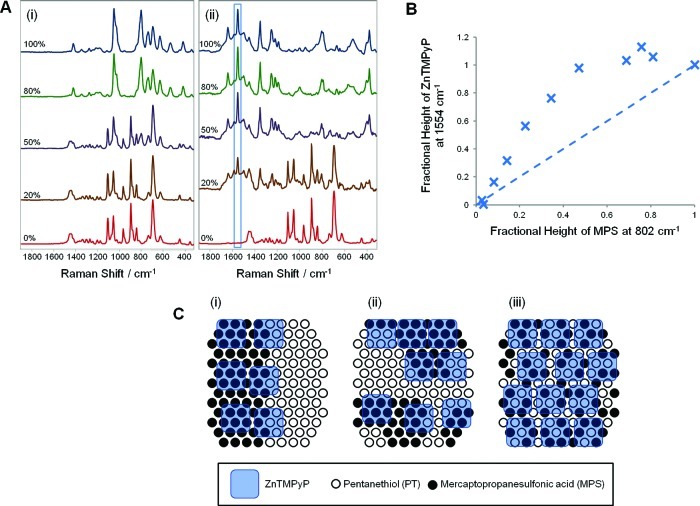
Figure 6A shows selected spectra of 1.5 × 10⁻⁶ M ZnTMPyP on nanoparticles functionalized with SAMs of MPS, PT, and mixtures of the two components. The absence of binding to the pure PT surface shows that electrostatic attraction to the modifier is required to promote adsorption, which will limit the positively charged porphyrin to adsorbing only to sections of the surface where it overlays at least one of the negatively charged MPS modifiers. This means that if the domains on the mixed surface were much larger than the probe molecule (similar to a Janus particle),44 then the fraction of the surface capable of attracting ZnTMPyP would be the fraction covered by MPS. In that case the ZnTMPyP SERS signal from a mixed monolayer would increase linearly with the fractional coverage of MPS. Thus, as shown in Figure 6C(i), at 50:50 MPS:PT surface coverage the ZnTMPyP will cover only approximately 50% of the surface (and give half the maximum possible signal) since the PT-covered half will not allow ZnTMPyP binding. However, it is clear from the spectral data in Figure 6A that even a small amount of MPS on the nanoparticle surface promotes a disproportionate amount of binding of ZnTMPyP and that an MPS fractional coverage of 20–25% (uncorrected for total signal height) gives a 50% signal from ZnTMPyP. More strikingly, the signal at 50:50 coverage is already at the maximum value, implying full surface coverage by the porphyrin probe. This is consistent with a model where the proportion of potential binding sites meeting the criterion for probe adsorption increases as the domain size decreases, as shown in Figure 6C(iii). In this case it is clear that the domains are sufficiently small that even at 50:50 coverage an incoming porphyrin molecule on any part of the surface will find at least one negatively charged modifier and adsorb; that is, the domains are <2 nm. This is similar to the morphology of SAMs on Au(111) substrates recently reported by Bukowska,19 Au nanoparticles reported by Stellacci, where one modifier forms microdomains in a “percolated matrix” of the other,21 and Au nanoparticles modified with thiols carrying cationic head groups.41
Figure 6.
(A) SERS spectra of HRSC modified using mixed MPS:PT feedstocks with different percentages of MPS (total modifier concentration was kept constant at 1 × 10⁻⁴ M): (i) blank spectra obtained from the modified colloids only; (ii) the same colloids after addition of 1.5 × 10⁻⁶ M ZnTMPyP. (B) Variation in the intensity of the strong ZnTMPyP marker band at 1554 cm–1 (relative to saturation value) with respect to fraction of MPS in the modifying layer. The straight line expected for a simple 1:1 relationship has been included for emphasis. (C) Cartoon representation showing how different modifier domain sizes would affect the amount of ZnTMPyP probe adsorbed on a surface with equal amounts of MPS and PT modifier. In (i) the domains are much larger than the probe molecule, while in (ii) the domains are an intermediate size, and in (iii) the domains are small clusters of molecules. In this example, since the probe does not adsorb to PT, a significant fraction of the surface will not allow probe adsorption if the microstructure is type (i), while type (iii) has underlying MPS at all potential binding sites.
Conclusions
It has been shown that silver nanoparticles of various shapes and sizes can easily be modified with mixed SAMs by adding the correct concentration of modifiers directly to a simple aqueous suspension of the nanoparticles. The composition of the surfaces can be modeled using a competitive adsorption approach that explicitly includes the effect of depletion of the bulk modifier at low feedstock concentrations. The composition of the mixed SAMs and therefore the properties of the modified nanoparticles can be tuned by varying the proportions of each modifier in the feedstock while maintaining the overall modifier concentration at an appropriate level. The surfaces can also be probed by adding model analytes, yielding more information on their composition and behavior.
It is believed that the processes developed for studying mixed SAMs of PT and MPS can be applied to many other binary mixtures of thiols, which is a necessary step in the development of metal nanoparticles for increasingly complex purposes.
Methods
Silver nitrate (99.9999%), hydroxylamine hydrochloride, sodium chloride, sodium mercaptopropanesulfonate, 1-pentanethiol, benzyl mercaptan, methoxybenzenethiol, thiophenol, and zinc[5,10,15,20-tetrakis(1-methyl-4-pyridyl)-21H,23H-porhine] tetra-p-tosylate were purchased from Sigma-Aldrich. Sodium hydroxide was purchased from Riedel-de Haën, and all chemicals were used as received without further purification. All solutions were prepared from distilled, deionized (DDI) water (resistivity = 18.2 MΩ), obtained from a Branstead Nanopure system, or from absolute ethanol obtained from T. E. Laboratories Ltd.
Hydroxylamine-reduced silver colloid was synthesized following the method published by Leopold and Lendl.33 A 5 mL amount of NaOH (0.1 M) was added to 5 mL of aqueous hydroxylamine hydrochloride (6 mM); then the whole mixture was added to 90 mL of aqueous AgNO3 (0.1 mM) with stirring. The colloid formed spontaneously and was left stirring for ∼20 min before use. The Cl– stabilizing ions were characterized by the Ag–Cl stretch at 240 cm–1 in the SERS spectrum. These mostly spherical nanoparticles were analyzed by the dynamic light scattering technique using a Malvern Zetasizer Nano ZS and found to have an average diameter of 62 nm. The total surface area of the colloid in a given volume was calculated by assuming that all the silver salt was converted to colloidal silver and that all nanoparticles were spherical with a diameter of 62 nm. This allowed the amount of modifier required for monolayer coverage to be approximated by dividing the total surface area by the area taken up by one molecule, which was calculated as 20.2 Å2 by Giz et al.45 The values obtained were found to agree well with isotherm experiments.
Citrate-reduced silver colloid was synthesized according to Lee and Meisel’s method.34 AgNO3 (45 mg) was dissolved in 250 mL and heated under reflux until boiling. When the boiling temperature was reached, 5 mL of 1% sodium citrate solution was added dropwise with stirring. The mixture was allowed to reflux for 90 min and was allowed to cool to room temperature. These nanoparticles are well-known to have a mixture of sizes and shapes, including rods, spheres, and prisms,46,47 so the surface area of these was determined by direct measurement of the isotherm.
Silver nanoprisms were synthesized using a modified version of the method published by Aherne et al.35 Seeds were produced by combining aqueous sodium citrate (5 mL; 2.5 mM), polysodium styrenesulfonate (0.25 mL; 500 mg L–1), and sodium borohydride (0.3 mL, 10 mM), then adding silver nitrate (0.5 mM) at a rate of 0.57 mL per minute. A 90 μL portion of this seed solution was dispersed in 5 mL of DDI H2O and mixed with ascorbic acid (75 μL; 10 mM). Then 3 mL of silver nitrate (0.5 mM) was added at a rate of 0.57 mL per minute. Sodium citrate solution (0.5 mL; 25 mM) was added to stabilize the particles, which were then cleaned by centrifuging at 3500 rpm for 1 h, removing the supernatant, and resuspending in the same volume of DDI H2O. The purple solution of nanoprisms was characterized by UV–vis spectroscopy using an Agilent 8453 spectrometer and were found to have a λmax of 553 nm, which was expected to correspond to an edge length of approximately 20–30 nm.35
Stock solutions of each modifier were prepared by dissolving MPS in distilled, deionized water and dissolving PT and BZM in absolute ethanol. Mixed feedstocks were made by combining the appropriate volumes of each stock solution. Mixed SAMs were prepared in situ by adding the premixed modifying feedstocks directly to silver colloid and stirring vigorously for approximately 5 s.
Samples for SERS analysis were prepared by adding 20 μL of modifying feedstock to 200 μL of colloid and aggregating with 20 μL of 1 M NaCl (for HRSC and CRSC) or 20 μL of 0.1 M MgSO4 (for Ag nanoprisms). When required, 20 μL of aqueous ZnTMPyP was added before the aggregation stage. Raman spectra were acquired using an Avalon R2 Ramanstation, equipped with a 785 nm diode laser delivering 100 mW at the sample. Backscattering at 180° was collected using an Echelle spectrograph and Avalon electrically cooled CCD. Integration times were 3 × 10 s for all spectra.
In some experiments (shown in Figures 4 and 5), it was necessary to correct the raw data to allow for system-wide changes in intensity. The raw data were treated by normalizing across the range to show the height of each peak as a fraction of its height when the colloid was completely covered in that component. At the feedstock concentrations used, the only two components on the surface would be the thiol modifiers, so the sum of the fractional heights should equal 1. However, the sum of the heights varied between ∼0.5 and 1.1, so it became necessary to apply a correction factor to the data, which was calculated by dividing unity by the sum of the fractional heights of the modifiers. The fractional heights were multiplied by the correction factors to give the mole fractions of each component on the surface, which are plotted in Figures 4C and 5.
Acknowledgments
The authors thank the Engineering and Physical Sciences Research Council for partially funding this research.
Supporting Information Available
Mixed isotherms of PT:BZM on HRSC, UV–vis spectra of MPS:PT-modified HRSC, SERS spectra of modifiers. This information is available free of charge via the Internet at http://pubs.acs.org.
The authors declare no competing financial interest.
Supplementary Material
References
- Burda C.; Chen X. B.; Narayanan R.; El-Sayed M. A. Chemistry and Properties of Nanocrystals of Different Shapes. Chem. Rev. 2005, 105, 1025–1102. [DOI] [PubMed] [Google Scholar]
- Daniel M. C.; Astruc D. Gold Nanoparticles: Assembly, Supramolecular Chemistry, Quantum-Size-Related Properties, and Applications toward Biology, Catalysis, and Nanotechnology. Chem. Rev. 2004, 104, 293–346. [DOI] [PubMed] [Google Scholar]
- Verma A.; Rotello V. M. Surface Recognition of Biomacromolecules Using Nanoparticle Receptors. Chem. Commun. 2005, 303–312. [DOI] [PubMed] [Google Scholar]
- Wang G. F.; Park H. Y.; Lipert R. J. Mixed Monolayers on Gold Nanoparticle Labels for Multiplexed Surface-Enhanced Raman Scattering Based Immunoassays. Anal. Chem. 2009, 81, 9643–9650. [DOI] [PubMed] [Google Scholar]
- Aherne D.; Ledwith D. M.; Gara M.; Kelly J. M. Optical Properties and Growth Aspects of Silver Nanoprisms Produced by a Highly Reproducible and Rapid Synthesis at Room Temperature. Adv. Funct. Mater. 2008, 18, 2005–2016. [Google Scholar]
- Yang Y.; Matsubara S.; Xiong L. M.; Hayakawa T.; Nogami M. Solvothermal Synthesis of Multiple Shapes of Silver Nanoparticles and Their SERS Properties. J. Phys. Chem. C 2007, 111, 9095–9104. [Google Scholar]
- Nikoobakht B.; El-Sayed M. A. Surface-Enhanced Raman Scattering Studies on Aggregated Gold Nanorods. J. Phys. Chem. A 2003, 107, 3372–3378. [Google Scholar]
- McLellan J. M.; Siekkinen A.; Chen J. Y.; Xia Y. N. Comparison of the Surface-Enhanced Raman Scattering on Sharp and Truncated Silver Nanocubes. Chem. Phys. Lett. 2006, 427, 122–126. [Google Scholar]
- Rodriguez-Lorenzo L.; Alvarez-Puebla R. A.; Pastoriza-Santos I.; Mazzucco S.; Stephan O.; Kociak M.; Liz-Marzan L. M.; de Abajo F. J. G.. Zeptomol Detection through Controlled Ultrasensitive Surface-Enhanced Raman Scattering. J. Am. Chem. Soc. 2009, 6, 4616-+. [DOI] [PubMed] [Google Scholar]
- Esenturk E. N.; Walker A. R. H. Surface-Enhanced Raman Scattering Spectroscopy Via Gold Nanostars. J. Raman. Spectrosc. 2009, 40, 86–91. [Google Scholar]
- Yu K. F.; Kelly K. L.; Sakai N.; Tatsuma T. Morphologies and Surface Plasmon Resonance Properties of Monodisperse Bumpy Gold Nanoparticles. Langmuir 2008, 24, 5849–5854. [DOI] [PubMed] [Google Scholar]
- Schwartzberg A. M.; Oshiro T. Y.; Zhang J. Z.; Huser T.; Talley C. E. Improving Nanoprobes Using Surface-Enhanced Raman Scattering from 30-nm Hollow Gold Particles. Anal. Chem. 2006, 78, 4732–4736. [DOI] [PubMed] [Google Scholar]
- Gessner R.; Rosch P.; Kiefer W.; Popp J. Raman Spectroscopy Investigation of Biological Materials by Use of Etched and Silver Coated Glass Fiber Tips. Biopolymers 2002, 67, 327–330. [DOI] [PubMed] [Google Scholar]
- Schreiber F. Structure and Growth of Self-Assembling Monolayers. Prog. Surf. Sci. 2000, 65, 151–256. [Google Scholar]
- Templeton A. C.; Hostetler M. J.; Kraft C. T.; Murray R. W. Reactivity of Monolayer-Protected Gold Cluster Molecules: Steric Effects. J. Am. Chem. Soc. 1998, 120, 1906–1911. [Google Scholar]
- Imabayashi S.; Gon N.; Sasaki T.; Hobara D.; Kakiuchi T. Effect of Nanometer-Scale Phase Separation on Wetting of Binary Self-Assembled Thiol Monolayers on Au(111). Langmuir 1998, 14, 2348–2351. [Google Scholar]
- Gooding J. J.; Mearns F.; Yang W. R.; Liu J. Q. Self-Assembled Monolayers into the 21(St) Century: Recent Advances and Applications. Electroanalysis 2003, 15, 81–96. [Google Scholar]
- Wink T.; van Zuilen S. J.; Bult A.; van Bennekom W. P. Self-Assembled Monolayers for Biosensors. Analyst 1997, 122, R43–R50. [DOI] [PubMed] [Google Scholar]
- Donten M. L.; Krolikowska A.; Bukowska J. Structure and Composition of Binary Monolayers Self-Assembled from Sodium 2-Mercaptoetanosulfonate and Mercaptoundecanol Mixed Solutions on Silver and Gold Supports. Phys. Chem. Chem. Phys. 2009, 11, 3390–3400. [DOI] [PubMed] [Google Scholar]
- Brust M.; Walker M.; Bethell D.; Schiffrin D. J.; Whyman R. Synthesis of Thiol-Derivatized Gold Nanoparticles in a 2-Phase Liquid-Liquid System. J. Chem. Soc., Chem. Commun. 1994, 801–802. [Google Scholar]
- Jackson A. M.; Myerson J. W.; Stellacci F. Spontaneous Assembly of Subnanometre-Ordered Domains in the Ligand Shell of Monolayer-Protected Nanoparticles. Nat. Mater. 2004, 3, 330–336. [DOI] [PubMed] [Google Scholar]
- Jackson A. M.; Hu Y.; Silva P. J.; Stellacci F. From Homoligand- to Mixed-Ligand-Monolayer-Protected Metal Nanoparticles: A Scanning Tunneling Microscopy Investigation. J. Am. Chem. Soc. 2006, 128, 11135–11149. [DOI] [PubMed] [Google Scholar]
- Uzun O.; Hu Y.; Verma A.; Chen S.; Centrone A.; Stellacci F. Water-Soluble Amphiphilic Gold Nanoparticles with Structured Ligand Shells. Chem. Commun. 2008, 196–198. [DOI] [PubMed] [Google Scholar]
- Carney R. P.; De Vries G. A.; Dubois C.; Kim H.; Kim J. Y.; Singh C.; Ghorai P. K.; Tracy J. B.; Stiles R. L.; Murray R. W.; et al. Size Limitations for the Formation of Ordered Striped Nanoparticles. J. Am. Chem. Soc. 2008, 130, 798–799. [DOI] [PubMed] [Google Scholar]
- Hostetler M. J.; Green S. J.; Stokes J. J.; Murray R. W. Monolayers in Three Dimensions: Synthesis and Electrochemistry of Omega-Functionalized Alkanethiolate-Stabilized Gold Cluster Compounds. J. Am. Chem. Soc. 1996, 118, 4212–4213. [Google Scholar]
- Ingram R. S.; Hostetler M. J.; Murray R. W. Poly-Hetero-Omega-Functionalized Alkanethiolate-Stabilized Gold Cluster Compounds. J. Am. Chem. Soc. 1997, 119, 9175–9178. [Google Scholar]
- Tarnawski R.; Ulbricht M. Amphiphilic Gold Nanoparticles: Synthesis, Characterization and Adsorption to Pegylated Polymer Surfaces. Colloid. Surf. A 2011, 374, 13–21. [Google Scholar]
- Gentilini C.; Pasquato L. Morphology of Mixed-Monolayers Protecting Metal Nanoparticles. J. Mater. Chem. 2010, 20, 1403–1412. [Google Scholar]
- Drechsler U.; Erdogan B.; Rotello V. M. Nanoparticles: Scaffolds for Molecular Recognition. Chem.—Eur. J. 2004, 10, 5570–5579. [DOI] [PubMed] [Google Scholar]
- Maus L.; Spatz J. P.; Fiammengo R. Quantification and Reactivity of Functional Groups in the Ligand Shell of Pegylated Gold Nanoparticles Via a Fluorescence-Based Assay. Langmuir 2009, 25, 7910–7917. [DOI] [PubMed] [Google Scholar]
- Kalsin A. M.; Kowalczyk B.; Wesson P.; Paszewski M.; Grzybowski B. A.. Studying the Thermodynamics of Surface Reactions on Nanoparticles by Electrostatic Titrations. J. Am. Chem. Soc. 2007, 6, 6664-+. [DOI] [PubMed] [Google Scholar]
- Aliganga A. K. A.; Duwez A. S.; Mittler S. Binary Mixtures of Self-Assembled Monolayers of 1,8-Octanedithiol and 1-Octanethiol for a Controlled Growth of Gold Nanoparticles. Org. Electron. 2006, 7, 337–350. [Google Scholar]
- Leopold N.; Lendl B. A New Method for Fast Preparation of Highly Surface-Enhanced Raman Scattering (SERS) Active Silver Colloids at Room Temperature by Reduction of Silver Nitrate with Hydroxylamine Hydrochloride. J. Phys. Chem. B 2003, 107, 5723–5727. [Google Scholar]
- Lee P. C.; Meisel D. Adsorption and Surface-Enhanced Raman of Dyes on Silver and Gold Sols. J. Phys. Chem. 1982, 86, 3391–3395. [Google Scholar]
- Aherne D.; Ledwith D. M.; Gara M.; Kelly J. M. Optical Properties and Growth Aspects of Silver Nanoprisms Produced by a Highly Reproducible and Rapid Synthesis at Room Temperature. Adv. Funct. Mater. 2008, 18, 2005–2016. [Google Scholar]
- Stewart A.; Bell S. E. J. Modification of Ag Nanoparticles with Mixed Thiols for Improved SERS Detection of Poorly Adsorbing Target Molecules: Detection of Mdma. Chem. Commun. 2011, 47, 4523–4525. [DOI] [PubMed] [Google Scholar]
- Liu X.; Hu Y.; Stellacci F. Mixed-Ligand Nanoparticles as Supramolecular Receptors. Small 2011, 7, 1961–1966. [DOI] [PubMed] [Google Scholar]
- Wang Y.; Zeiri O.; Neyman A.; Stellacci F.; Weinstock I. A. Nucleation and Island Growth of Alkanethiolate Ligand Domains on Gold Nanoparticles. ACS Nano 2012, 6, 629–640. [DOI] [PubMed] [Google Scholar]
- Markham E. C.; Benton A. F. The Adsorption of Gas Mixtures by Silica. J. Am. Chem. Soc. 1931, 53, 497–506. [Google Scholar]
- Gentilini C.; Franchi P.; Mileo E.; Polizzi S.; Lucarini M.; Pasquato L. Formation of Patches on 3D SAMS Driven by Thiols with Immiscible Chains Observed by ESR Spectroscopy. Angew. Chem., Int. Ed. 2009, 48, 3060–3064. [DOI] [PubMed] [Google Scholar]
- Bonomi R.; Cazzolaro A.; Prins L. J. Assessment of the Morphology of Mixed SAMS on Au Nanoparticles Using a Fluorescent Probe. Chem. Commun. 2011, 47, 445–447. [DOI] [PubMed] [Google Scholar]
- Harkness K. M.; Balinski A.; McLean J. A.; Cliffel D. E. Nanoscale Phase Segregation of Mixed Thiolates on Gold Nanoparticles. Angew. Chem., Int. Ed. 2011, 50, 10554–10559. [DOI] [PMC free article] [PubMed] [Google Scholar]
- Duchesne L.; Wells G.; Fernig D. G.; Harris S. A.; Levy R. Supramolecular Domains in Mixed Peptide Self-Assembled Monolayers on Gold Nanoparticles. ChemBioChem 2008, 9, 2127–2134. [DOI] [PubMed] [Google Scholar]
- Yang S. M.; Kim S. H.; Lim J. M.; Yi G. R. Synthesis and Assembly of Structured Colloidal Particles. J. Mater. Chem. 2008, 18, 2177–2190. [Google Scholar]
- Giz M. J.; Duong B.; Tao N. J. In Situ Stm Study of Self-Assembled Mercaptopropionic Acid Monolayers for Electrochemical Detection of Dopamine. J. Electroanal. Chem. 1999, 465, 72–79. [Google Scholar]
- Canamares M. V.; Garcia-Ramos J. V.; Gomez-Varga J. D.; Domingo C.; Sanchez-Cortes S. Comparative Study of the Morphology, Aggregation, Adherence to Glass, and Surface-Enhanced Raman Scattering Activity of Silver Nanoparticles Prepared by Chemical Reduction of Ag+ Using Citrate and Hydroxylamine. Langmuir 2005, 21, 8546–8553. [DOI] [PubMed] [Google Scholar]
- Magdassi S.; Bassa A.; Vinetsky Y.; Kamyshny A. Silver Nanoparticles as Pigments for Water-Based Ink-Jet Inks. Chem. Mater. 2003, 15, 2208–2217. [Google Scholar]
Associated Data
This section collects any data citations, data availability statements, or supplementary materials included in this article.


