

Abstract
Poly(ether-ether-ketone) (PEEK) has been used as a load bearing orthopaedic implant material with clinical success. All of the orthopaedic applications contain stress concentrations (notches) in their design; however, little work has been done to examine the fatigue behavior of PEEK in the presence of a notch. This work examines both stress-life (SN) fatigue behavior and the fracture behavior of unfilled PEEK under tension tension loading in circumferentially grooved round bar specimens with different elastic stress concentration factors. It was found that the majority of the loading was elastic in nature, and that there was only a small portion on the lifetime where there was a detectable change in structural behavior prior to gross fracture. Fractographic analysis via SEM further elucidated the potential fracture micromechanisms. Additional analysis was conducted to estimate the percent of the lifetime spent in crack initiation vs propagation, and it was found that the specimens spent the majority of the time in the crack initiation phase.
Introduction
Poly(ether-ether-ketone) (PEEK), is a semicrystalline polymer that has an approximate crystallinity of 30-35% and a Tg of 143°C [1]. In addition to high strength, unfilled PEEK has several attractive properties: transparency to X-rays, no artifacts created in CT images, and excellent biocompatibility [1, 2]. Another reason that PEEK is of interest is that both carbon fiber reinforced (CFR) and hydroxyapatite (HA) filled and/or HA coated PEEK have been developed. This has the benefit that the mechanical properties of the material can be tailored by altering the composite formulation [1].
Since the 1990s unfilled PEEK has been used in both cervical and lumbar spinal cages in vertebral fusion surgeries with considerable clinical success [1]. Medtronic Sofamor Danek have launched the CD Horizon Legacy PEEK pedicle-based, posterior rod for use as a dynamic stabilization system for the spine [3]. An artificial disc fabricated entirely from unfilled PEEK (NUBAC intradiscal arthroplasty device for the lumbar spine by Pioneer Surgical Technology, Marquette, MI) is currently in an international multi–center prospective clinical trial with 225 of these devices implanted since December 2004 [4].
All of these unfilled PEEK devices have design stress concentrations and/or undergo multiaxial loading conditions. We have previously reported on the monotonic behavior of unfilled PEEK in the presence of stress concentrations (generically referred to as notches) [5]. However, since devices used in clinical situations will experience cyclic loading the fatigue behavior of PEEK in the presence of stress concentrations is of clinical interest. There have been some reports in the literature on the fatigue crack propagation behavior of PEEK [6-8], and also on the stress-life (S-N) behavior [9]. However, there has been little work on the S-N fatigue behavior of PEEK in the presence of a stress concentration [10]. In addition, no work to the author’s knowledge has attempted to estimate the contribution of crack initiation versus propagation to the cyclic lifetime, and none of the works were conducted in a physiologically relevant environment. The goal of this study was to determine the S-N behavior of PEEK in the presence of a stress concentration and to estimate the duration of initiation versus propagation in a physiologically relevant environment.
Materials and Methods
The PEEK material used in this study was OPTIMA LT1™ (Invibio, Inc., West Conshohocken, PA), which is a unfilled PEEK formulation. Three tensile specimen geometries were machined and tested. Two circumferentially U-shaped grooved specimen geometries, “Moderate” (OD=8mm, ID=6mm, notch radius=0.9mm, kt=2.1) and “Deep” (OD=8mm, ID=6mm, notch radius=0.45mm, kt=2.7) were tested to examine the effect of different elastic stress concentration factors (kt) on the tension-tension fatigue behavior of PEEK. A circumferentially razor grooved dog-bone (“Razor”, OD=8mm, ID=6mm, kt>10) was also tested, to examine the effect of an extreme stress concentration on the tension-tension fatigue behavior (Figure 1). Prior to mechanical testing, specimens were pre-conditioned in a 37°C phosphate-buffered saline (PBS) bath for 8 weeks to simulate physiological conditions.
Figure 1.
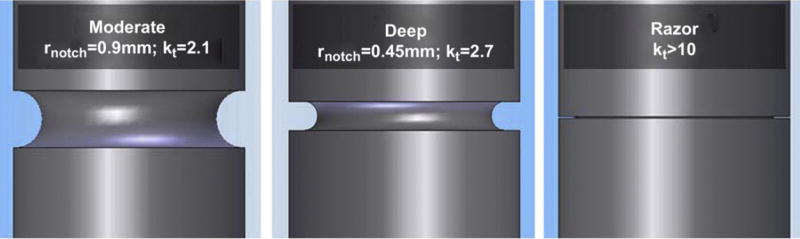
The specimen geometries used in the testing
All tests were conducted under tension-tension loading with a minimum tensile load of 30N at 2 Hz on an Instron 8411 servohydraulic frame (Instron Inc, Norwood, MA). The R-ratio (ratio of minimum load to maximum load) was ≤ 0.02. The tests were conducted in a 37°C PBS bath. Stress ranges were selected with the intention to capture lifetimes in the low-to-intermediate (1,000-100,000) cycle range.
Load and crosshead displacement were periodically recorded up to failure using LabView in addition to the cycles to failure. Also, to estimate the size of the plastic zone during cyclic loading, the Von Mises stress distributions based on the Neuber equations [11] were calculated.
Using the load and crosshead displacement data, a secant stiffness, k (GPa/m), was determined for each cycle:
| (1) |
Where Δσ is the cyclic engineering stress amplitude (based on the ID=6mm) and Δxcyclic is the corresponding cyclic displacement (Figure 2). The evolution of creep displacement Δxcreep and cyclic displacement were evaluated by used of creep displacement and cyclic displacement versus lifetime curves. The total displacements at failure, Δxtot,f, and the creep displacement at failure, Δxcreep,f, were also found (Figure 2). To check if the dependence on these two values on the stress amplitude the following ANOVA was conducted:
| (2) |
where Δxf is either Δxcreep,f or Δxtot,f.
Figure 2.
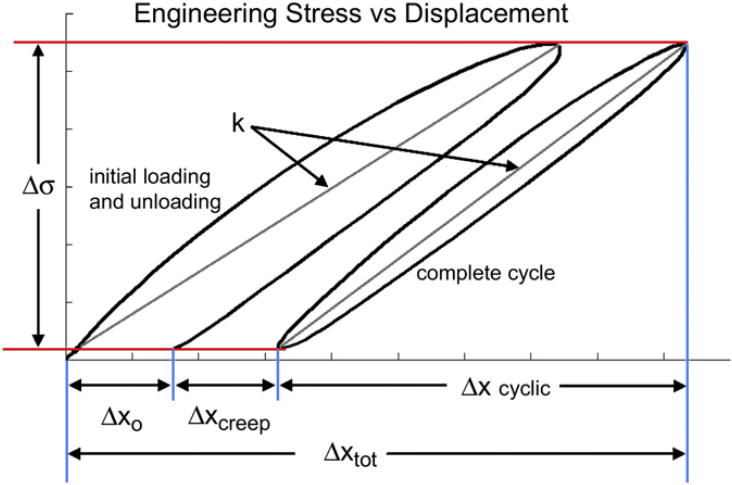
Diagram illustrating definitions for the cyclic stress amplitude (Δσ), displacements (Δxo, Δxcreep, Δxcyclic, Δxtot), and secant stiffness (k).
For the moderate geometry, 28 specimens were tested at seven stress levels; for the deep geometry, 27 specimens at six stress levels were tested; and, for the razor geometry, 25 specimens at five stress levels of the razor geometry were tested (n = 1-6 specimens per stress level). To compare the fatigue behavior of the geometries, the sets of fatigue data were fitted with the S-N Basquin relationship [12]:
| (3) |
where Δσ is the axial engineering stress amplitude, N is the lifetime, and d and A are constants.
The fitting was conducted using non-linear regression in MATLAB. Robust ANOVAs using S-Plus were conducted to test for significant differences in the values of d and A between the three geometries (α = 0.05) [13].
To estimate the time spent in propagation vs initiation, a linear elastic fracture mechanics (LEFM) approach as taken. According to Yates [14], the stress intensity, K, for a circumferentially grooved round bar is given by:
| (4) |
where a is the effective crack length, D is the outer diameter of the specimen, d is the inner diameter, l is the distance of the crack from the notch, and F is the stress intensity factor (Figure 3). The stress intensity factor, F, is given by multiplying the solution of Tada et al. [15] for the stress intensity factor of a crack in a round bar, FTada, by a correction factor, FYates that accounts for the notch, and the length of the crack relative to it :
| (5) |
Figure 3.
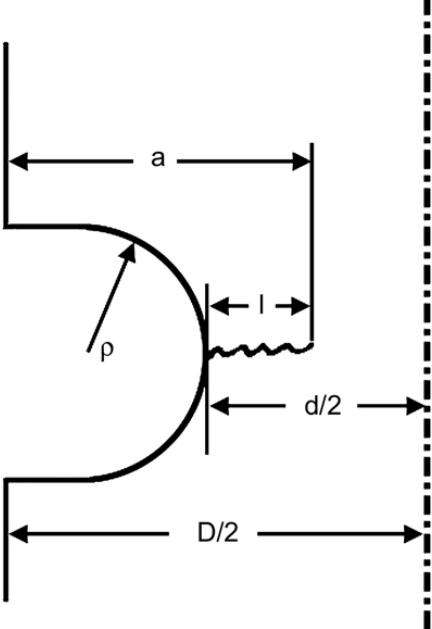
Diagram illustrating the definitions (a, l,D, d, ρ) for the linear elastic notch fracture mechanics approach.
The cyclic stress intensity factor can be related to the cyclic crack growth rate by the Paris relationship:
| (6) |
where C and m are material constants. Equation (6) was integrated numerically in MATLAB to determine the cycles necessary to propagate a crack from an initial effective length to a final effective length (ai to af).
| (7) |
The values of C and m were taken as 6×10⁻¹⁰ and 4.5, respectively, based on data from Tseng [7] (note that these values necessitate the units of measure of Δσ and a to be in MPa and m, respectively). Because C and m were taken from data in the literature and not determined directly for the PEEK material in this study, this analysis was conducted to provide an order of magnitude to the cyclic crack propagation lifetime, not an exact value.
The fracture surfaces were inspected using stereomicroscopy and a representative fracture surface from each geometry condition was examined in secondary electron mode at 5 kV in a Hitachi S-4500 SEM. Differences in the fracture micromechanism between notch conditions were qualitatively considered. Additionally, the values for ai and af were collected from five randomly selected fracture surface images and used to estimate the number of cycles for crack propagation.
Results
The number of cycles to failure were reduced both by an increase in cyclic stress level and also by an increase in severity of the notch (Figure 4). Neuber analysis of the Von Mises stress distributions for the moderate and deep notch geometry conditions showed that the majority of the specimen cross-sections fell into the elastic regime (Figure 5).
Figure 4.
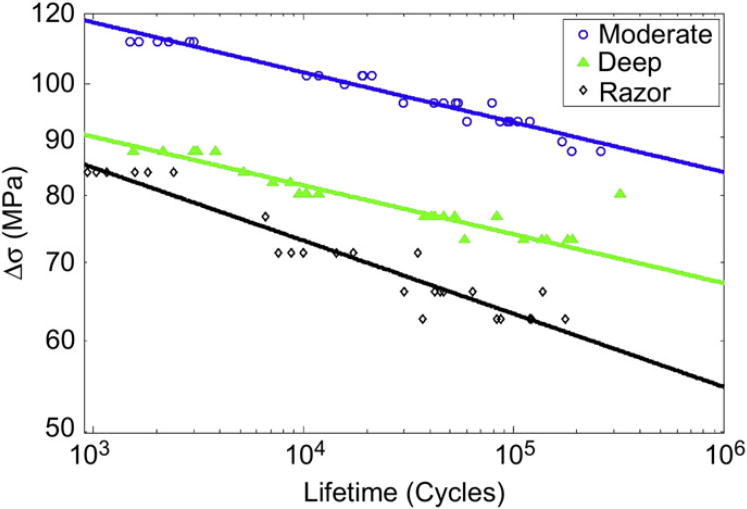
Experimental data and regression curves based on the Basquin relationship
Figure 5.
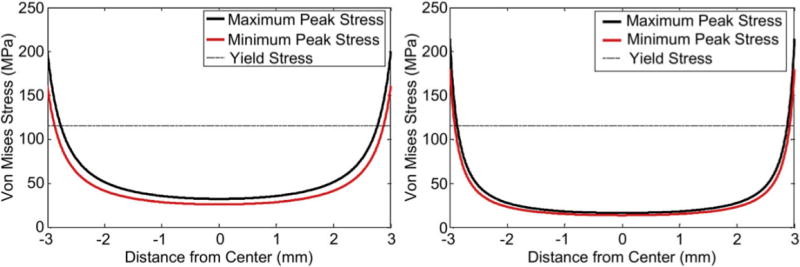
Von Mises stress distributions for the moderate at deep notched geometries at the highest and lowest applied peak stresses.
For all three geometries, the cyclic stress vs displacement curves showed little hysteresis (Figure 6), and appeared quite linear. Also, for all three geometries, there was an increase in the secant stiffness (k) of cycle 2 compared to cycle 1. For the moderate and deep geometries, the secant stiffness then remained approximately constant for the majority of the lifetime of a specimen, with a decline occurring in the final 200-300 cycles prior to failure (Figure 7). In contrast, for the razor notch geometry, secant stiffness declined continuously throughout the lifetime of a specimen, with an increase in the rate of the decline prior to failure.
Figure 6.
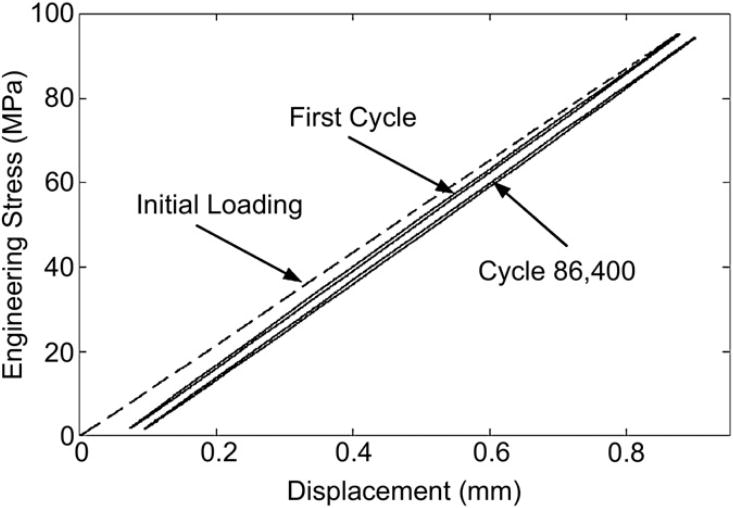
Stress vs displacement for a moderate notched specimen. Shown is the initial loading (dashed line), the first cycle, and one of the cycles near failure (86,408 cycles).
Figure 7.
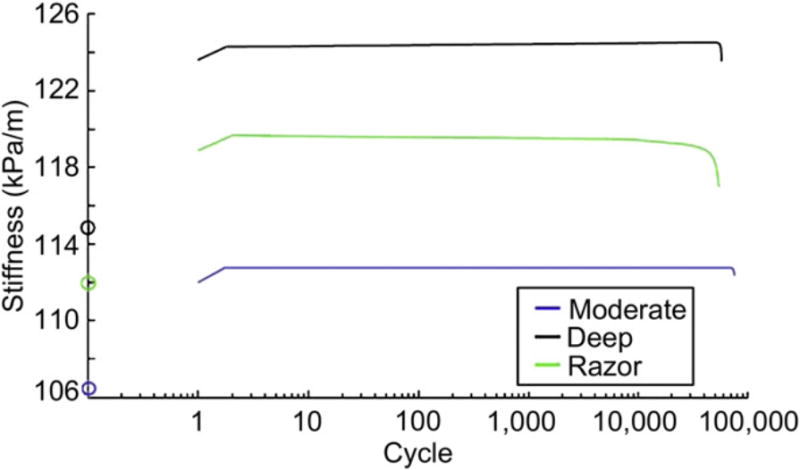
Secant stiffness vs cycle on a logarithmic x-scale. The circles indicate values for the initial loading cycle.
The creep displacement (Δxcreep) increased at an approximately constant rate throughout the duration of the test for all three geometries; however, the magnitude of the increase was small (Figure 8). For the moderate and deep geometries, the cyclic displacement of the first loading and unloading was larger than the subsequent cycles. Following the first cycle, the cyclic displacement remained constant throughout the majority of the lifetime with an increase in magnitude occurring in the final 200-300 cycles of a test prior to failure (Fig 9). For the razor notch geometry, there was a continuous increase in the cyclic displacement throughout the lifetime of a specimen, with a steeper increase prior to fracture. ANOVA revealed that creep displacement and total displacement (Δxcreep and Δxtot) prior to failure were stress level dependent (p<0.01 for both).
Figure 8.
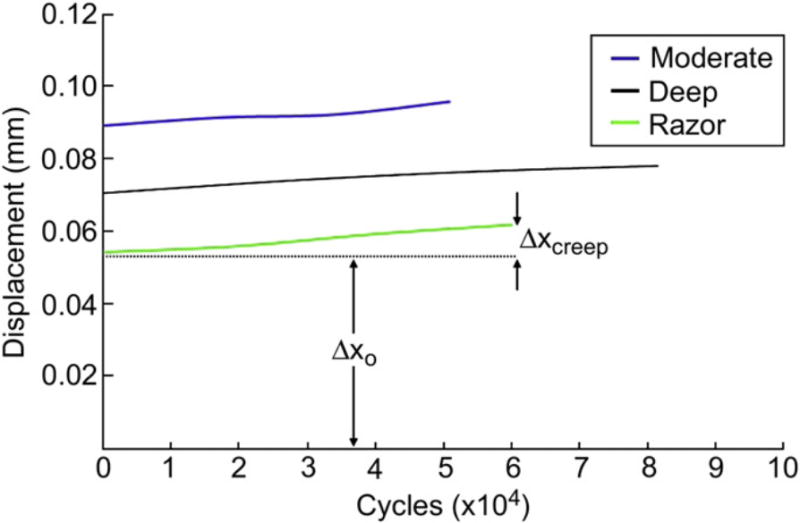
Initial displacement (Dxo) and creep displacement (Dxcreep) for representative specimens
Figure 9.
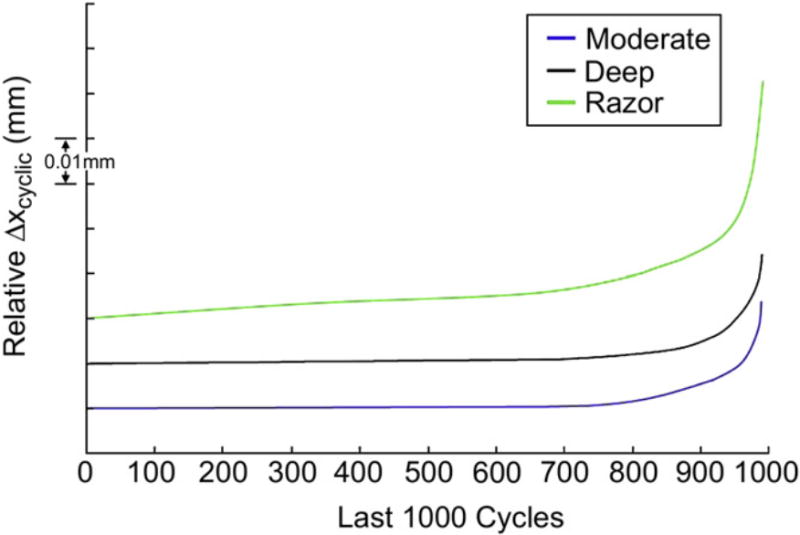
Cyclic displacement of last 1000 cycles.
The S-N curves determined using the Basquin relationship for each of the notch geometries also demonstrated that there was a loss of fatigue life with increase in notch severity (Figure 4). The results of the regression and the ANOVAs performed on the Basquin relationships for notch geometry condition showed that the Basquin relationship modeled the behavior well, with R2 > 0.90 for all notch geometries. The moderate and deep notch geometries had significantly different coefficients (A) but not significantly different exponents (d) (Table 1). The razor notched geometry had a significantly different A, and a significantly lower d than both the moderate and deep geometry conditions.
Table 1.
Results of the regression analyses utilizing the Basquin relationship.
| Moderate | Deep | Razor | |
|---|---|---|---|
| A (MPa) | 152 | 120 | 131 |
| d | -0.043 | -0.043 | -0.063 |
| R2 | 0.95 | 0.90 | 0.92 |
The LEFM analysis (equations 7-10) was performed on the moderate and deep notched specimens that were examined using the SEM. Examination of five randomly selected fracture surfaces via SEM suggested that there was an initiation region and also a point at which fast fracture occurred (Figures 10-11). Accordingly, the central point of the initiation ridge was taken as li and the point at the end of the propagation regime (onset of fast fracture) was taken as lf. It was estimated that the time spent in propagation was in the 300-2200 cycle range (Table 2).
Figure 10.
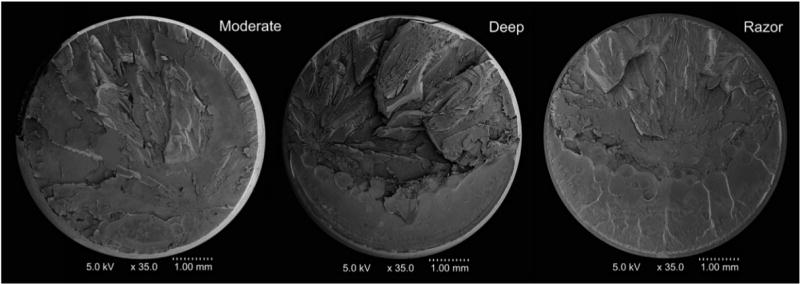
Representative fracture surfaces of PEEK fatigue specimens.
Figure 11.
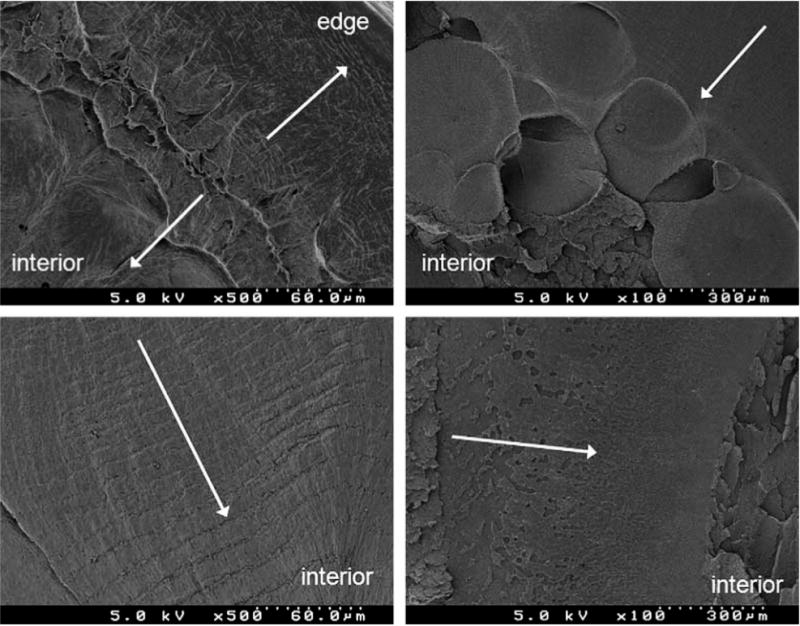
a) The initiation ridge. b) Parabolic markings. c) Fatigue striations. d) Patch morphology indicative of crazing. Arrows indicate direction of crack growth.
Table 2.
Results of the LEFM crack-life analysis.
| Δσ (MPa) | li (mm) | lf (mm) | Ntotal | Ninitiation | Npropagation |
|
||
|---|---|---|---|---|---|---|---|---|
| Moderate | 109.6 | 0.04 | 1.00 | 1,653 | 1,209 | 444 | 73.1% | |
| Moderate | 93.7 | 0.21 | 1.20 | 95,501 | 95,172 | 352 | 99.6% | |
| Deep | 84.9 | 0.15 | 1.57 | 5,194 | 4,383 | 754 | 85.5% | |
| Deep | 77.8 | 0.11 | 1.39 | 41,974 | 40,588 | 1,386 | 96.7% | |
| Deep | 74.2 | 0.07 | 1.34 | 180,264 | 178,061 | 2,203 | 98.8% |
Analysis of the fracture surface showed a similar fracture pattern for all the notch geometries (Figures 10 and 11). In all cases, there was a region of stable crack growth, presumably occurring during cyclic loading, followed by a region of fast fracture. For the five fracture surfaces that were examined, crack initiation appeared to begin 0.04-0.21mm internally from the notch (as estimated from the reconstructed fractographs). Crack growth then appeared to proceed both towards the notch and towards the interior of the specimen, as evidenced by the direction of parabolic markings around voids that nucleated ahead of the crack front. On the crack front advancing into the interior of a specimen, striation-like markings were also observed; these markings were consistent with fatigue striations in that they increased in width with an increase in distance from the notch. In the initial fast fracture region, occasional sites of crack growth through crazes were found and in the later fast fracture region, river-markings were observed.
Discussion
It has been shown that PEEK is a notch weakening material [5]; therefore, it was an expected finding that S-N life decreased with increase in notch severity. Comparison of the stress levels used in this experiment for the moderate and deep geometries to the monotonic stress-strain curve derived in [5] predicts that the stress state is grossly elastic (Figure 12). The predictions using the Neuber equations (Figure 4) show that both the moderate and the deep geometries are primarily exposed to an elastic stress state, and that the region exposed to plastic stresses in the moderate geometry is larger than that in the deep geometry. These findings support the use of the linear elastic fracture mechanics approach to estimate crack growth lifetime in PEEK (equations 4-7).
Figure 12.
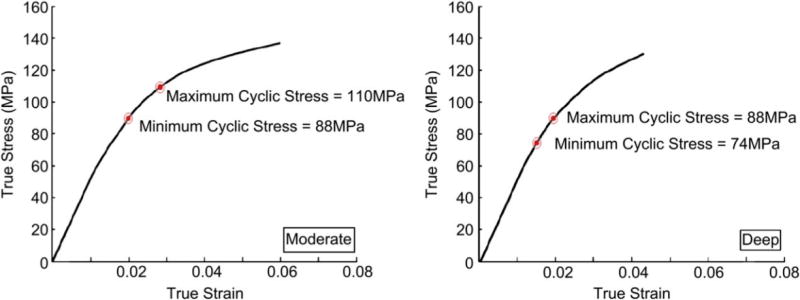
Figure showing where the highest and lowest peak applied stresses fall on monotonic loading curves derived for the notch geometries as found in [13].
The increase in secant stiffness during the first cycle in all three notch conditions suggests that there was some plastic deformation in the vicinity of the notch that resulted in localized strain hardening during the initial load cycle. For the moderate and deep geometries, in subsequent cycles, it appears that this new material configuration was loaded elastically, as evidenced by the very small hysteresis of the specimens, and by the steady-state behavior of the stiffness and the cyclic displacement for the majority of the cyclic lifetime. The reason for this dependence is not fully understood at this time and warrants further study.
The Basquin relationship (equation 3) captured the total (initiation plus propagation) S-N behavior of the data well. The high R2 values (Table 1) suggest that this is an acceptable S-N approach for PEEK. The finding that the moderate and deep shaped notch geometries have statistically similar exponent (d) in the Basquin relationship is an expected result. For most materials, the reduction in fatigue lifetime between a notched and a smooth specimen is linearly related to the elastic stress concentration, resulting in parallel S-N behavior [12]. Since both geometries would be hypothesized to create a proportional reduction to a smooth specimen, their relationship should also be parallel. The non-parallel (different exponent, d) behavior of the razor notch geometry condition was also expected. The severe notch condition of the razor notched geometry would be expected to truncate the number of cycles for crack initiation. From the LEFM analysis, the majority of the cyclic life in the moderate and deep notch geometry tests appeared to be spent in crack initiation; thus, truncation of these cycles would be expected to alter the S-N behavior, particularly in the higher cycle regime. This would lead to the steeper behavior observed for the razor notched samples (Figure 4).
As just noted, the LEFM analysis results suggest that the crack propagation lifetime was a minor part of the total lifetime for the moderate and deep notch geometry conditions. This is supported by two other findings, the aforementioned steeper behavior of the razor notched specimens, and the observation that the secant stiffness and cyclic displacement only showed a change in behavior during the last 200-300 cycles in the moderate and deep geometries. Taken together, the LEFM analysis and these observations support the conclusion that the majority of the total cyclic lifetime was spent in initiation and not propagation in these tests.
The features on the fracture surface (Figures 10 and 11) are consistent with fracture surface features reported in other studies for unfilled PEEK. The parabolic markings have been reported by Rae et al. [16] on the fracture surfaces from compact tension fracture toughness tests and by Tseng [7] in fatigue crack propagation tests. These features are produced by the nucleation and growth of cavities ahead of the primary crack front [17]. The patch morphology observed was similar to that presented in [5] and likely formed in a similar manner through crazing of the material. The striation-like markings are likely to be fatigue striations. If they are fatigue striations, it would be expected that their spacing would correspond to the macroscopic fatigue crack growth rate, da/dN, in a 1:1 manner for crack growth per cycle, as this has been found to be the case in a number of other polymers [17].
The major limitation of this study is the lack of fatigue crack propagation data (e.g., the Paris relationship) for this particular formulation of PEEK at 37°C, in a fluid environment. Such information would help to further understand the relationship between crack initiation and crack propagation of PEEK from mild and severe notch risers. With this information, the LEFM analysis to estimate crack propagation lifetime could be performed with the specific Paris relationship parameters (C, m) to obtain more accurate results. Additionally, it would be possible to confirm whether the fatigue striations observed correspond to the macroscopic fatigue crack growth rate.
Conclusions
Using tests specimens with three different notch geometries, the intermediate cyclic life S-N behavior of PEEK in a physiologically relevant environment was characterized and an estimate of the lifetime spent in initiation versus propagation was also obtained. It was shown that, the more severe the notch, the greater the reduction in fatigue life at a given applied cyclic stress. In addition, the stress-displacement fatigue curves showed very little hysteresis indicating that cyclic deformation was predominately elastic in this lifetime range. Perhaps the most interesting finding in this study was that the majority of the lifetime of a specimen was spent in crack initiation, and that the ratio of Ninitiation/Ntotal appeared to increase as Ntotal increased. The clinical significance of these findings is that there is the potential for gross failure of PEEK implant devices without any substantial period of detectable difference in structural behavior. The results of this study support the necessity of considering design-related stress concentrations carefully when using PEEK for implant applications that will be undergoing cyclic loading. Additionally, these findings also support evaluation of the notch sensitivity of CFR PEEK given its consideration for use as a bearing surface in total hip replacements.
Acknowledgments
NIH AR 47192, AR 07505, T32 GM07250, Invibio, Inc, Case Western Reserve University Department of Orthopaedics Allen Fellowship
Footnotes
Publisher's Disclaimer: This is a PDF file of an unedited manuscript that has been accepted for publication. As a service to our customers we are providing this early version of the manuscript. The manuscript will undergo copyediting, typesetting, and review of the resulting proof before it is published in its final citable form. Please note that during the production process errors may be discovered which could affect the content, and all legal disclaimers that apply to the journal pertain.
References
- 1.Kurtz S, Devine J. PEEK biomaterials in trauma, orthopedic, and spinal Implants. Biomaterials. 2007;28:4845–69. doi: 10.1016/j.biomaterials.2007.07.013. [DOI] [PMC free article] [PubMed] [Google Scholar]
- 2.Williams DF, McNamara A, Turner RM. Potential of polyetheretherketone (PEEK) and carbon-fibre-reinforced PEEK in medical applications. J Mater Sci Lett. 1987;6:188–190. [Google Scholar]
- 3.Highsmith J, Tumialeán L, Rodts G., Jr Flexible rods and the case for dynamic stabilization. Neurosurg Focus. 2007;22:E11. doi: 10.3171/foc.2007.22.1.11. [DOI] [PubMed] [Google Scholar]
- 4.Coric D, Songer M, Yuan H, Pimenta L, Reyes–Sanchez A, Werner D, et al. Up to 2–year follow–up results of a novel PEEK–on–PEEK disc arthroplasty: a prospective worldwide multicenter clinical study. 9th Annual Symposium for the International Society for the Advance of Spine Surgery (SAS); 2009. [Google Scholar]
- 5.Sobieraj M, Kurtz S, Rimnac C. Notch sensitivity of PEEK in monotonic tension. Biomaterials. 2009;30:6485–94. doi: 10.1016/j.biomaterials.2009.08.020. [DOI] [PMC free article] [PubMed] [Google Scholar]
- 6.Brillhart M, Gregory B, Botsis J. Fatigue fracture behavior of PEEK: 1. effects of load level. Polymer. 1991;32:1605–11. [Google Scholar]
- 7.Tseng W. Relationship between processing, structure, fatigue crack growth, and J-integral fracture tougness of neat polyetheretherketone. Arlington: University of Texas at Arlington; 1986. [Google Scholar]
- 8.Brillhart M, Botsis J. Fatigue crack growth analysis in PEEK. Fatigue. 1994;16:134–40. [Google Scholar]
- 9.Tang S, Cheang P, AbuBakar M, Khor K, Lia K. Tension-tension fatigue behavior of hydroxyapatite reinforced polyetheretherketone composites. Int J Fatigue. 2004;26:49–57. [Google Scholar]
- 10.Nisitani H, Noguchi H, Kim Y. Evaluation of fatigue strength of plain and notched specimens of short carbon-fiber reinforced polyetheretherketone in comparison with polyetheretherketone. Eng Fract Mech. 1992;43:685–705. [Google Scholar]
- 11.Neuber H. Theory of notch stresses: principles for exact calculation of strength with reference to structural form and material. United States Atomic Energy Commission, Office of Technical Information; 1961. [Google Scholar]
- 12.Dowling NE. Mechanical behavior of materials: engineering methods for deformation, fracture, and fatigue. 2. Upper Saddle River, New Jersey: Prentice Hall; 1999. [Google Scholar]
- 13.Neter, Kutner, Nachtsheim, Wasserman . Applied linear statistical models. McGraw Hill; 1996. [Google Scholar]
- 14.Yates J. A simple approximation for the stress intensity factor of a crack at a notch. J Strain Anal Eng Des. 1991;26:9–13. [Google Scholar]
- 15.Tada H, Paris P, Irwin G. The stress analysis of cracks handbook. Paris Productions & (Del Research Corp.); 1985. [Google Scholar]
- 16.Rae P, Brown E, Orler E. The mechanical properties of poly(ether-ether-ketone) (PEEK) with emphasis on the large compressive strain response. Polymer. 2007;48:598–615. [Google Scholar]
- 17.Hertzberg R. Deformation and fracture mechanics of engineering materials. 4. New York: John Wiley & Sons; 1996. [Google Scholar]