Abstract
The geometric and electronic structures and reactivity of an S = 5/2 (HS) mononuclear non-heme (TMC)FeIII–OOH complex are studied by spectroscopies, calculations, and kinetics and compared with the results of previous studies of S = 1/2 (LS) FeIII–OOH complexes to understand parallels and differences in mechanisms of O–O bond homolysis and electrophilic H-atom abstraction reactions. The homolysis reaction of the HS [(TMC)FeIII–OOH]2+ complex is found to involve axial ligand coordination and a crossing to the LS surface for O–O bond homolysis. Both HS and LS FeIII–OOH complexes are found to perform direct H-atom abstraction reactions but with very different reaction coordinates. For the LS FeIII–OOH, the transition state is late in O–O and early in C–H coordinates. However, for the HS FeIII–OOH, the transition state is early in O–O and further along in the C–H coordinate. In addition, there is a significant amount of electron transfer from the substrate to the HS FeIII–OOH at transition state, but that does not occur in the LS transition state. Thus, in contrast to the behavior of LS FeIII–OOH, the H-atom abstraction reactivity of HS FeIII–OOH is found to be highly dependent on both the ionization potential and C–H bond strength of the substrate. LS FeIII–OOH is found to be more effective in H-atom abstraction for strong C–H bonds, while the higher reduction potential of HS FeIII–OOH allows it to be active in electrophilic reactions without the requirement of O–O bond cleavage. This is relevant to the Rieske dioxygenases, which are proposed to use a HS FeIII–OOH to catalyze cis-dihydroxylation of a wide range of aromatic compounds.
1. Introduction
Mononuclear non-heme iron enzymes catalyze a wide range of chemical reactions that are important in medical, pharmaceutical, and environmental applications.1–5 Within this broad class, bleomycin, extradiol dioxygenases, pterin-dependent hydroxylases, α-KG-dependent dioxygenases, and Rieske dioxygenases utilize FeII site to activate O2 for attack on substrates. Among these enzymes, FeIII–hydroperoxo species are observed and proposed to be key intermediates in the catalytic cycles of bleomycin and Rieske dioxygenases.6–11
Bleomycins are a family of glycopeptide antibiotics that exhibit high intrinsic anti-cancer cytotoxicity, which is due to their ability to effect single- and double-strand cleavage of DNA.12–16 DNA strand scission is initiated by the abstraction of the C-4′ hydrogen atom from the backbone deoxyribose sugar by an FeIII–hydroperoxo intermediate termed activated bleomycin (ABLM).17,18 From nuclear resonance vibrational spectroscopy (NRVS), ABLM is a low spin (LS) S = 1/2 FeIII species with an end-on hydroperoxo ligand.8 Recent real time kinetic studies using circular dichroism determined that DNA accelerates the decay of ABLM, supporting a mechanism that involves direct H-atom abstraction by ABLM.6 DFT calculations of the reaction of ABLM with DNA show that the direct H-atom abstraction by LS FeIII–OOH is thermodynamically and kinetically favored over other proposed reaction pathways (e.g., heterolytic O–O cleavage to form a P450 compound I like species).7,8
The Rieske dioxygenases catalyze stereo- and regio-specific electrophilic cis-dihydroxylation of aromatic compounds as the first step in the metabolism of aromatic compounds by bacteria.19 Crystal structures of two FeIII–(hydro)peroxo intermediates have been reported.9,11 A third one has been characterized by EPR and Mössbauer spectroscopy coupled with DFT calculations that favor a FeIII–hydroperoxo species.10 The open question is whether this HS FeIII–hydroperoxo intermediate performs cis-dihydroxylation directly or whether the O–O bond first cleaves to generate a high-valent HO•–FeIV=O or HO–FeV=O species that performs the cis-dihydroxylation.10,20–22
Recently, we trapped a HS S = 5/2 FeIII–hydroperoxo species [(TMC)FeIII–OOH]2+ (TMC = 1,4,8,11-tetramethyl-1,4,8,11-tetraazacyclotetradecane).23 The combination of resonance Raman, Fe K-edge XAS, and DFT calculations defined this to be a five-coordinate species with the hydroperoxo ligand syn to the methyl groups of the TMC ligand (see Figure 1).23 In the present study, we performed low-temperature Abs, magnetic circular dichroism (MCD), variable-temperature variable-field MCD (VTVH MCD), and resonance Raman profiling experiments to understand the electronic structure of this complex and to calibrate electronic structure calculations. Secondly, this HS [(TMC)FeIII–OOH]2+ species was found to undergo O–O bond homolysis, which however appears inconsistent with the results that O–O bond homolysis of a HS FeIII–OOH system has an extra ~10 kcal/mol barrier relative to LS FeIII–OOH systems which do undergo O–O bond homolysis.24 We therefore conducted temperature-dependent kinetic studies of O–O bond homolysis of the HS [(TMC)FeIII–OOH]2+ complex and obtained analogous data of a well-defined LS FeIII–hydroperoxo species,25,26 [(N4Py)FeIII–OOH]2+ (N4Py = N,N-bis(2-pyridylmethyl)-N-bis(2-pyridyl)methylamine) for quantitative comparison. These data were coupled with the experimentally calibrated DFT calculations to elucidate the O–O bond homolysis mechanism of the HS [(TMC)FeIII–OOH]2+ complex and its relation to that of the LS FeIII–OOH species. Finally, the HS [(TMC)FeIII-OOH]2+ species was shown to abstract H-atoms from substrates with weak C–H bonds, such as xanthene (75.5 kcal/mol) and 9,10-dihydroanthracene (77 kcal/mol).23 A quantitative comparison of the direct H-atom abstraction reactivities of the HS and LS FeIII–OOH species was therefore performed and correlated to the calibrated DFT calculations to elucidate their different reactivities in H-atom abstraction reactions and their dependence on the properties of substrates. These studies provide new insights into the electrophilic reactivities of LS and HS FeIII–OOH species relevant to bleomycin and Rieske dioxygenases.
Figure 1.
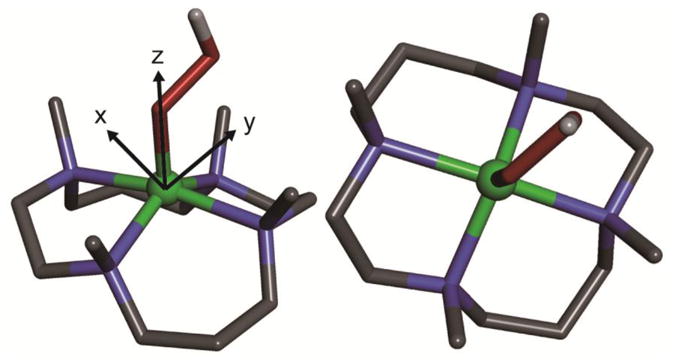
DFT optimized structure of the [(TMC)FeIII–OOH]2+ complex (left, side view; right, top view). Fe atom is in green, N atoms are in blue, C atoms are in black, O atoms are in red, H atom is in white. Only the H atom on the OOH ligand is shown, whereas other H atoms are omitted for clarity. The coordinate system is shown in the left panel, where z-axis is defined as along Fe–O bond, y-axis and x-axis are in and perpendicular to the Fe–O–O plane, respectively.
2. Materials and Methods
2.1 Synthesis of Materials
All chemicals were obtained from Aldrich Chemical Co. as the highest purity available and were used without further purification unless otherwise indicated. Solvents were dried and distilled under argon prior to use.27 TMC ligand was purchased from Aldrich Chemical Co. The deuterated substrate, xanthene-d2, was prepared by taking xanthene (0.16 g, 0.87 mmol) in DMSO-d6 (5 mL) along with NaH (0.1 g, 4.2 mmol) under an inert atmosphere.28 The reaction solution was stirred for 8h and was quenched with D2O (5 mL). The crude product was filtered and washed with copious amounts of H2O. 1H NMR confirmed >99% deuterated. The nonheme ferrous complexes, [FeII(TMC)(CH3CN)2)](CF3SO3)2 and [FeII(N4Py)(CH3CN)](ClO4)2, were prepared according to literature methods.24,29–32 The HS nonheme ferric complex, [(TMC)FeIII–OOH]2+, was prepared by following the literature method.21 The LS nonheme ferric complex, [(N4Py)FeIII–OOH]2+ (536 nm, ε = 1000 M−1 cm−1), was generated by adding H2O2 (25 mM) into a solution containing [FeII(N4Py)(CH3CN)](ClO4)2 (0.5 mM) in a solvent mixture of acetone and trifluoroethanol (3:1 v/v) at 288 K.24 The rate of natural decay was determined to be 5.4 × 10− 4 s−1. CAUTION: Perchlorate salts of metal complexes with organic ligands are potentially explosive and should be handled with care!
2.2. Kinetic Studies
All reactions were followed by monitoring UV-vis spectral changes of reaction solutions with a Hewlett Packard 8453 spectrophotometer equipped with a circulating bath or UNISOKU cryostat system (USP-203; UNISOKU, Japan). The temperature-dependent kinetic experiments for O-O bond homolysis were performed on HS [(TMC)FeIII–OOH]2+ (1 mM) and on LS [(N4Py)FeIII–OOH]2+ (0.5 mM) complexes by monitoring the decay of absorption bands at 526 nm and 536 nm, respectively, in a solvent mixture of acetone and trifluoroethanol (3:1 v/v) at the given temperatures. The temperatures were varying from 233 K to 308 K. The rates of H-atom abstraction reactions by HS and LS nonheme Fe(III)-hydroperoxo complexes, [(TMC)FeIII–OOH]2+ (1 mM) and [(N4Py)FeIII–OOH]2+ (0.5 mM), were examined with xanthene (5 ~ 40 mM), by monitoring spectral changes at 526 nm and 536 nm, respectively, in a solvent mixture of acetone and trifluoroethanol (3:1 v/v) at given temperatures. Pseudo-first-order fitting of the kinetic data allowed us to determine k2 values for the H-atom abstraction reactions of xanthene at given temperatures. Primary kinetic isotope effect values of the reaction between [(TMC)FeIII–OOH]2+ or [(N4Py)FeIII–OOH]2+ and xanthene were calculated by comparing k2 values obtained from H-atom abstraction reactions of xanthene and that of xanthene-d2 in a solvent mixture of acetone and trifluoroethanol (3:1 v/v). Reactions were run at least in triplicate, and the data reported represent the average of these reactions.
2.3. Spectroscopic Methods
X-band EPR spectra were collected on a Bruker EMX spectrometer with Bruker ER 041XG microwave bridges and ER 4102ST/ER 5106QT cavities. Spectra were collected at temperatures between 4 and 50 K using an Oxford ITC503 temperature controller with an SR 900 continuous flow cryostat. Low-temperature UV-vis Abs spectra were taken on a Cary 500 spectrometer equipped with a Janis Research Super Vari-temp helium cryogenic dewar at 7 K. MCD spectra were taken on a Jasco J-810D spectropolarimeter equipped with an extended S20 photomultiplier tube and a SM-4000-7T superconducting magnet. VTVH MCD data were collected using a calibrated Cernox resistor (Lakeshore Cryogenics, calibrated 1.5–300 K) inserted into the sample cell to accurately measure the sample temperature. Resonance Raman spectra were obtained using a triple monochromator (Spex 1877 CP) with 1200, 1800, and 2400 grooves/mm holographic spectrograph gratings and an Andor iDus and Newton CCD detectors cooled to −80 °C. Excitation was provided by Kr (Coherent I90C-K) ion, Ar (Innova Sabre 25/7) ion, and Dye (Coherent 599 equipped with Rhodamine 6G) lasers with incident powers of ~20 mW using an ~135° backscattering configuration. Samples were prepared in d6-acetone with 5 mM Fe concentration in NMR tubes cooled to 77 K in a liquid nitrogen finger dewar (Wilmad). 18O samples were used for resonance Raman profiling to avoid overlapping with solvent bands, and solvent peaks were used for internal standards.
2.4. Density Functional Calculations
Spin-unrestricted DFT calculations were performed with the Gaussian 09 package.33 Geometry optimizations including transition state searches were performed using the hybrid density functional B3LYP with the 6-311G* basis set for Fe and the 6-311G basis set for all other atoms. Frequency calculations were done at the same level of theory to ensure true local minima with no negative eigenvalues and that transition states had one and only one negative eigenvalue. Single point and Time-dependent DFT calculations were done at the B3LYP/6-311+G** level of theory. Solvation effects were accounted for using the polarized continuum model (PCM) with acetone as the solvent. Optimization of transition state in solvent yields similar energies and geometric/electronic structures. For the O–O bond homolysis and H-atom abstraction reaction calculations of the HS [(TMC)FeIII–OOH]2+ complex, acetonitrile was used as the axial ligand, since it is observed experimentally to bind to the [(TMC)FeIV=O]2+ product in acetonitrile solvent.23 Orbital components were analyzed with QMForge.34
3. Results and Analysis
3.1. Spectroscopic
3.1.1. EPR
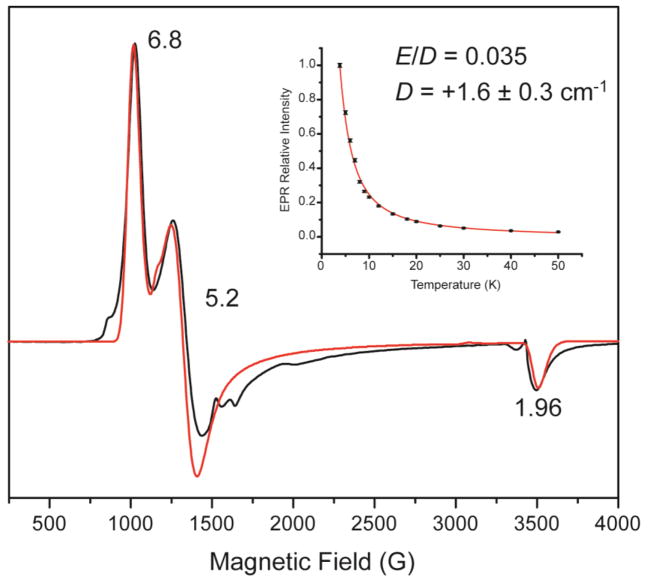
Our previous EPR study of the [(TMC)FeIII–OOH]2+ complex showed a signature S = 5/2 spectrum with effective g values of 6.8, 5.2, and 1.96 (reproduced in Figure 2) described by the spin Hamiltonian:
| (1) |
where β is the Bohr magneton, g0 is the free electronic g value, B⃗ is the magnetic flux density, S⃗ is the ground state total spin, and D and E are the axial and rhombic Zero-Field Splitting parameters.23 Simulation of the EPR spectrum gives a close to axial E/D value of 0.035, which is distinct from that of the rhombic HS FeIII–alkylperoxo complex, which was the first HS non-heme FeIII–OOR species that had been previously reported.24,35 In order to obtain the sign and magnitude of D, EPR data of the [(TMC)FeIII–OOH]2+ complex were collected between 3.8 K to 50 K under non-saturating conditions. The temperature-dependence of the relative intensity of the g = 6.8 signal is shown in the insert in Figure 2. A Boltzmann fit of the data to the Curie law (eqn. 2,
Figure 2.
3.8 K X-band (9.64 GHz) 2 mW EPR spectrum of the [(TMC)FeIII–OOH]2+ complex (black) and simulation (red).37 Insert is the Boltzmann fit (red curve) to the Curie law of the relative EPR intensities (black points) of the temperature-dependence of the g = 6.8 signal.
| (2) |
where A is the relative intensity, C is the Curie constant, T is the absolute temperature, and k is the Boltzmann constant) gives a value of D = +1.6 ± 0.3 cm−1. The E/D and D values are similar to the E/D of 0.097 and D of +2.5 cm−1 obtained from Mössbauer spectroscopy for the HS [(TMC)FeIII–OOH]2+ complex prepared in acetonitrile.36
3.1.2. Abs, MCD, VTVH MCD, and Resonance Raman Profiles
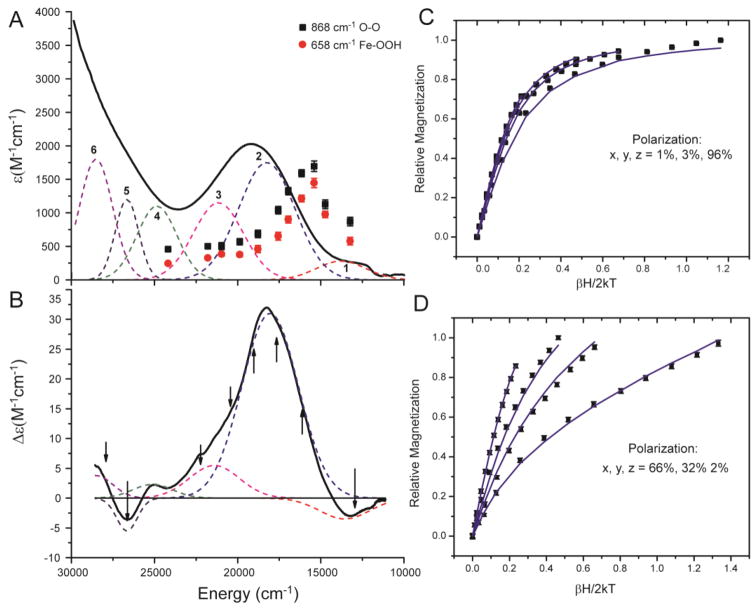
The low temperature UV-vis absorption spectrum of the [(TMC)FeIII–OOH]2+ complex is given in Figure 3A. A broad band at λmax of 19120 cm−1 (523 nm, ε ~ 2100 M−1cm−1) is observed. The absorption intensity increases to higher energy with no distinct feature. This spectrum is similar to that of the HS FeIII–alkylperoxo complex, which had a broad band at λmax of 17900 cm−1 (560 nm, ε = 2000 M−1cm−1).24 The [(TMC)FeIII–OOH]2+ complex has an additional weak band on the low energy tail of the broad band (at ~13000 cm−1, ε = 280 M−1cm−1). No equivalent low intensity band was observed in the HS FeIII–alkylperoxo complex. If an equivalent low energy band is present in the FeIII–alkylperoxo complex, it would have to be closer in energy to its intense broad band and thus not resolved.
Figure 3.
(A and B) UV-vis absorption (A, 10 K) and MCD (B, 5 K and 7 T) spectra of the [(TMC)FeIII–OOH]2+ complex with simultaneous best Gaussian fit (bands 1 – 6). Arrows in the MCD spectrum indicates energies where VTVH MCD data were collected. Resonance Raman profiles of ν(O–O) (868 cm−1, black rectangles) and ν(Fe–OOH) (658 cm−1, red circles). (C and D) VTVH MCD isotherms (black rectangles) and best fits to the data (blue lines). Data were collected at 1.8, 3.5, 5, and 10 K. VTVH MCD taken at 17794 cm−1 (C) and 22124 cm−1 (D).
The low temperature MCD spectrum of the [(TMC)FeIII–OOH]2+ complex is shown in Figure 3B. The main feature is the broad, intense band centered at ~18000 cm−1. There is also a positive shoulder at ~22000 cm−1. The weak ~13000 cm−1 feature in Abs is clearly resolved in the MCD spectrum as a negative band. Three other weak features are also resolved in the energy region above ~25000 cm−1. Simultaneous Gaussian fit of the Abs and MCD spectra resolves 6 bands, numbered in Figure 3A and summarized in Table 1.
Table 1.
Results of the Simultaneous Gaussian Fit of the UV-vis Absorption and MCD Spectra.
| Band | νmax (cm−1) | εmax (M−1 cm−1) | Δεmax (M−1 cm−1) | fosca | |Δε/ε| |
|---|---|---|---|---|---|
| 1 | 13563 | 280 | −3.5 | 0.0045 | 0.0125 |
| 2 | 18050 | 1750 | 31.0 | 0.0321 | 0.0177 |
| 3 | 21404 | 1150 | 5.5 | 0.0186 | 0.0048 |
| 4 | 25109 | 1100 | 2.3 | 0.0142 | 0.0021 |
| 5 | 26657 | 1200 | −5.5 | 0.00905 | 0.0046 |
| 6 | 28514 | 1800 | 3.8 | 0.0176 | 0.0021 |
Oscillator strength, fosc = 4.3 × 10⁻⁹ × area under the absorption band.
Variable-temperature variable-field (VTVH) MCD data were collected at the energies indicated by the arrows shown in Figure 3B to determine the polarizations of these bands. VTVH MCD isotherms are recorded across the 18000 cm−1 band (band 2) at 16000, 17795, 19085, and 20490 cm−1. The VTVH MCD isotherms collected at 17794 and 19084 cm−1 are equivalent and show nesting behavior (Figure 3C), while the VTVH isotherms collected at 16000 and 20492 cm−1 show contributions from overlap with bands 1 and 3, respectively. The isotherms recorded at 22124 cm−1 for band 3 (Figure 3D) show a much more nested behavior and indicate a different polarization. VTVH MCD data collected at 13000, 26455, and 28090 cm−1 were too noisy to analyze due to low intensity and overlap with the bands. VTVH MCD data were modeled using eqn. 3,38
| (3) |
where Ni is the temperature-dependent Boltzmann population, x, y, and z are the principle axes of the ZFS tensor; lx, ly, and lz are the direction cosines for the magnetic field relative to the molecular coordinate system, <Sx>i, <Sy>i, and <Sz>i are the spin expectation values for the ith ground sublevel in the defined coordinate, are the products of the i, j polarizations of electronic transitions, and γ is a collection of constants. A fit of the VTVH MCD intensity to equation 3 using the spin Hamiltonian parameters D and E/D obtained from the EPR data, insert in Figure 2, allows the effective transition moments to be obtained. These transition moments can then be used to obtain the polarization using equation 4; the %y and %z are obtained from cyclic permutations of the indices.38
| (4) |
From the analysis of the VTVH MCD data taken at 17790 cm−1, band 2 is dominantly z-polarized (96% z and 4% x,y-polarized), which is the same as the band 1 of the HS FeIII–alkylperoxo complex.24 From the analysis of VTVH MCD data taken at 22124 cm−1, band 3 is dominantly x,y-polarized (98% x,y and 2% z-polarized).
Figure 3A also contains the resonance Raman profiles for the ν(O–O) stretch at 868 cm−1and ν(Fe–O) stretch at 658 cm−1. These two modes are resonance enhanced by both bands 1 and 2 and have maximum enhancement between these two bands. Thus the excited states of these electronic transitions distort mostly along the Fe–O and O–O bonds relative to the ground state. Therefore, bands 1 and 2 correspond to hydroperoxo to iron charge transfer transitions. The HS FeIII–alkylperoxo complex has its resonance Raman profiles correspond only with the intense broad band, consistent with its lack of the lower energy band.24
Since band 2 is z-polarized and corresponds to the hydroperoxo to iron charge transfer, which is polarized along the Fe–O bond, the z axis of the ZFS tensor must be aligned with the Fe–OOH bond. This allows the coordinate system to be defined in Figure 1.
3.2. DFT Calculations: Correlation to Spectroscopy
3.2.1. Geometric Structure
Top and side views of the DFT optimized geometry of the [(TMC)FeIII–OOH]2+ complex are shown in Figure 1. As described in the Introduction, the complex does not have an axial ligand trans to the OOH ligand. From DFT calculations, the ∠Fe–O–O is 120° and the Fe–O–O plane bisects cis N–Fe bonds. The optimized O–O bond is 1.48 Å and the predicted Fe–O bond and averaged Fe–N bonds are 1.84 and 2.19 Å, which agree well with EXAFS results of 1.85 and 2.16 Å, respectively.23
3.2.2. Electronic Structure
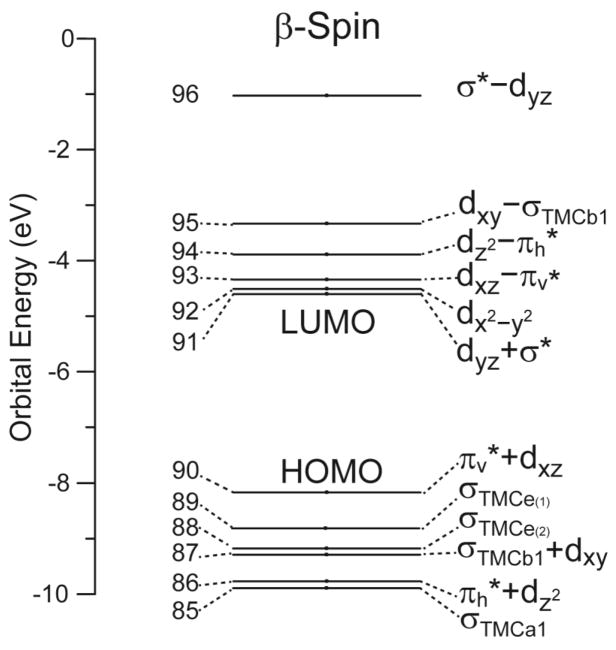
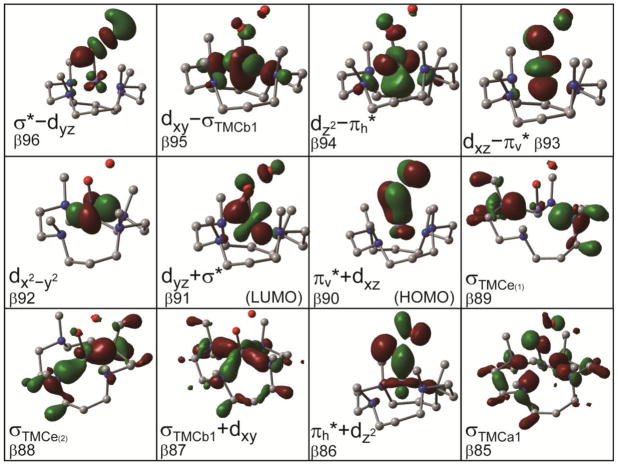
Since the [(TMC)FeIII–OOH]2+ complex has a ground state of S = 5/2, all five α-spin d orbitals are occupied and all five β-spin d orbitals are unoccupied. As with the alkylperoxo ligand in ref 24, the hydroperoxo only acts as donor ligand; therefore, only the β-spin d orbitals can contribute to net bonding. These are given in the spin-unrestricted molecular orbital (MO) diagram in Figure 4 with boundary surface plots in Figure 5. The coordinate system used is given in Figure 1. (z-axis along the Fe–O bond and y and x are in and perpendicular to the Fe–O–O plane, respectively, which bisects the equatorial L–M bonds.)
Figure 4.
β-spin molecular orbital diagram of the [(TMC)FeIII–OOH]2+ complex in the coordinate system defined in Figure 1. The “a+b” and “a−b” notations mean bonding and anti-boding molecular orbitals, respectively, between orbitals a and b, and a is the major component of the resulting molecular orbital.
Figure 5.
Boundary surface plots of the important β-spin MOs of the [(TMC)FeIII–OOH]2+ complex.
We have previously presented a detailed analysis of the electronic structure of a HS FeIII–alkylperoxo complex.24 Since the [(TMC)FeIII–OOH]2+ complex is similar, we only present a brief description here. The hydroperoxo ligand has two HOMO π* orbitals that have donor interactions with Fe d orbitals and contribute to the Fe–OOH bonding. The out-of-plane πv* orbital of the hydroperoxo interacts with the dxz orbital of the Fe in a π-type fashion. The resulting bonding orbital, πv*+dxz (β90), is the β-spin HOMO. Similar to the HS FeIII–alkylperoxo complex, the πv*+dxz (β90) orbital has 25% iron and 73% hydroperoxo characters, indicating a very covalent π donor bond.24 The corresponding antibonding orbital, dxz–πv* (β93) (71% iron and 22% hydroperoxo), is unoccupied and is the highest energy dπ orbital. The second π* orbital of the hydroperoxo (the in-plane πh*) interacts with the Fe dz2to form a σ-type bonding molecular orbital, πh*+dz2 (β86) (25% iron and 73% hydroperoxo character) and a corresponding antibonding orbital dz2–πh* (β94) (73% iron and 10% hydroperoxo). Note that the dσ dz2–πh* is only 0.46 eV higher than the dπ dxz–πv* orbital, which is small relative to that of the HS FeIII–alkylperoxo complex of 1.6 eV.24 This reflects the lack of an axial ligand trans to the hydroperoxo ligand in the [(TMC)FeIII–OOH]2+ complex, which results in a lower dz2 orbital energy. There are four TMC σ donor orbitals from the combination of the four amine σ donor orbitals with a1, b1, and e symmetries in approximate C4v. The σTMCb1 orbital interacts with the dxy orbital of Fe in a σ-donor fashion and forms the σTMCb1+dxy (β87) bonding and the dxy–σTMCb1 (β95) antibonding orbitals, the latter being at higher energy than the other dσ orbital (dz2–πh* (β94)). The β-spin LUMO is a dπ type orbital, dyz+σ* (β91) (85% iron and 5% hydroperoxo). It is the bonding combination of iron dyz and the σ* LUMO of hydroperoxo ligand; the corresponding antibonding combination is the σ*–dyz (β96) (9% iron and 90% hydroperoxo) orbital, located ~3 eV above the d manifold. Since both are unoccupied, there is no net contribution to bonding but this shifts the dyz+σ* (β91) to lower energy than the non-bonding dx2–y2 (β92) orbital. This will be significant with respect to the spectroscopy and reactivity.
3.2.3. TD DFT Calculations: Spectroscopic Assignments
From Figure 3A, the absorption spectrum of the [(TMC)FeIII–OOH]2+ complex features an intense broad band ~19120 cm−1 and a weak band on its low energy side at ~13000 cm−1. These two features are well reproduced by TD DFT calculations, Figure 6. The weak band is predicted to arise from excitations A and B at 13595 and 14830 cm−1, respectively. Transitions A and B correspond to the πv*+dxz → dyz+σ* (92% pure, HOMO to LUMO) and πv*+dxz → dx2–y2 (96% pure) charge transfer (CT) excitations in Figure 4, with low predicted oscillator strengths of 0.0006 and 0.0003, respectively. This is consistent with the resonance Raman enhancement of the Fe–O and O–O stretches observed for band 1 in Figure 3A. The low intensity of these transitions is due to the small coefficient of mixing between the donor (mostly hydroperoxide πv*) and acceptor (dyz+σ* and dx2–y2) MOs. As mentioned in section 3.1.2., no equivalent low energy low intensity band was observed in the HS FeIII–alkylperoxo species in ref 24. This is because the acceptor dyz+σ* orbital is closer to the acceptor dxz–πv* orbital in the HS FeIII–alkylperoxo than in the [(TMC)FeIII–OOH]2+ complex (0.112 vs 0.252 eV). Transitions C and D in Figure 6 at 18560 and 19260 cm−1 give rise to the intense broad Abs band that reproduces the energy position and intensity of the 19120 cm−1 band 2 in the absorption spectrum in Figure 3A. Excitations C and D correspond to the intense πv*+dxz → dxz–πv* (81% pure) and weak πv*+dxz → dz2–πh* (86% pure) CT transitions, with predicted oscillator strengths of 0.0312 and 0.0012, respectively. The high intensity of the z-polarized πv*+dxz → dxz–πv* CT transition reflects the high covalency of the π bond between the dxz and hydroperoxo πv* orbitals. Coupled to the VTVH MCD data, band 2 of the Abs spectrum (Figure 3A) is assigned to be the πv*+dxz → dxz–πv* CT transition. Transition D corresponds to a CT to the dz2 orbital and is close in energy to C (CT to a dπ* type orbital) due to the lower energy of the dz</sup>2</sup> orbital associated with the lack of axial ligand for this complex. Excitations E and F are two TMC to iron CT transitions, σTMCb1+dxy → dx2–y2 (82% pure) (a σ bonding → non-bonding) and σTMCe(1) → dx2–y2 (49% mixed character) at 22500 and 23600 cm−1, with predicted oscillator strengths of 0.0002 and 0.0052, respectively. These transitions are xy-polarized consistent with VTVH MCD on band 3 in Figure 3D. At higher energy are other states corresponding to TMC and hydroperoxo πh*+dz2 to iron CT transitions, which are summarized in SI Table S1, consistent with the additional bands in Figure 3A.
Figure 6.
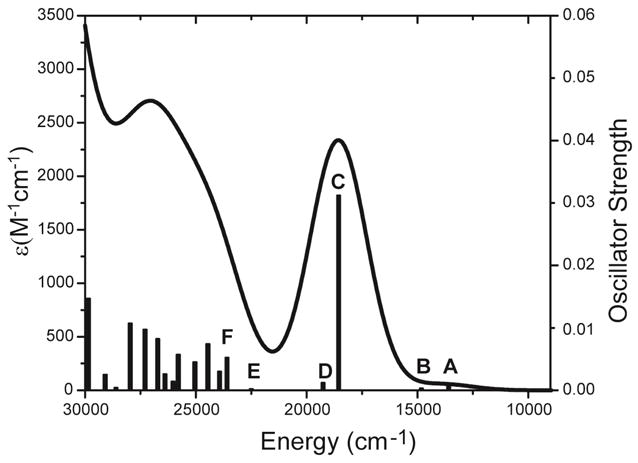
TDDFT predicted absorption spectrum of the [(TMC)FeIII–OOH]2+ complex. The bars represent the values of calculated oscillator strength (right-axis) of the transitions at the calculated energies indicated. The first six excited states are labeled as A–F, respectively.
In summary, the spectral data combined with TD DFT calculations on the [(TMC)FeIII–OOH]2+ complex show that the πv* orbital of hydroperoxo ligand forms a strong covalent π donor bond with the dxz orbital of FeIII and gives rise to the dominant intense z-polarized CT transition band 2. The xy-polarized band 3 arises from TMC to FeIII CT transitions. It is important to note that the low energy band 1 present in the HS [(TMC)FeIII–OOH]2+ complex reflects a particularly low energy CT to the dyz+σ* orbital and indicates the presence of a configuration interaction with the higher energy hydroperoxo σ* orbital which will provide significant insight into reactivity (vide infra). The density functional and basis set (geometric optimization by B3LYP/6-311g* for Fe, 6-311g for other atoms; single point by B3LYP/6-311+g** with solvent correction) used in these calculations reproduce well the geometric and electronic structure of the [(TMC)FeIII–OOH]2+ complex and are used for reaction coordinate calculations below.
3.3. O–O Bond Homolysis
3.3.1. Kinetics
In our recent study, the [(TMC)FeIII–OOH]2+ complex was found to undergo O–O bond homolysis.23 This is the first HS ferric hydroperoxide species reported to undergo homolysis. This observation however does not appear to be consistent with the results in ref 24 that the O–O bond homolysis of the HS system has an extra ~10 kcal/mol barrier relative to the LS FeIII–OOH system which does undergo O–O bond homolysis.24 The additional O–O bond homolysis barrier of HS systems is due to an allowed orbital crossing that originates from the non-interacting nature of the redox active orbitals on the HS FeIII and the hydroperoxide. Alternatively, O–O bond homolytic cleavage of the LS system involves a forbidden orbital crossing that originates from the strong configuration interaction of the redox active orbitals and thus has no additional barrier for this endergonic reaction.24 It is important to note, however, that the product of [(TMC)FeIII–OOH]2+ homolysis is a 6C LS S = 1 FeIV=O species and thus a spin surface crossing must occur at some point in the reaction coordinate.
In order to quantitatively compare the reactivities of HS and LS FeIII–OOH species in O–O bond homolysis, temperature-dependent kinetic experiments were performed on HS [(TMC)FeIII–OOH]2+ and on the LS [(N4Py)FeIII–OOH]2+ complex. The LS 6C [(N4Py)FeIII–OOH]2+ complex undergoes O–O homolysis to also form a 6C LS S = 1 FeIV=O species.39 The kinetic parameters obtained are summarized in Table 2. The Arrhenius plots (Figure S1) of the temperature-dependent kinetic data show that the activation energy Ea of the O–O bond homolysis of the HS complex is slightly higher than that of the LS complex. The Eyring plots (Figure S2) of the temperature-dependent kinetic data yield a slightly higher ΔH‡ and a less negative ΔS‡ for the HS complex than those of the LS complex, respectively. At 298 K, the ΔG‡ of the HS complex is 2.2 kcal/mol lower than that of the LS complex.24 Thus, the experimental O–O bond homolysis energetics of the HS [(TMC)FeIII–OOH]2+ and the LS [(N4Py)FeIII–OOH]2+ complexes are very similar, which does not appear to be consistent with the previous prediction that a HS hydroperoxo system will have an additional barrier for O–O bond homolysis.24
Table 2.
Kinetic parameters of HS [(TMC)FeIII–OOH]2+ and LS [(N4Py)FeIII–OOH]2+ O–O homolytic cleavages.
| kcal/mol | [(TMC)FeIII–OOH]2+ | [(N4Py)FeIII–OOH]2+ |
|---|---|---|
| Ea | 13.9(5) | 12.9(2) |
| ΔH‡ | 13.4(5) | 12.6(3) |
| ΔS‡(cal/mol·K) | −17.9(4) | −28.9(2) |
| ΔG‡ | 18.7(5) (298 K) | 20.9(3) (298 K) |
3.3.2. DFT Calculations of O–O bond homolysis
Since the HS [(TMC)FeIII–OOH]2+ complex changes coordination number and spin state along the reaction coordination, a potential energy surface crossing must occur.23 In order to evaluate this process, we constructed high spin (HS, S = 5/2), intermediate spin (IS, S = 3/2), and low spin (LS, S = 1/2) two-dimensional potential energy surfaces (PES), where the O–O bond is scanned from 1.4 to 2.2 Å with 0.1 Å increments and the Fe-acetonitrile bond (the solvent which is capable of coordinating to FeIII) is scanned from 1.9 to 3.1 Å with 0.1 Å increments. The overlay of these three PESs is shown in Figure 7A. Note that the freely optimized HS [(TMC)FeIII–OOH]2+ complex has an O–O bond of 1.48 Å and an Fe-acetonitrile distance of 4.37 Å. Its approximate position on the HS PES (red, transparent) is indicated as a red solid dot in Figure 7A. In general, the IS PES (green, transparent) is at higher energy than the HS PES (red, transparent) over most of the coordinates surveyed, Figure 7A. Although the HS PES is lower in energy than the LS PES (blue, opaque) at long Fe-acetonitrile (Fe–ACN) and short O–O bond lengths, the LS PES is lower in energy than the HS PES at short Fe–ACN and long O–O bond lengths. This is because the [(TMC)FeIII–OOH]2+ complex energetically favors binding the axial ligand on the S = 1/2 spin state and disfavors axial ligand binding in the S = 5/2 spin state. Thus, the HS and LS PESs cross and result in an isoenergetic two-dimensional seam, Figure 7B and C.
Figure 7.
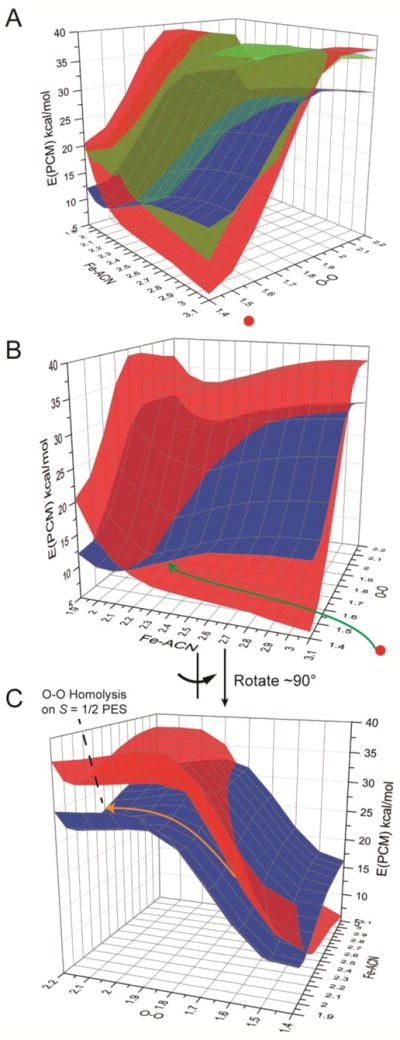
2D potential energy surfaces of S = 5/2 (red, transparent), 3/2 (green, transparent), and 1/2 (blue, opaque) spin states of O–O bond homolysis of the HS [(TMC)FeIII–OOH]2+ complex with acetonitrile (ACN) as a trans axial ligand to the hydroperoxo group. The two coordinates scanned are O–O and Fe–ACN in Å. Energies are related to the freely optimized HS [(TMC)FeIII–OOH]2+ complex with O–O bond length of 1.48 Å and an Fe–ACN distance of 4.37 Å. Its approximate position on the S = 5/2 PES is indicated as a red solid dot. (A) Overlay of S = 5/2, 3/2, and 1/2 PESs. (B) Overlay of S = 5/2 and 1/2 PESs. (C) 90° rotation of B.
All three PESs have their O–O bond homolysis saddle points in the regions around an Fe–ACN bond length of ~2.1 Å and an O–O bond length of ~1.9 Å. The LS PES has the lowest barrier of ~26 kcal/mol, the HS PES has a barrier of ~34 kcal/mol, and the IS PES has a barrier of ~36 kcal/mol. The energy difference for O–O bond homolysis barriers on the HS and LS PESs is thus consistent with the previous prediction in Ref 24 that the barrier on the HS PES is ~10 kcal/mol higher than that of the LS PES and, in fact, O–O bond homolysis does not occur on the HS PES.24 The PESs in Figure 7, combined with the experimental results that the HS [(TMC)FeIII–OOH]2+ complex undergoes O–O bond homolysis to form a LS 6C S = 1 Fe(IV)=O species and that the O – O bond homolysis of the HS [(TMC)FeIII–OOH]2+ and the LS [(N4Py)FeIII–OOH]2+ complexes have similar activation energies, indicate that the HS [(TMC)FeIII–OOH]2+ complex first crosses to the LS PES and then undergoes O–O bond homolysis on the LS PES. In Figure 7B, the green arrow indicates a reasonable pathway for O–O bond homolysis of the HS complex, where the Fe–ACN coordinate first contracts without O–O bond elongation. As the Fe-ACN distance decreases, the HS PES increases in energy and the LS PES decreases. These become isoenergetic at the crossing point on the seam of the HS and LS PES. At an Fe–ACN of ~2.2 Å and an O–O of ~1.5 Å, the energy is ~10 kcal/mol higher than that of the freely optimized HS [(TMC)FeIII–OOH]2+ complex (Fe–ACN distance = 4.37 Å). In this region of the 2D surfaces, the IS PES is only ~7 kcal/mol higher in energy and would provide a mechanism for 2nd-order spin orbit coupling between the HS and LS states, which allows their crossing. After the HS to LS crossover, the system proceeds along the minimum energy path (mostly along the O–O coordinate, orange arrow in Figure 7C) with an Fe-ACN distance of ~2.1 Å (Figure 7C), and undergoes O–O bond homolysis to produce the S = 1 [(TMC)FeIV=O]2+ acetonitrile bound product and a hydroxyl radical.
Focusing on ΔH‡ to avoid added issues associated with entropy at the transition state, the DFT calculated ΔH‡ of the O–O bond homolysis of the LS [(N4Py)FeIII–OOH]2+ complex is 19.6 kcal/mol, in Scheme 1 right. Compared to the experimental results, the DFT calculations overestimate this ΔH‡ value by 7.4 kcal/mol, Table 2. The DFT calculated ΔH‡ of the O–O bond homolysis of the HS [(TMC)FeIII–OOH]2+ complex which occurs on the LS PES is 26.3 kcal/mol, which is 12.9 kcal/mol higher than the experimental ΔH‡ value. The DFT calculated ΔH‡ value for [(TMC)FeIII–OOH]2+ can be decomposed into two contributions, the energy difference (11.6 kcal/mol) between LS and HS states and the energy difference (14.7 kcal/mol) between LS PES saddle point and LS [(TMC)FeIII–OOH]2+. Taking into account of the 7.4 kcal/mol that the DFT overestimates the O–O bond homolysis of the LS [(N4Py)FeIII–OOH]2+ complex, the spin state energy difference in the B3LYP calculations would be off by 5.5 kcal/mol. This spin state splitting is known to be very sensitive to functional. When the Hartree-Fock exchange of 20% of the B3LYP hybrid functional is decreased to 10% and 0%, this HS and LS energy splitting does in fact decrease from 11.6 kcal/mol in B3LYP to −1.7 kcal/mol and −11.6 kcal/mol (0% HF exchange).
Scheme 1.
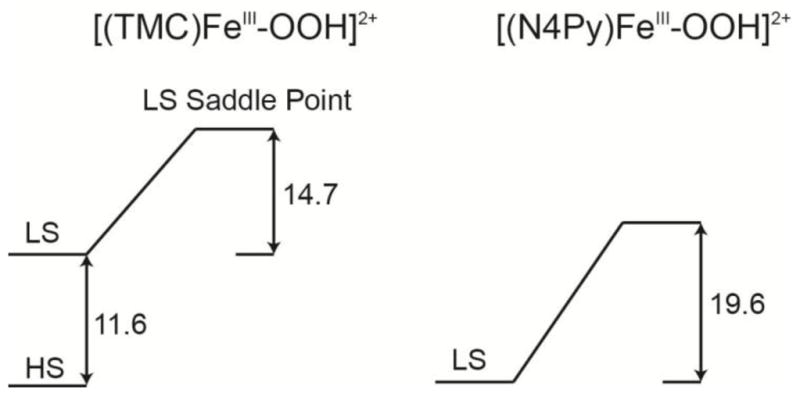
DFT calculated ΔH‡ (298 K, in kcal/mol) of the O–O bond homolysis saddle point on the LS PES (right) compared with freely optimized HS and LS [(TMC)FeIII–OOH]2+ without and with acetonitrile bound as an axial ligand, respectively (left).
In summary, the HS [(TMC)FeIII–OOH]2+ complex first crosses to the LS PES (via 2nd-order spin-orbit coupling) through axial ligand binding at a short O–O length, and then undergoes O–O bond homolysis on the LS PES.
3.4. H-atom Abstraction Reactivities
3.4.1. Kinetics
In an earlier study, several LS FeIII–OOH model complexes, including [(N4Py)FeIII–OOH]2+, were found to be incapable of oxidizing cyclohexene (C–H bond of 83.9 kcal/mol).40 This is in contrast to activated bleomycin, a LS FeIII–OOH species, which performs direct H-atom abstraction reaction for the strong C–H bond of sugar (92 kcal/mol).6–8 In our recent study, we provided direct experimental evidence that the HS [(TMC)FeIII–OOH]2+ is capable of abstracting an H-atom from weak C–H bonds (xanthene (75.5 kcal/mol) and 9,10-dihydroanthracene (77 kcal/mol)), showing that the HS [(TMC)FeIII–OOH]2+ is as reactive as the LS [(TMC)FeIV=O]2+ species in H-atom abstraction.23 In order to compare the electrophilic reactivities of HS and LS FeIII–OOH species, we performed analogous kinetic experiments on HS [(TMC)FeIII–OOH]2+ and LS [(N4Py)FeIII–OOH]2+ with the same substrate (e.g., xanthene) in the same solvent system (e.g., a solvent mixture of acetone and trifluoroethanol (3:1 v/v)).
A second-order rate constant of 6.4 × 10⁻² M−1s−1 was determined for the C–H bond activation of xanthene by the LS [(N4Py)FeIII–OOH]2+ complex at 288 K, which is slower than the second-order rate constant (8.1 × 10⁻¹ M−1s−1) for this reaction by HS [(TMC)FeIII–OOH]2+ at 253 K. Temperature-dependent kinetic data are summarized in Table 3. The Arrhenius plots (Figure S3) of the temperature-dependent kinetic data show that the activation energy Ea of the H-atom abstraction of xanthene by the HS complex is 2.7 kcal/mol lower than that of the LS complex. From the Eyring plots (Figure S4) of the temperature-dependent kinetic data, the ΔG‡ of the HS complex is 1 kcal/mol lower than that of the LS complex at 288 K, which is consistent with the fact that the HS complex has a higher second-order rate constant than that of the LS complex. Thus, the HS [(TMC)FeIII–OOH]2+ complex is slightly more reactive than the LS [(N4Py)FeIII–OOH]2+ complex in H-atom abstraction from xanthene.
Table 3.
Kinetic parameters of HS [(TMC)FeIII–OOH]2+ and LS [(N4Py)FeIII–OOH]2+ reactions with xanthene.
| kcal/mol | [(TMC)FeIII–OOH]2+ | [(N4Py)FeIII–OOH]2+ |
|---|---|---|
| Ea | 11.7(3) | 14.4(2) |
| ΔH‡ | 11.2(3) | 13.9(3) |
| ΔS‡ (cal/mol·K) | −21.5(2) | −15.8(2) |
| ΔG‡ | 16.7(2) (253 K), 17.4(3) (288 K) | 18.4(3) (288 K) |
| KH2O/KD2O (H2O vs D2O) | 1.2(2) | 1.3(2) |
| KH/KD (xanthene vs d2-xanthene) | 5.0(2) | 3.0(2) |
3.4.2. DFT Calculated H-atom Abstraction Reaction Coordinate of LS [(N4Py)FeIII–OOH]2+
The DFT predicted reaction coordinate with xanthene as the substrate on the S = 1/2 PES is shown in Figure 8A. The transition state is 17.5/18.3 kcal/mol (ΔH‡/ΔG‡) higher in energy than the reactant complex, which is in a reasonable agreement with the experimental result (13.9/18.4 kcal/mol), Table 3. The products are predicted to be an S = 1 [(N4Py)FeIV=O]2+ species, a H2O, and an S = 1/2 radical; the reaction is exothermic at −25.6/−27.6 kcal/mol (ΔH/ΔG). The calculated transition state has only one imaginary frequency and a vibrational motion associated with O–O bond cleavage and O–H bond formation (see Figure 8B). Important structural and electronic properties of the reactant, transition state, and product are summarized in Table 4. At the transition state, the O–O bond length is 2.382 Å compared to 1.507 Å in reactant, which indicates that the O–O bond is essentially broken; the C–H bond of xanthene is only slightly elongated from 1.098 Å to 1.118 Å; the O–H distance is still fairly long at 1.979 Å. These bond lengths indicate the transition state occurs late in O–O cleavage coordinate and early in H-atom transfer coordinate. The OdistH unit has Mulliken spin density of −0.80 at transition state, which indicates the OdistH unit is essentially a hydroxyl radical resulting from O–O bond homolysis. The facts that Fe–O bond is 1.635 Å compared to 1.779 Å in the reactant and the Mulliken spin density on the Fe–O moiety is ~2 compared to ~1 in the reactant indicate that the Fe–O is essentially an S = 1 FeIV=O at transition state, resulting from O–O bond homolysis. This is supported by molecular orbital occupation analysis. These structural and electronic properties are very similar to the transition state for the direct H-atom abstraction reaction from the C4′–H of DNA by ABLM (i.e., a LS FeIII–OOH species).7 The similarities of these transition states indicate that the LS [(N4Py)FeIII–OOH]2+ complex and ABLM perform direct H-atom abstraction using the equivalent reaction coordinates.
Figure 8.
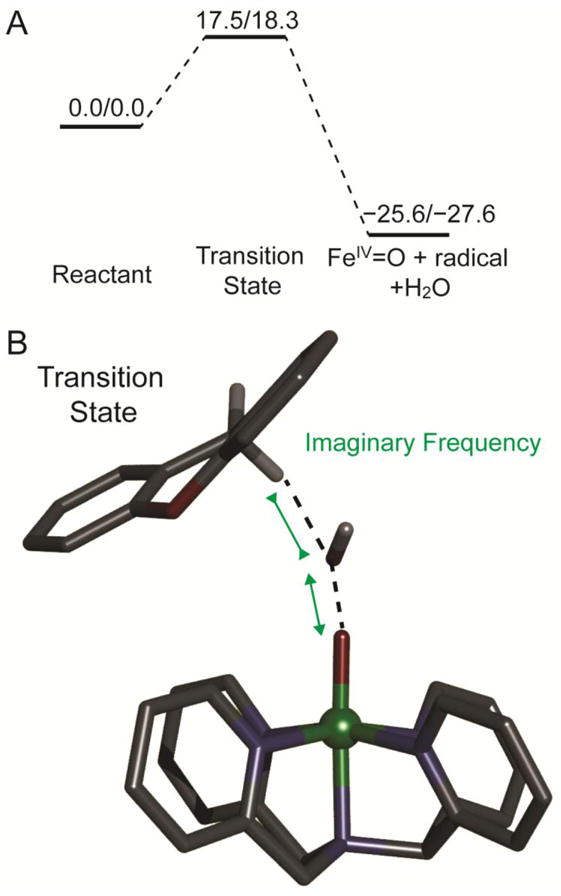
(A) S = 1/2 PES (ΔH/ΔG at 288 K, with solvent correction, in kcal/mol) for the reaction of the LS [(N4Py)FeIII–OOH]2+ complex with xanthene. (B) Transition state structure of the direct H-atom abstraction reaction between the LS [(N4Py)FeIII–OOH]2+ complex and xanthene. Fe atom is in green, N atoms are in blue, C atoms are in black, O atoms are in red, H atom is in white. Only important H atoms are shown, others are omitted for clarity.
Table 4.
Structural and electronic parameters changes of the H-Atom abstraction reaction with xanthene by the LS [(N4Py)FeIII–OOH]2+ complex
| Reactant | Transition State | Product | |
|---|---|---|---|
| Structure | |||
| r(Fe–O) | 1.779 Å | 1.635 Å | 1.645 Å |
| r(O–O) | 1.507 Å | 2.382 Å | |
| r(Odist–H) | 2.947 Å | 1.979 Å | 0.971 Å |
| r(H–C) | 1.098 Å | 1.118 Å | |
| Spin Densities | |||
| Fe | 0.83 | 1.22 | 1.21 |
| Oprox | 0.21 | 0.74 | 0.84 |
| OdistH | 0.02 | −0.80 | 0.00 |
| Xanthene–H | 0.00 | −0.10 | −1.00 |
| H-atom | 0.00 | 0.00 | 0.01 |
3.4.3. DFT Calculated H-atom Abstraction Reaction Coordinate of HS [(TMC)FeIII–OOH]2+: Comparison to LS [(N4Py)FeIII–OOH]2+
Since the HS [(TMC)FeIII–OOH]2+ O–O bond homolysis undergoes a HS to LS crossover before O–O bond cleavage, we evaluated the reaction coordinate of [(TMC)FeIII–OOH]2+ for H-atom abstraction on the S = 5/2, 3/2, and 1/2 (HS, IS, and LS) PESs, as shown in Figure 9A. The ground state of the reactant is HS and the S = 5/2 transition state is lower in energy than the other two (S = 1/2 and 3/2) transition states. Therefore, in contrast to the O–O bond homolysis process, the H-atom abstraction reaction on the HS PES proceeds through the HS S = 5/2 transition state. For xanthene as a substrate, the S = 5/2 transition state is calculated to be 16.1/18.8 kcal/mol (ΔH‡/ΔG‡) higher in energy than the reactant complex. The DFT predicted ΔH‡ value is ~5 kcal/mol higher than the experiment value (11.2 kcal/mol, Table 3). However, it is lower than the DFT predicted ΔH‡ (17.5 kcal/mol) of the LS [(TMC)FeIII–OOH]2+ H-atom abstraction reaction and thus reproduces the experimental trend. The calculated S = 5/2 transition state has only one imaginary frequency and a vibrational motion associated with O–O bond cleavage, O–H bond formation, and Fe–O shortening (see Figure 9B).
Figure 9.
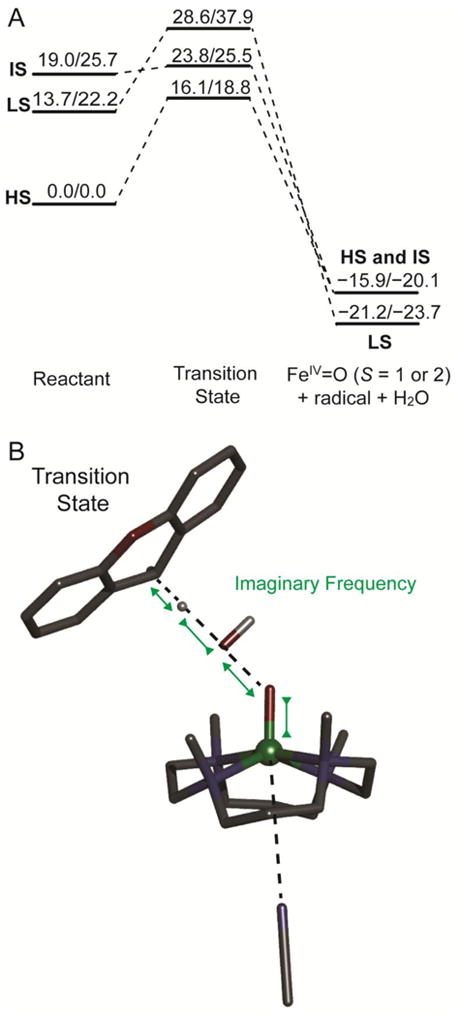
(A) S = 1/2, 3/2, and 5/2 (LS, IS, and HS) PES (ΔH/ΔG at 253 K, with solvent correction, in kcal/mol) for the reaction of the [(TMC)FeIII–OOH]2+ complex with xanthene. The transition states energies were calculated as the energy difference between transition state and reactant components calculated in one box. The products energies were calculated as the energy difference between product and reactant components calculated in separate boxes to prevent electron transfer from product radical to [(TMC)FeIV=O]2+. (B) S = 5/2 transition state structure for the direct H-atom abstraction reaction between the HS [(TMC)FeIII–OOH]2+ complex and xanthene. Fe atom is in green, N atoms are in blue, C atoms are in black, O atoms are in red, H atom is in white. Only important H atoms are shown, others are omitted for clarity. Note that the axial ligand, modeled as acetonitrile for the reason mentioned in section 2.4, is not coordinated in the TS (4.39 Å) on the HS PES.
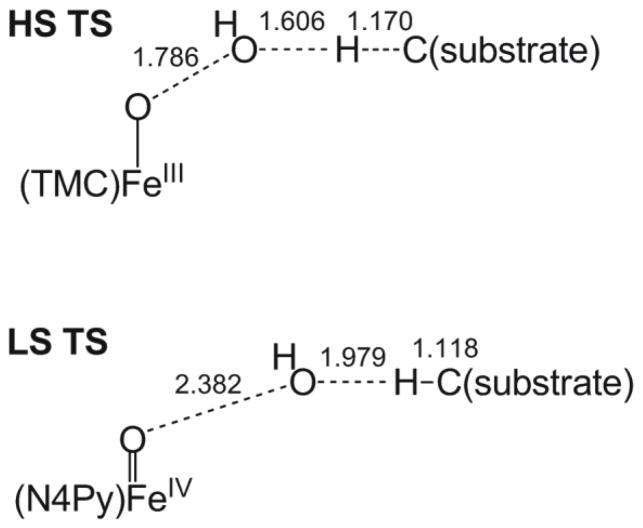
The geometric and electronic structures of the S = 5/2 HS [(TMC)FeIII–OOH]2+ transition state (HS TMC TS) are very different from that of the S = 1/2 LS [(N4Py)FeIII–OOH]2+ transition state (LS N4Py TS) (see Table 4 and 5). The HS TMC TS has an O–O bond of 1.786 Å, which is much shorter than that of the LS N4Py TS (2.382 Å). According to the Mayer bond order,41 the HS TMC O–O bond is ~52% broken at the transition state, whereas the LS N4Py TS O–O bond is ~83% broken. The C–H bond of xanthene in HS TMC TS is elongated from 1.098 Å to 1.170 Å, which is longer than that of the LS N4Py TS (1.118 Å). Again, according to Mayer bond order analysis,41 the HS TMC TS C–H bond is ~23% broken, whereas the LS N4Py TS C–H bond is only ~5% broken. The longer C–H bond in the HS TMC TS is consistent with the primary KIE values of 5.0 and 3.0 for HS and LS FeIII–OOH species, respectively (see Table 3). These bond lengths indicate the HS TMC TS occurs early in both the O–O and H–C cleavage coordinates. The close to zero Mulliken spin density on the OdistH unit of HS TMC TS indicates that in contrast to the Mulliken spin density of −0.80 of the OdistH unit of the LS N4Py TS, the OdistH unit is not a hydroxyl radical. It is important to note that there is 0.33 e− transfer from xanthene to HS [(TMC)FeIII–OOH]2+ at the TS; however, almost no electron (0.04 e−) transfer occurs from xanthene to the LS [(N4Py)FeIII–OOH]2+ at the TS. The electronic structure calculations (Figure 10) reveal that the 0.33 e− comes solely from the xanthene based β-spin HOMO (β149, 99.6% xanthene) and is transferred into the FeIII–OOH based β-spin LUMO (β150, 83.5% Fe and 9.3% OOH−, which is the dyz+σ* orbital). This β-spin LUMO is responsible for the low energy absorption band of the [(TMC)FeIII–OOH]2+ complex in Figure 3A. In summary, the geometric and electronic structures of the transition states of HS TMC and LS N4Py are very different and imply different reaction coordinates, which will be discussed below.
Table 5.
Structural and electronic parameters changes from reactant to transition of the H-Atom abstraction reaction with xanthene by the HS [(TMC)FeIII–OOH]2+ complex on S = 5/2 PES.
| Reactant | Transition State | |
|---|---|---|
| Structure | ||
| r(Fe–O) | 1.862 Å | 1.749 Å |
| r(O–O) | 1.512 Å | 1.786 Å |
| r(Odist–H) | 2.016 Å | 1.606 Å |
| r(H–C) | 1.098 Å | 1.170 Å |
| Spin Densities | ||
| Fe | 4.02 | 3.85 |
| Oprox | 0.35 | 0.26 |
| OdistH | 0.06 | 0.05 |
| Xanthene–H | 0.00 | 0.32 |
| H-atom | 0.00 | 0.01 |
Figure 10.
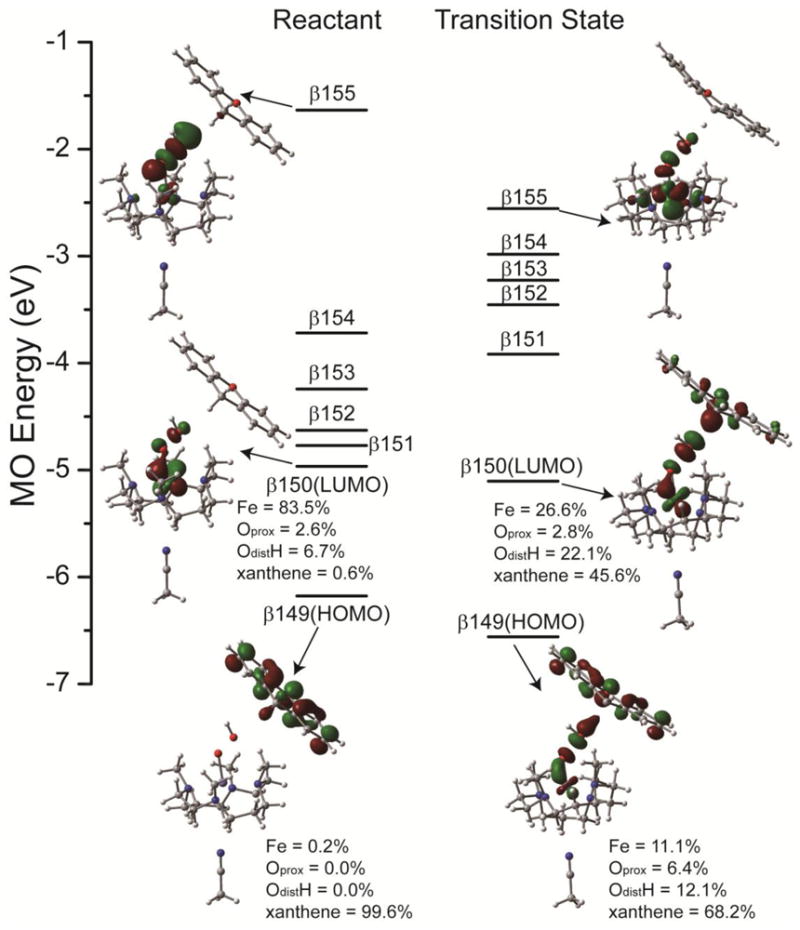
Energies and boundary surface plots of the important β-spin MOs of the reactant and transition state of the [(TMC)FeIII–OOH]2+ reaction with xanthene on the S = 5/2 PES (using acetonitrile as the potential axial ligand, see section 2.4). Mulliken population analysis are given for β-spin HOMO and LUMO of reactant and transition state.
The energies of the experimentally defined H-atom abstraction reaction products (e.g., [(TMC)FeIV=O]2+, H2O, and xanthene-H radical) were obtained by calculating the individual components. The S = 1 [(TMC)FeIV=O]2+ product is predicted to be the ground state, which is in agreement with experiment.23 Thus, the system needs to cross from the S = 5/2 to the S = 1/2 PES, Figure 9A. Since after the transition state the FeIV=O has an S = 2 electronic structure, its crossing to the S = 1 PES was evaluated. PES scans along Fe–O coordinate (Figures S7A and B) of S = 2 and S = 1 [(TMC)FeIV=O]2+ reveal that these PESs do not cross, independent of whether the axial acetonitrile binds to Fe. Since the S = 1 [(TMC)FeIV=O]2+ has shorter Fe–equatorial ligand bonds than those of S = 2 [(TMC)FeIV=O]2+ (average Fe–equatorial bond lengths of 2.09 vs 2.16 Å, respectively), we further surveyed the PESs for contraction along these coordinates, Figure S7C, which demonstrates that the energies of the S = 2 and S = 1 [(TMC)FeIV=O]2+ species are indeed sensitive to one pair of Fe–equatorial ligand bonds, defined as Fe–eqB. Therefore, 2D PESs along both the Fe–O and Fe–eqB coordinates were evaluated, Figure S7D, and a reasonable reaction pathway is indicated by the black arrows. Starting from the transition state, the Fe–O bond contracts on the S = 2 PES. At short Fe–O and long Fe–eqB bond length, the system crosses from the S = 2 to the S = 1 PES via an allowed spin-orbit coupling, and then proceeds to shorten the Fe–eqB coordinate on the S = 1 PES to form the LS product observed experimentally.23
It is of interest to note that when the HS system is propagated past its TS, a HS S = 5/2 FeIII=O product is observed that is at ~ −45 kcal/mol (Figure S6), which represents an effective hydride abstraction reaction that is not observed experimentally.23 The electronic structure of the HS TMC TS described above clearly shows an H-atom abstraction process. Therefore, a second electron transfer from the substrate follows an initial H-atom abstraction. A recent computational study of H-atom abstraction by HS S = 2 FeIV=O species observed an analogous second electron transfer.42 For the HS FeIII–OOH system, the second electron transfer, which does not occur experimentally, can be attributed to the self-interaction error inherent in DFT when the system is positively charged.43–45
In summary, the H-atom abstraction reaction by the HS [(TMC)FeIII–OOH]2+ complex occurs on the S = 5/2 PES with a different reaction coordinate compared to that of the LS [(N4Py)FeIII–OOH]2+ complex. For the HS system, the transition state features a shorter O–O and longer C–H bonds than those of the LS transition state.
4. Discussion
In agreement with ref 24, O–O bond homolysis of HS FeIII–OOH complexes should have a ~10 kcal/mol higher cleavage barrier relative to LS FeIII–OOH complexes as shown in Figure 11. The O–O bond homolysis observed in the five-coordinate S = 5/2 (HS) [(TMC)FeIII–OOH]2+ complex in fact appears to occur by first crossing to the LS PES through axial ligand binding at short O–O lengths, and then undergoing O–O bond homolysis on the LS PES to produce the six-coordinate S = 1 [(TMC)FeIV=O]2+ species that is observed in experiment.
Figure 11.
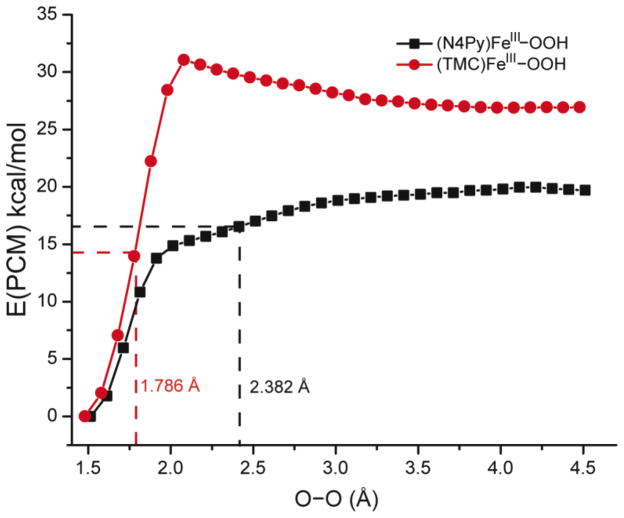
One-dimensional PESs of HS [(TMC)FeIII–OOH]2+ (red dots) and LS [(N4Py)FeIII–OOH]2+ (black rectangles) along O–O bond.
With respect to H-atom abstraction from xanthene, the LS [(N4Py)FeIII–OOH]2+ features a transition state late in the O–O coordinate and early in the C–H coordinate. This transition state essentially reflects O–O bond homolysis generating a hydroxyl radical, which then performs H-atom abstraction from the substrate. This is consistent with the fact that the O–O bond homolysis energy at the O–O bond length associated with the transition state for H-atom abstraction (2.382 Å) is ~20 kcal/mol (Figure 11). To evaluate the contribution of O–O homolysis energy to the transition state energies of the HS and LS FeIII–OOH H-atom abstraction reactions, we decomposed the transition state energies into three contributions: the O–O distortion energy of the FeIII–OOH at the transition state, the C–H distortion energy of the substrate at the transition state. As shown in Table 6, the summation of these contributions is in good agreement with the directly calculated TS energies, which validates this decomposition scheme. For the reaction of the LS [(N4Py)FeIII–OOH]2+ with xanthene, the substrate distortion energy is only 0.6 kcal/mol, the O–O distortion energy is 19.6 kcal/mol, and the TS energy is 20.0 kcal/mol. Therefore, the O–O distortion energy is the dominant contribution to the activation energy for H-atom abstraction by the LS [(N4Py)FeIII–OOH]2+ complex.
Table 6.
Energy decomposition of H-atom abstraction reaction transition states of HS [(TMC)FeIII–OOH]2+ and LS [(N4Py)FeIII–OOH]2+ with the series of substrates defined in Figure S8. Electronic energies are given with solvation correction. Important geometric parameters of these transition states are shown in Table S3. The interaction energy is obtained as the difference between the energy of FeIII–OOH complex and substrate at the transition state geometries but kept 10 Å away and the energy of transition state.
| Substrates | xanthene 0F | 1F | 2F | 3F | 4F | 6F | dioxine | dioxine 3F | dioxine 6F |
|---|---|---|---|---|---|---|---|---|---|
| HS [(TMC)FeIII–OOH]2+ | |||||||||
| TS energy | 18.4 | 19.2 | 19.7 | 22.6 | 24.3 | 25.2 | 25.3 | 27.0 | 28.5 |
| FeIII–OOH/substrate interaction energy | −6.3 | −5.0 | −5.5 | −6.1 | −6.8 | −6.3 | −12.1 | −11.1 | −8.5 |
| FeIII–OOH distortion energy | 22.1 | 20.9 | 20.3 | 22.2 | 24.4 | 24.9 | 31.4 | 31.9 | 30.1 |
| Substrate distortion energy | 2.8 | 2.7 | 2.8 | 5.1 | 7.7 | 7.2 | 7.4 | 7.8 | 8.5 |
| Summation | 18.6 | 18.6 | 17.7 | 21.2 | 25.3 | 25.7 | 26.8 | 28.6 | 30.1 |
| LS [(N4Py)FeIII–OOH]2+ | |||||||||
| TS energy | 20.0 | 19.9 | 19.7 | 19.8 | 20.3 | 20.4 | 20.8 | 21.3 | 20.9 |
| FeIII–OOH/substrate interaction energy | 0.2 | 0.0 | 0.0 | −0.2 | −0.9 | −0.9 | −3.1 | −3.3 | −3.4 |
| FeIII–OOH distortion energy | 19.3 | 19.3 | 19.4 | 20.1 | 20.0 | 19.9 | 21.2 | 21.0 | 20.6 |
| Substrate distortion energy | 0.6 | 0.5 | 0.3 | 1.3 | 2.0 | 1.7 | 3.6 | 4.2 | 5.2 |
| Summation | 20.1 | 19.9 | 19.8 | 21.3 | 21.1 | 20.9 | 21.7 | 21.9 | 22.4 |
The transition state for H-atom abstraction from xanthene by [(N4Py)FeIII–OOH]2+ is very similar to that of the direct H-atom abstraction reaction from DNA by ABLM.7 Interestingly, the ABLM reaction is even more reactive (Ea = 4.7 kcal/mol) against a stronger C–H bond (92 kcal/mol of sugar vs 75.5 kcal/mol of xanthene). This is likely due to the equatorial ligand difference between [(N4Py)FeIII–OOH]2+ and ABLM. ABLM has one negatively charged deprotonated amide ligand, which dominates the Fe dπ hole orientation of the LS FeIII–OOH complex and this reduces the overlap between the dπ hole and hydroperoxo ligand.46 This would destabilize the reactant. This ligand would also stabilize the transition state due to its electrostatic stabilization of the FeIV=O formed. Both would contribute to a lower Ea for ABLM relative to [(N4Py)FeIII–OOH]2+, enabling its reaction with the strong C–H bond of DNA.
With respect to the H-atom abstraction reaction by the [(TMC)FeIII–OOH]2+ species, in contrast to the O–O homolysis, this reaction occurs on the S = 5/2 PES. The HS TS for the H-atom abstraction reaction is strikingly different from the LS TS in its geometric structure, Scheme 2. In contrast to the LS TS, the HS TS is early in the O–O coordinate (TS O–O bond length is 1.786 Å for HS compared to 2.382 Å for LS). From Figure 11, for O–O homolysis on the HS surface, the PES is very steep between 1.5 to 2.1 Å, which means that a slight increase of O–O bond length corresponds to a large increase of energy. Therefore, the barrier would be too high for HS FeIII–OOH to undergo O–O bond homolysis to produce a hydroxyl radical for the H-atom abstraction. Also, the HS TS is further along in the C–H coordinate than the LS TS (1.170 vs 1.118 Å), which is in agreement with the experimental difference in primary KIE effect (e.g., HS:LS = 5:3). The HS TS is also distinctly different from the LS TS in electronic structure. From section 3.4.3, 0.33 e− transfers from the substrate to the HS [(TMC)FeIII–OOH]2+ at the transition state; however, almost no electron (0.04 e−) is transferred from substrate to the LS complex at its transition state. The HS S = 5/2 complex might be expected to be harder to reduce due to the greater loss of exchange stabilization. However, DFT calculations indicate that the reduction potential of HS [(TMC)FeIII–OOH]2+ is in fact 810 mV higher than that of the LS [(N4Py)FeIII–OOH]2+. This is consistent with experiment for iron complexes with similar ligands and the same charge but different spin state.47 The longer Fe–ligand bonds of the HS state result in less charge donation, thus a higher Zeff for the FeIII. Also, the redox active MO (RAMO) of the HS [(TMC)FeIII–OOH]2+ is the β-spin LUMO (dyz+σ* orbital in Figure 5), which undergoes configuration interaction with the higher energy hydroperoxo σ* orbital that further lowers its energy and also contributes to the higher reduction potential, Scheme 3A. Alternatively, the RAMO of the LS [(N4Py)FeIII–OOH]2+ complex is a strong antibonding Fe dπ orbital (with the hydroperoxo πv*, Scheme 3B) and therefore is higher in energy.25 Together, these favor electron transfer from substrate to the HS [(TMC)FeIII–OOH]2+.
Scheme 2.
Schematics of the transition states (TS) of HS and LS FeIII–OOH in H-atom abstraction reaction. HS TS features shorter O–O and longer C–H bonds than those of the LS TS. Bond lengths are in Å.
Scheme 3.
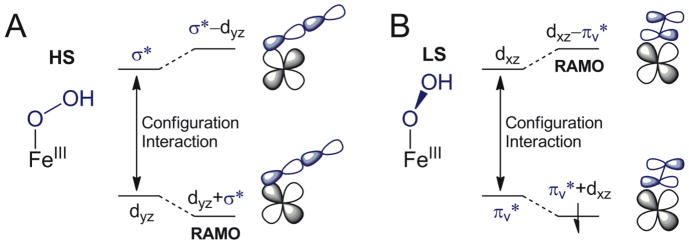
(A) The configuration interaction between dyz and hydroperoxo σ* orbitals of [(TMC)FeIII–OOH]2+ lowers the energy of dyz+σ* orbital as the RAMO. (B) The configuration interaction between hydroperoxo πv* and dxz orbitals of [(N4Py)FeIII–OOH]2+ increases the energy of dxz–πv* orbital as the RAMO.
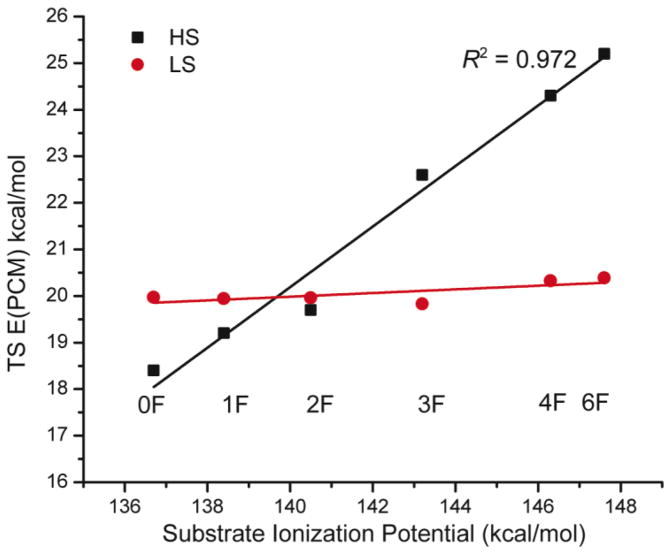
Since there is significant e− transfer from the substrate to FeIII–OOH in the HS TMC TS but not in the LS N4Py TS and since the substrate C–H bond contributes more in the HS TMC TS than the LS N4Py TS, the H-atom abstraction reactivity of the HS FeIII–OOH should be more dependent on substrate than that of the LS FeIII–OOH. In order to evaluate this idea, we carried out DFT calculations to compare the dependence of the energies of the transitions states for H-atom abstraction of the HS [(TMC)FeIII–OOH]2+ and the LS [(N4Py)FeIII–OOH]2+ on the ionization potential and C–H bond strength of substrates. Xanthene and fluorinated xanthenes (abbreviated as xanthene 0F, 1F, 2F, 3F, 4F, and 6F; structures and full formulas are given in Figure S8) were chosen to test the substrate ionization potential dependence. These compounds are calculated to have very different ionization potentials (varying from 136.7 kcal/mol for xanthene to 148.1 kcal/mol for hexafluoro-xanthene, Table S2, but with very similar C–H bond strengths (within 1.6 kcal/mol, Table S2). As shown in Figure 12, the HS FeIII–OOH is more reactive (i.e. lower transition state energy) than the LS FeIII–OOH towards xanthene 0F, 1F, and 2F (substrates with low ionization potentials), but less reactive towards 3F, 4F, and 6F (substrates with high ionization potentials). Thus, the activation energies for H-atom abstraction by HS [(TMC)FeIII–OOH]2+ (black rectangles) are clearly correlated with the substrate ionization potentials (R2 = 0.972). Alternatively from Figure 12, the activation energies for H-atom abstraction by LS [(N4Py)FeIII–OOH]2+ (red dots) are independent of substrate ionization potential. These results are consistent with the model that e− transfer occurs in the HS TMC TS but not in the LS TMC TS. For xanthene as the substrate, its e− transfer to the FeIII–OOH has about a 6 kcal/mol stabilization effect on the HS TS, Table 6.
Figure 12.
Dependence of the activation energies of HS [(TMC)FeIII–OOH]2+ (black rectangles) and LS [(N4Py)FeIII–OOH]2+ (red dots) H-atom abstraction reactions with xanthene and fluorinated xanthenes as indicated in the figure. Full names of these compounds are shown in Figure S8.
Alternatively, to examine the dependence of reactivity on the strength of C–H bonds, the transition states of H-atom abstraction from xanthene and a dioxine derivative (4b,10a-dihydrobenzo[b]benzo[3,4]cyclobuta[1,2-e][1,4]dioxine, abbreviated as dioxine, Figure S8) were evaluated. These compounds have very similar ionization potentials (1.3 kcal/mol from experiment48 and 0.3 kcal/mol from calculation, Table S2), but are calculated to have very different C–H bond strengths (dioxine is 21 kcal/mol stronger than xanthene, Table S2). As shown in Table 6, the activation energies of HS [(TMC)FeIII–OOH]2+ with xanthene and dioxine reactions are 18.4 kcal/mol and 25.3 kcal/mol, respectively, clearly dependent on C–H bond strength. However, for H-atom abstraction reactions of LS [(N4Py)FeIII–OOH]2+, the activation energy is only slightly higher (0.8 kcal/mol) even though this is a much stronger C–H bond. This is consistent with the small variation of activation energy for the H-atom abstraction by the hydroxyl radical from methane and halomethanes which have large variations of C–H bond strength.49,50 In conclusion, the reactivity of HS FeIII–OOH is dependent on substrate ionization potential and C–H bond strength. In contrast, the reactivity of LS FeIII–OOH is independent of substrate ionization potential and only slightly dependent on substrate C–H bond strength.
5. Conclusion
LS FeIII–OOH complexes should be more reactive towards substrates with strong C–H bonds as in ABLM, whereas HS FeIII–OOH complexes should be more reactive towards substrates with low ionization potentials and weak C–H bonds. The higher reduction potentials of the HS FeIII–OOH complexes also allow these to be active in electrophilic reactions without the requirement of O–O cleavage. This is important for the reaction coordinate in Rieske dioxygenases, which catalyze cis-dihydroxylation of a wide range of aromatic compounds. As mentioned in the Introduction, a HS FeIII–OOH intermediate is believed to be involved in the catalytic cycles of these enzymes. The open question is whether this intermediate is able to directly carry out cis-dihydroxylation with aromatic substrates or whether the O–O bond first cleaves to generate a high-valent HO•–FeIV=O or HO–FeV=O species for the cis-dihydroxylation.10,20–22 While the former mechanism has been favored by calculations,51 the latter mechanism has been favored based on a small amount of 18O incorporation into product from solvent.52 This study suggests that the former reaction coordinate is a plausible mechanism.
Supplementary Material
Acknowledgments
Financial support was provided by the National Institutes of Health (Grants no. GM 40392 to E.I.S.). The work at EWU was supported by the NRF/MEST of Korea through CRI, GRL (2010-00353), and WCU (R31-2008-000-10010-0) (W.N.).
Summary of Abbreviations
- ABLM
activated bleomycin
- NRVS
nuclear resonance vibrational spectroscopy
- HS
high spin
- IS
intermediate spin
- LS
low spin
- DFT
density functional theory
- TD DFT
time-dependent DFT
- MCD
magnetic circular dichroism
- VTVH MCD
variable-temperature variable-field MCD
- MO
molecular orbital
- RAMO
redox active MO
- CT
charge transfer
- PES
potential energy surface
Footnotes
Supporting Information Available: Tables S1-S3 and Figures S1-S8. This material is available free of charge via the Internet at http://pubs.acs.org.
References
- 1.Solomon EI, Brunold TC, Davis MI, Kemsley JN, Lee SK, Lehnert N, Neese F, Skulan AJ, Yang YS, Zhou J. Chem Rev. 2000;100:235. doi: 10.1021/cr9900275. [DOI] [PubMed] [Google Scholar]
- 2.Neidig ML, Solomon EI. Chem Commun. 2005:5843. doi: 10.1039/b510233m. [DOI] [PubMed] [Google Scholar]
- 3.Solomon EI, Wong SD, Liu LV, Decker A, Chow MS. Curr Opin Chem Biol. 2009;13:99. doi: 10.1016/j.cbpa.2009.02.011. [DOI] [PMC free article] [PubMed] [Google Scholar]
- 4.Costas M, Mehn MP, Jensen MP, Que L. Chem Rev. 2004;104:939. doi: 10.1021/cr020628n. [DOI] [PubMed] [Google Scholar]
- 5.Abu-Omar MM, Loaiza A, Hontzeas N. Chem Rev. 2005;105:2227. doi: 10.1021/cr040653o. [DOI] [PubMed] [Google Scholar]
- 6.Chow MS, Liu LV, Solomon EI. Proc Natl Acad Sci USA. 2008;105:13241. doi: 10.1073/pnas.0806378105. [DOI] [PMC free article] [PubMed] [Google Scholar]
- 7.Decker A, Chow MS, Kemsley JN, Lehnert N, Solomon EI. J Am Chem Soc. 2006;128:4719. doi: 10.1021/ja057378n. [DOI] [PubMed] [Google Scholar]
- 8.Liu LV, Bell CB, Wong SD, Wilson SA, Kwak Y, Chow MS, Zhao JY, Hodgson KO, Hedman B, Solomon EI. Proc Natl Acad Sci USA. 2010;107:22419. doi: 10.1073/pnas.1016323107. [DOI] [PMC free article] [PubMed] [Google Scholar]
- 9.Ashikawa Y, Fujimoto Z, Usami Y, Inoue K, Noguchi H, Yamane H, Nojiri H. BMC Struct Biol. 2012;12:1. doi: 10.1186/1472-6807-12-15. [DOI] [PMC free article] [PubMed] [Google Scholar]
- 10.Neibergall MB, Stubna A, Mekmouche Y, Munck E, Lipscomb JD. Biochemistry. 2007;46:8004. doi: 10.1021/bi700120j. [DOI] [PMC free article] [PubMed] [Google Scholar]
- 11.Karlsson A, Parales JV, Parales RE, Gibson DT, Eklund H, Ramaswamy S. Science. 2003;299:1039. doi: 10.1126/science.1078020. [DOI] [PubMed] [Google Scholar]
- 12.Burger RM. Chem Rev. 1998;98:1153. doi: 10.1021/cr960438a. [DOI] [PubMed] [Google Scholar]
- 13.Hecht SM. Acc Chem Res. 1986;19:383. [Google Scholar]
- 14.Hecht SM. J Nat Prod. 2000;63:158. doi: 10.1021/np990549f. [DOI] [PubMed] [Google Scholar]
- 15.Radtke K, Lornitzo FA, Byrnes RW, Antholine WE, Petering DH. Biochem J. 1994;302:655. doi: 10.1042/bj3020655. [DOI] [PMC free article] [PubMed] [Google Scholar]
- 16.Stubbe J, Kozarich JW. Chem Rev. 1987;87:1107. [Google Scholar]
- 17.Worth L, Frank BL, Christner DF, Absalon MJ, Stubbe J, Kozarich JW. Biochemistry. 1993;32:2601. doi: 10.1021/bi00061a018. [DOI] [PubMed] [Google Scholar]
- 18.Wu JC, Kozarich JW, Stubbe J. Biochemistry. 1985;24:7562. doi: 10.1021/bi00347a009. [DOI] [PubMed] [Google Scholar]
- 19.Gibson DT, Parales RE. Curr Opin Biotechnol. 2000;11:236. doi: 10.1016/s0958-1669(00)00090-2. [DOI] [PubMed] [Google Scholar]
- 20.Wolfe MD, Parales JV, Gibson DT, Lipscomb JD. J Biol Chem. 2001;276:1945. doi: 10.1074/jbc.M007795200. [DOI] [PubMed] [Google Scholar]
- 21.Ferraro DJ, Gakhar L, Ramaswamy S. Biochem Biophys Res Commun. 2005;338:175. doi: 10.1016/j.bbrc.2005.08.222. [DOI] [PubMed] [Google Scholar]
- 22.Chakrabarty S, Austin RN, Deng DY, Groves JT, Lipscomb JD. J Am Chem Soc. 2007;129:3514. doi: 10.1021/ja068188v. [DOI] [PMC free article] [PubMed] [Google Scholar]
- 23.Cho J, Jeon S, Wilson SA, Liu LV, Kang EA, Braymer JJ, Lim MH, Hedman B, Hodgson KO, Valentine JS, Solomon EI, Nam W. Nature. 2011;478:502. doi: 10.1038/nature10535. [DOI] [PMC free article] [PubMed] [Google Scholar]
- 24.Lehnert N, Ho RYN, Que L, Solomon EI. J Am Chem Soc. 2001;123:12802. doi: 10.1021/ja011450+. [DOI] [PubMed] [Google Scholar]
- 25.Lehnert N, Neese F, Ho RYN, Que L, Solomon EI. J Am Chem Soc. 2002;124:10810. doi: 10.1021/ja012621d. [DOI] [PubMed] [Google Scholar]
- 26.Roelfes G, Chen VV, Ho K, Rohde RYN, Zondervan JU, la Crois C, Schudde RM, EP, Lutz M, Spek AL, Hage R, Feringa BL, Munck E, Que L. Inorg Chem. 2003;42:2639. doi: 10.1021/ic034065p. [DOI] [PubMed] [Google Scholar]
- 27.Armarego WLF, Chai CLLE. Purification of Laboratory Chemicals. 6. Pergamon Press; Oxford: 2009. [Google Scholar]
- 28.Goldsmith CR, Jonas RT, Stack TDP. J Am Chem Soc. 2002;124:83. doi: 10.1021/ja016451g. [DOI] [PubMed] [Google Scholar]
- 29.Hunter TM, Paisey SJ, Park H, Cleghorn L, Parkin A, Parsons S, Sadler PJ. J Inorg Biochem. 2004;98:713. doi: 10.1016/j.jinorgbio.2003.10.018. [DOI] [PubMed] [Google Scholar]
- 30.Kaizer J, Klinker EJ, Oh NY, Rohde JU, Song WJ, Stubna A, Kim J, Münck E, Nam W, Que LJ. J Am Chem Soc. 2004;126:472. doi: 10.1021/ja037288n. [DOI] [PubMed] [Google Scholar]
- 31.Rohde JU, In J, Lim MH, Brennessel WW, Bukowski MR, Stubna A, Münck E, Nam W, Que LJ. Science. 2003;299:1037. doi: 10.1126/science.299.5609.1037. [DOI] [PubMed] [Google Scholar]
- 32.Seo MS, Jang HG, Kim J, Nam W. Bull Korean Chem Soc. 2005;26:971. [Google Scholar]
- 33.Frisch MJ, Trucks GW, Schlegel HB, Scuseria GE, Robb MA, Cheeseman JR, Scalmani G, Barone V, Mennucci B, Petersson GA, Nakatsuji H, Caricato M, Li X, Hratchian HP, Izmaylov AF, Bloino J, Zheng G, Sonnenberg JL, Hada M, Ehara M, Toyota K, Fukuda R, Hasegawa J, Ishida M, Nakajima T, Honda Y, Kitao O, Nakai H, Vreven T, Montgomery JA, Peralta JE, Ogliaro F, Bearpark M, Heyd JJ, Brothers E, Kudin KN, Staroverov VN, Kobayashi R, Normand J, Raghavachari K, Rendell A, Burant JC, Iyengar SS, Tomasi J, Cossi M, Rega N, Millam JM, Klene M, Knox JE, Cross JB, Bakken V, Adamo C, Jaramillo J, Gomperts R, Stratmann RE, Yazyev O, Austin AJ, Cammi R, Pomelli C, Ochterski JW, Martin RL, Morokuma K, Zakrzewski VG, Voth GA, Salvador P, Dannenberg JJ, Dapprich S, Daniels AD, Farkas; Foresman JB, Ortiz JV, Cioslowski J, Fox DJ. Wallingford CT. 2009. [Google Scholar]
- 34.Tenderholt AL. QMforge, Version 2.1. [Google Scholar]
- 35.Zang Y, Kim J, Dong YH, Wilkinson EC, Appelman EH, Que L. J Am Chem Soc. 1997;119:4197. [Google Scholar]
- 36.Li FF, Meier KK, Cranswick MA, Chakrabarti M, Van Heuvelen KM, Munck E, Que L. J Am Chem Soc. 2011;133:7256. doi: 10.1021/ja111742z. [DOI] [PMC free article] [PubMed] [Google Scholar]
- 37.The fit was done by using Visual-RHOMBO: Hagen WR. Mol Phys. 2007;105:2031.
- 38.Neese F, Solomon EI. Inorg Chem. 1999;38:1847. doi: 10.1021/ic981264d. [DOI] [PubMed] [Google Scholar]
- 39.Roelfes G, Lubben M, Hage R, Que L, Feringa BL. Chem-Eur J. 2000;6:2152. doi: 10.1002/1521-3765(20000616)6:12<2152::aid-chem2152>3.0.co;2-o. [DOI] [PubMed] [Google Scholar]
- 40.Park MJ, Lee J, Suh Y, Kim J, Nam W. J Am Chem Soc. 2006;128:2630. doi: 10.1021/ja055709q. [DOI] [PubMed] [Google Scholar]
- 41.Mayer I. Chem Phys Lett. 1983;97:270. [Google Scholar]
- 42.de Visser SP, Latifi R, Tahsini L, Nam W. Chemistry-an Asian Journal. 2011;6:493. doi: 10.1002/asia.201000586. [DOI] [PubMed] [Google Scholar]
- 43.Johansson AJ, Blomberg MRA, Siegbahn PEM. J Phys Chem C. 2007;111:12397. [Google Scholar]
- 44.Johansson AJ, Blomberg MRA, Siegbahn PEM. J Chem Phys. 2008:129. doi: 10.1063/1.2991180. [DOI] [PubMed] [Google Scholar]
- 45.Lundberg M, Siegbahn PEM. J Chem Phys. 2005:122. doi: 10.1063/1.1926277. [DOI] [PubMed] [Google Scholar]
- 46.Neese F, Zaleski JM, Zaleski KL, Solomon EI. J Am Chem Soc. 2000;122:11703. [Google Scholar]
- 47.Marlin DS, Olmstead MM, Mascharak PK. Eur J Inorg Chem. 2002:859. doi: 10.1021/ic010523n. [DOI] [PubMed] [Google Scholar]
- 48.Bouchoux G, Dagaut J. Org Mass Spectrom. 1981;16:246. [Google Scholar]
- 49.DeMore WB, Sander SP, Golden DM, Hampson RF, Kurylo MJ, Howard CJ, Ravishankara AR, Kolb CE, Molina MJ. Calif Inst Technol. Jet Propulsion Lab., JPL Publ; 1997. pp. 97–4. [Google Scholar]
- 50.CRC Handbook of Chemistry and Physics. 78. CRC Press; New York: 1997–1998. [Google Scholar]
- 51.Bassan A, Blomberg MA, Siegbahn PM. J Biol Inorg Chem. 2004;9:439. doi: 10.1007/s00775-004-0537-0. [DOI] [PubMed] [Google Scholar]
- 52.Wolfe MD, Lipscomb JD. J Biol Chem. 2003;278:829. doi: 10.1074/jbc.M209604200. [DOI] [PubMed] [Google Scholar]
Associated Data
This section collects any data citations, data availability statements, or supplementary materials included in this article.


