

Abstract
Background
Many studies have investigated factors associated with the rate of decline and evolution from mild cognitive impairment to Alzheimer’s disease (AD) dementia in elderly patients. In this analysis we compared the rates of decline to dementia estimated from three common global measures of cognition: Mini Mental Status Examination (MMSE) score, Clinical Dementia Rating sum of boxes score (CDR-SB), and a neuropsychological tests composite score (CS).
Methods
A total of 2,899 subjects in the National Alzheimer’s Coordinating Center Uniform Data Set age 65+ years diagnosed with amnestic mild cognitive impairment (aMCI) were included in this analysis. Population-averaged decline to dementia rates were estimated and compared for standardized MMSE, CDR-SB, and Composite scores using Generalized Estimating Equations (GEE). Associations between rate of decline and several potential correlates of decline were also calculated and compared across measures.
Results
The CDR-SB had the steepest estimated slope, with a decline of .49 standard deviations (SD) per year, followed by the MMSE with .22 SD/year, and finally the CS with .07 SD/year. The rate of decline of the three measures differed significantly in a global test for differences (p<.0001). Age at visit, BMI at visit, APOE ε4 allele status, and race (black vs. white) had significantly different relationships with rate of decline in a global test for difference among the three measures.
Conclusions
These results suggest that both the rate of decline and the effects of AD risk factors on decline to dementia can vary depending on the evaluative measure used.
Keywords: neuropsychological testing, Alzheimer’s Disease, cognitive assessment, aging
Introduction
Background
Identifying correlates and risk factors for cognitive and functional decline is an important area of research in aging and geriatric care. Many studies have estimated the effects of risk factors on the rate of decline and evolution from mild cognitive impairment (MCI) to Alzheimer’s disease (AD) dementia; however, the measure or measures used to quantify decline vary from study to study. Some past studies have used a single global test (Clarke et al., 2010; Cronk et al., 2010; Landau et al., 2010; Storandt et al., 2002; Whitehair et al., 2010), while others have calculated composite scores from several tests (Cosentino et al., 2008; Wilson et al., 2011).
Estimated rates of decline may depend on the measurement used to estimate the slope. In addition, the strength of the association between a potential correlate of decline and the estimated rate of decline may be influenced by the choice of outcome measurement used to evaluate the effect. Thus, estimation of the rate of the decline and its correlates may be measurement-dependent. Variation in the measures used to characterize decline make it difficult to compare estimates of decline across studies. Understanding the possible differences among the measures is an essential step towards identifying risk factors for decline to AD dementia. Differences across measures could also have a profound effect on intervention trials where cognitive and functional changes are often the endpoints of interest (Reisberg, 2007).
Specific aims
The primary aim of this analysis was to estimate and compare the rates of decline to AD dementia for three common measures: Mini Mental State Examination (MMSE) score (Folstein et al., 1975), Clinical Dementia Rating sum of boxes score (CDR-SB) (Morris, 1993), and a neuropsychological test composite score (CS) from the Uniform Data Set (UDS) Neuropsychological Test Battery (Weintraub et al., 2009). The second aim was to test for differences in the strength of association between common predictors (e.g., patient characteristics) on the rate of decline estimated from the three outcomes. For example, increased age may be associated with a faster decline as estimated by the CDR-SB but may not be associated with the rate of decline when the endpoint is the CS.
2. Methods
Study subjects
The study population was composed of subjects from the National Alzheimer’s Coordinating Center NACC Uniform Data Set (Beekly et al., 2007), gathered prospectively from 33 Alzheimer’s Disease Centers (ADCs) (29 active and 4 inactive) between September 2005 and June 2011. Subjects underwent annual clinical exams, which included cognitive and functional testing. Standardized forms were used at all Centers and informed consent was given by all subjects and their informants. Research using the NACC database was approved by the Institutional Review Board at the University of Washington.
This analysis focused on subjects with a clinical diagnosis of amnestic MCI (aMCI) defined by the Petersen criteria (Petersen et al., 2001), as these subjects are often considered to have early-stage AD (Morris et al., 2001). Subjects with single domain and multi-domain amnestic MCI were included (Petersen, 2004). At least one follow-up visit after an aMCI diagnosis was required in order to evaluate change over time. Subjects under the age of 65 were excluded in order to remove those with probable early-onset AD. Of the 5,008 subjects who had a diagnosis of aMCI during at least one visit, 2,899 met the additional follow-up visit and age inclusion criteria.
Measures of cognition and function
The MMSE is a commonly used test of cognitive function. The total score ranges from 0 (too cognitively impaired to answer any questions) to 30 (no detectable decline in cognition). The CDR is a measure of cognition and function used to identify patients who are likely to be on a trajectory towards AD dementia. The CDR grades performance, based on observation and input from a collateral source, in six domains: memory, orientation, judgment and problem solving, community affairs, home and hobbies, and personal care. Impairment in each of the six domains is evaluated by the clinician as none (0), questionable (0.5), mild (1), moderate (2), and severe(3). Thus, scores range from 0 to 18 with a low score representing no detectable decline in cognition and function and a high score indicating severe impairment and high likelihood of AD dementia.
The composite score (CS) was calculated from 10 tests in the UDS Neuropsychological Test Battery. These tests evaluated five cognitive domains (Weintraub et al., 2009). Tests of episodic memory were Current Logical Memory IA Story Units Recalled (Wechsler, 1987), Logical Memory IIA-Delayed Story Units Recalled (Wechsler, 1987), and WAIS-R Digit Symbol (Wechsler, 1981). Semantic memory and language were assessed by the Boston Naming Test (Kaplan, 1983), as well as animal and vegetable naming tests (Morris et al., 1989). Digit Span Backwards and Forwards Trials Correct (Wechsler, 1987) tested working memory and attention. Finally, Trail Making Test Part A evaluated processing speed, and Trail Making Test Part B (Reitan, 1993) evaluated executive function.
For all tests except the two Trail Making tests, a low score indicated poor performance. In order to make the tests more comparable, observed scores from the two Trail Making tests were subtracted from their maximum scores (150 and 300, respectively). A low score on the transformed test then indicated poor performance.
Scores on the individual neuropsychological tests were standardized by subtracting the study sample baseline mean from the raw score and dividing by the study sample baseline standard deviation, yielding a Z-score. All 10 standardized test scores were averaged at each subject-visit to create a single score. If at least one neuropsychological test score was missing, the CS could not be calculated and was considered missing.
Statistical analysis
All three measures (CDR-SB, MMSE, and CS) were converted into standardized scores by subtracting the baseline mean and dividing by the baseline standard deviation of the study sample (this was a second standardization for the CS). The standardized scores for the three measures were then stacked to create three outcome values for each patient on each visit so that the outcome became Yijk, the standardized score for the ith subject at time tj for measurement type k.
Missing standardized measurement scores were estimated using multiple imputation with chained equations (Little and Rubin, 1987; van Buuren, 2007). The process of multiple imputation requires that the unavailable data be imputed not just once but multiple times for each missing data point. In this analysis, we imputed the missing values 20 times, resulting in 20 complete data sets. The regression analyses were run on each of the 20 complete data sets. Variables used to estimate the missing scores included: time since baseline, measurement type, time-measurement type interaction terms, age at visit, education, sex, race, and single vs. multiple cognitive domain deficit at the current visit. Potential correlates with any missing data were not imputed and were not used in imputing the missing measurement scores. The main advantage of using multiple imputation over the complete case sample was to anticipate the likely possibility that the presence of missing scores was not completely random, in other words, that the missing scores were systematically higher or lower than observed scores after accounting for known subject characteristics.
Spaghetti plots and cubic spline interpolations of the measures over time suggested that the assumption of linear decline was reasonable. Multiple linear regression fit by Generalized Estimating Equations (GEE) was implemented to simultaneously model all of the standardized scores at every available time point while accounting for clustering of measurement types and visits within subjects (Hubbard et al., 2010; Liang, 1973). An independent correlation structure with robust standard errors was employed. Coefficients and standard errors were combined using Rubin’s rules (Rubin and Schenker, 1991).
The second aim was addressed by adding a potential correlate of decline and including all two-and three-way interaction terms to the regression model. The common predictors of decline to dementia included in this analysis were age, race, education, sex, body mass index (BMI), Hachinski Ischemic score (HIS), Apolipoprotein E (APOE) ε4 allele, and single- vs. multiple-domain impairment. Age, BMI, HIS, and single- vs. multiple-domain impairment were treated as time-varying covariates; all other predictors were considered baseline-only measures. A separate regression model was run for each of the predictors, using Rubin’s rules to combine estimates across the imputed data sets (Rubin and Schenker, 1991). Finally, the relationship between the predictor and the rate of decline was compared across the three measures using a global test for differences. All analyses were performed using R 2.13.1 (R Development Core Team, 2008).
Sensitivity analysis
An alternative calculation of the composite score and an analysis without imputation were performed in order to assess the extent to which the results depended on the methods used to analyze the data. First, the CS was calculated by averaging the standardized scores within domain and then averaging across domains. This alternative calculation gave equal weight to each domain but not to each individual test. Second, all available data from subject-visits that met original exclusion criteria (missing the MMSE or any test used to calculate the CS does not warrant deletion of the entire subject-visit) were analyzed. Finally, alternate correlation structures and clustering mechanisms were explored.
Results
Analytic sample characteristics
On average, subjects were followed for 2.4 years (range: 0.5–5.8 years) and completed 3.1 evaluations (range: 2–6 evaluations). Approximately 15% of the 8,933 visits included in this analysis had at least one missing measurement value. Around 5% of visits were missing MMSE, and 15% were missing at least one neuropsychological test score used in constructing the CS; no subject had a missing CDR-SB score (a required data element in the UDS).
Demographic and clinical characteristics of the analytic sample are described in Table 1. All characteristics are evaluated at the first visit where the subject met all inclusion criteria, except years followed and number of evaluations completed. Body mass index, HIS, and APOE ε4 allele status were the only characteristics with any missing data (803 visits, 304 visits, and 966 subjects, respectively).
Table 1.
Baseline characteristics of analytic sample (n=2899 subjects)
| Characteristic | Statistic | Missing n (%) | Neuropsychological test range |
|---|---|---|---|
| Years followed | 2.4 (1.2) | ||
| Visits | 3.1 (1.1) | ||
| Age (years) | 77.8 (7.4) | ||
| Race: | |||
| White | 82.9% | ||
| Black | 12.1% | ||
| Asian | 2.6% | ||
| Other | 2.5% | ||
| Sex: Female | 51.0% | ||
| Education (years) | 15.2 (4.8) | ||
| BMI (kg/m2) | 26.2 (5.1) | 222 (8%) | |
| Hachinski Ischemic score | 0.9 (1.8) | 40 (1%) | |
| APOE: ε4 allele present | 43.0% | 966 (33%) | |
| MCI Domain: single | 38.4% | ||
| CDR-SB | 1.3 (1.2) | 0–18 | |
| MMSE | 27.0 (2.5) | 74 (3%) | 0–30 |
| Episodic memory: | |||
| Logical memory units recalled- current | 9.2 (4.3) | 125 (4%) | 0–25 |
| Logical memory units recalled- delayed | 6.7 (4.7) | 118 (4%) | 0–25 |
| WAIS-R digit symbol | 31.1 (18.8) | 214 (7%) | 0–93 |
| Semantic memory: | |||
| Boston Naming Test | 24.8 (4.6) | 112 (4%) | 0–30 |
| Animal naming total | 16.0 (4.9) | 69 (2%) | 0–77 |
| Vegetable naming total | 11.1 (3.7) | 96 (3%) | 0–77 |
| Working memory: | |||
| Digit span forwards | 8.0 (2.0) | 88 (3%) | 0–12 |
| Digit span backwards | 6.0 (2.0) | 89 (3%) | 0–12 |
| Processing speed: | |||
| Trail-making test part A | 44.6 (21.6) | 110 (4%) | 0–150 |
| Executive function: | |||
| Trail-making test part B | 141.6 (76.1) | 202 (7%) | 0–300 |
Calculations are based on observed data only. Years followed and visits are calculated using longitudinal data; all other characteristics are derived only from data observed at baseline, which is defined as the first visit where the subject met all inclusion criteria. Mean and (SD) are presented for continuous measures. Sample percentages are presented for categorical measures.
At the time of their most recent UDS visit, over half of the subjects were still diagnosed with MCI (n=1605, 55%). Of the remaining subjects, 971 (33%) had dementia and 323 (11%) had a diagnosis of normal cognition, failing to meet criteria for MCI.
Differences across measures
Scatterplots of each measurement are displayed in Figure 1. The intercepts and slopes of the lines were estimated from the main effects regression model with GEE using Rubin’s rules to combine estimates from the imputed data sets. The rate of decline of the three measures differed significantly in all pairwise comparisons and for a global test for differences (p<.0001 for all tests). The CDR-SB had the steepest estimated slope, with a decline of .49 standard deviations (SD) per year (95% CI: −.53,−.44), followed by the MMSE with .22 SD/year(95% CI: −.24,−.18), and finally the CS with .07 SD/year (95% CI: −.12,−.02). The estimated rate of decline can be transformed from SD/year back to the test’s original scale by multiplying the estimate by the baseline sample standard deviation. The estimated rate of decline was .59 points/year for the CDR-SB, .55 points/year for the MMSE, and .04 standardized points/year for the CS.
Figure 1.
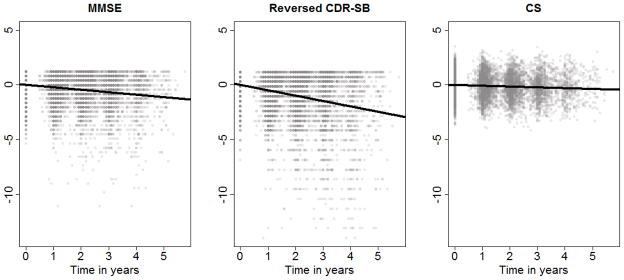
Change in cognitive and functional evaluation over time (slope and intercept of lines are estimated from regression model)
The association between several potential correlates of decline to AD dementia and the rate of decline itself varied across measurement (see Table 2). Age at visit, BMI at visit, APOE ε4 allele status, and race (black vs. white) had significantly different relationships with rate of decline in a global test for difference among the three measures. Marginally significant differences were detected for HIS and race (other vs. white). P-values from the global tests of differences, as well as the estimates and 95% confidence intervals are presented in Table 2 for each predictor. The average rate of decline for a specific measure can be calculated by multiplying the effect estimate by the standard deviation of the sample at baseline. For example, keeping in mind that the CDR-SB increases with level of impairment, we estimate the yearly decline in the CDR-SB score of a 90-year old to be 0.2 points per year greater than for an 80-year old (0.15 SD/year ×10 years ×1.2 SD).
Table 2.
Estimated association between potential correlates and rate of decline for each measure
| Potential Correlates | MMSE | CDR-SB | Composite Score | p-value | |||
|---|---|---|---|---|---|---|---|
|
| |||||||
| Estimate | 95% CI | Estimate | 95% CI | Estimate | 95% CI | ||
| Age (years) | .0005 | (−.003,.004) | −.015 | (−.025,−.005) | −.002 | (−.010, .006) | .0008 |
| Education (years) | −.010 | (−.017,−.003) | −.005 | (−.022,.012) | −.009 | (−.025,.007) | .527 |
| Sex(Male vs. female) | .029 | (−.068,.045) | −.051 | (−.202,.100) | .019 | (−.102, .140) | .211 |
| BMI (kg/m2)* | .009 | (.002,.015) | .025 | (.009,.040) | .006 | (−.008,.020) | .0005 |
| HIS† | −.005 | (−.027,.016) | −.044 | (−.102,.015) | −.006 | (−.052,.040) | .088 |
| APOE: ε4 vs. noε4‡ | −.187 | (−.254,−.117) | −.246 | (−.425,−.066) | −.079 | (−.225,.067) | .010 |
| MCI Domain (Single vs. Multiple) | .070 | (.010,.130) | .060 | (−.100, .219) | .054 | (−.073,.182) | .923 |
| Race: | |||||||
| Black vs. white | .166 | (.097,.234) | .318 | (.139,.497) | .071 | (−.079,.221) | .0002 |
| Asian vs. white | .006 | (−.168,.180) | .114 | (−.314,.542) | −.003 | (−.374,.369) | .427 |
| Other vs. white | .055 | (−.115,.467) | .205 | (−.228,.638) | −.089 | (−.470,.291) | .070 |
Estimates obtained using multiple linear regression with GEE and multiple imputation run separately for each potential correlate. Age, education, BMI, HI, and Domain are time-varying covariates; all other risk factors are observed only at the first visit where the subject met all inclusion criteria. The p-value presented is from a global test for differences among the three measures. P-values less than .05 are in bold. All analysis were performed on 8933 subject-visits except where noted.
8130 subject-visits used in this model due to missing data
5792 subject-visits used in this model due to missing data
2661 subject-visits used in this model due to missing data
Sensitivity analysis
The CS was calculated by first averaging within domain and then across all domains. The missing data were then imputed and analyzed. The results of the regression using the alternative CS calculation produced almost identical results to those in the main analysis (see Table 3).
Table 3.
Estimated slopes for measures of clinical decline using different methods of analysis
| Method | MMSE | CDR-SB | CS | Global test for difference in slope |
|---|---|---|---|---|
| Primary analysis | −.22 (−.24,−.18) | −.49 (−.53,−.44) | −.07 (−.12,−.02) | P<.0001 |
| Using an alternative CS calculation | −.22 (−.24,−.19) | −.49 (−.56,−.41) | −.07 (−.13,−.01) | P<.0001 |
| Using only available data (missing values not imputed) | −.29 (−.32,−.27) | −.54 (−.58,−.50) | −.17 (−.18,−.15) | P<.0001 |
The primary analysis and analysis using the alternative CS calculation included 26799 subject-visit-measures, whereas the analysis excluding missing data had 25084 subject-visit-measures.
An analysis using all available data without imputation included 8,933 subject-visits with 25,084 subject-visit-measures, compared to the imputed analysis which had 26,799 subject-visit-measures. Again, results from the regression model were very similar to those obtained using multiple imputation(see Table 3). Different model specifications for the covariance matrix and clustering mechanism were also explored. All models produced similar results (not shown).
Discussion
Summary and inference
The present study was carried out to determine if the choice of measurement could influence estimated rates of decline in individuals with amnestic mild cognitive impairment and if potential risk factors for decline were also measurement-dependent. Three measures: MMSE, CDR sum of boxes, and a composite score composed of 10 tests in the UDS Neuropsychological Test Battery were analyzed. The estimated slopes for all three measures were significantly different from one another. Thus, estimates of the rate of decline to AD dementia and their correlates can be measurement-dependent, suggesting that the measurements are capturing different pictures of the true underlying cognitive and functional states.
The results of this analysis are similar to those seen in previous studies of MCI and mild AD. For example, in the Washington Heights and Inwood Columbia Aging Project study, composite scores for subject with at least one APOE ε4 allele decreased more than those without an ε4 allele by .06 SD in the incident sample and .07 SD in the prevalent sample (Cosentino et al., 2008). In our analysis, the effect of having at least one APOE ε4 vs. not was to increase the rate of decline in the CS by .08 SD. Other studies have also shown that the association between rate of decline and a predictor can differ depending on the measurement used to assess decline. In the Alzheimer’s Disease Neuroimaging Initiative cohort, the estimated effect of baseline BMI on one year change in cognition varied across outcome measure; significant effects were detected with the CS, MMSE, and ADAS-cog scores but not with the CDR-SB (Cronk et al., 2010).
In this analysis, the CS was arguably the least responsive measure, having the slowest rate of decline. One possible explanation is that the CS averages equally over many domains so that substantial change in one domain is diluted by a lack of change in other domains. Therefore, using a domain-specific composite score, may be more sensitive to change than a global composite score. For example, it is well known that memory and executive function test scores can predict subsequent decline from mild cognitive impairment to a state of dementia (Albert et al., 2001). Instead of combining all of the domains together, these two domains could be analyzed separately.
It is also important to keep in mind that a comparatively small slope does not mean that the composite score is less sensitive to early changes The estimated rate of decline for the CDR-SB appears to be much larger than that of the CS; however, the change in observed scores still may not be clinically meaningful. For example, the average change in CDR-SB was less than 1.5 points after three years. Considering that the CDR-SB ranges from 0 to 18, this change is actually not as marked as indicated by the slope estimates alone. Moreover, though the CS showed rather small changes over time, we were still able to detect significant differences in the rate of decline by age, BMI, and race.
Strengths and weaknesses
This study had a large sample size of subjects from 33 ADCs spread across the United States. Although some subjects had four or five follow-up visits, the median number of visits was only three. Ideally, all subjects would be followed through to a diagnosis of dementia, however, less than half of the subjects had a diagnosis of dementia at their most recent visit. Several factors are likely to have contributed to this. First, the UDS has been active since 2005, with many subjects enrolled only recently. Second, subjects with decreased cognitive and functional abilities have a harder time scheduling and attending clinical visits. In addition, cognitive deficits can be due to non-neurodegenerative processes such as depression and medication. While limiting the sample to subjects who were eventually diagnosed with dementia would certainly capture those most likely to have AD pathology, inclusion of all subjects with amnestic MCI allowed us to look at a more general population of subjects meeting aMCI criteria.
It is also possible that a longer follow-up period could give different estimates of rate of decline and even change the shape of decline from a linear trend to a more curvilinear decline or a change point, as other studies have shown (Wilkosz et al., 2010; Wilson et al., 2010).
Although the sensitivity analysis suggests that the results are robust to some analysis decisions, the extent of the external validity is unknown. It is difficult to generalize these results to all older adults with aMCI, as those who decline to dementia are more likely to miss visits, drop out, or die. The NACC database itself is best characterized as a large case-series, rather than a statistically-based sample of the United States population.
Conclusion
In summary, the rate of decline in amnestic MCI subjects differed depending on the measure used to capture progression to AD dementia. The estimated association between the rate of decline and a predictor such as age was also influenced by the measurement used to describe progression. Variation in both the strength and direction of the association between rate of decline and its correlates may influence intervention trials where the target is cognitive and/or functional change, as the effect of the intervention could vary depending on the measurement used to estimate decline.
Acknowledgments
The NACC database is supported by the NIA grant: UO1 AG016976. The authors thank the NACC Methods Committee members for their suggestions and feedback, as well as George Thomas for database support.
Footnotes
Conflict of Interest:
None.
Description of authors’ roles:
S. Monsell carried out the statistical analysis and writing of the article. D. Liu gave consultation on statistical methodology, interpretation of results, and reviewed the manuscript. W. Kukull and S. Weintraub provided assistance in design of the study, as well as review of the manuscript.
References
- Albert MS, Moss MB, Tanzi R, Jones K. Preclinical prediction of AD using neuropsychological tests. J Int Neuropsychol Soc. 2001;7:631–639. doi: 10.1017/s1355617701755105. [DOI] [PubMed] [Google Scholar]
- Beekly DL, et al. The National Alzheimer’s Coordinating Center (NACC) database: the Uniform Data Set. Alzheimer Dis Assoc Disord. 2007;21:249–258. doi: 10.1097/WAD.0b013e318142774e. [DOI] [PubMed] [Google Scholar]
- Clarke DE, Ko JY, Lyketsos C, Rebok GW, Eaton WW. Apathy and cognitive and functional decline in community-dwelling older adults: results from the Baltimore ECA longitudinal study. Int Psychogeriatr. 2010;22:819–829. doi: 10.1017/S1041610209991402. [DOI] [PMC free article] [PubMed] [Google Scholar]
- Cosentino S, et al. APOE epsilon 4 allele predicts faster cognitive decline in mild Alzheimer disease. Neurology. 2008;70:1842–1849. doi: 10.1212/01.wnl.0000304038.37421.cc. [DOI] [PMC free article] [PubMed] [Google Scholar]
- Cronk BB, Johnson DK, Burns JM. Body mass index and cognitive decline in mild cognitive impairment. Alzheimer Dis Assoc Disord. 2010;24:126–130. doi: 10.1097/WAD.0b013e3181a6bf3f. [DOI] [PMC free article] [PubMed] [Google Scholar]
- Folstein MF, Folstein SE, McHugh PR. “Mini-mental state”: a practical method for grading the cognitive state of patients for the clinician. Journal of Psychiatric Research. 1975:189–198. doi: 10.1016/0022-3956(75)90026-6. [DOI] [PubMed] [Google Scholar]
- Hubbard AE, et al. To GEE or not to GEE: comparing population average and mixed models for estimating the associations between neighborhood risk factors and health. Epidemiology. 2010;21:467–474. doi: 10.1097/EDE.0b013e3181caeb90. [DOI] [PubMed] [Google Scholar]
- Kaplan E, Goodglass H, Weintraub S. The Boston Naming Test. Philadelphia, PA: Lea and Febiger; 1983. [Google Scholar]
- Landau SM, et al. Comparing predictors of conversion and decline in mild cognitive impairment. Neurology. 2010;75:230–238. doi: 10.1212/WNL.0b013e3181e8e8b8. [DOI] [PMC free article] [PubMed] [Google Scholar]
- Liang KY, Zeger S. Longitudinal data analysis using generalized linear models. Biometrika. 1973;1:13–22. [Google Scholar]
- Little RJA, Rubin DB. Statistical Analysis with Missing Data. New York, NY: J. Wiley & Sons; 1987. [Google Scholar]
- Morris JC. The Clinical Dementia Rating (CDR): current version and scoring rules. Neurology. 1993;43:2412–2414. doi: 10.1212/wnl.43.11.2412-a. [DOI] [PubMed] [Google Scholar]
- Morris JC, et al. The Consortium to Establish a Registry for Alzheimer’s Disease (CERAD). Part I. Clinical and neuropsychological assessment of Alzheimer’s disease. Neurology. 1989;39:1159–1165. doi: 10.1212/wnl.39.9.1159. [DOI] [PubMed] [Google Scholar]
- Morris JC, et al. Mild cognitive impairment represents early-stage Alzheimer disease. Arch Neurol. 2001;58:397–405. doi: 10.1001/archneur.58.3.397. [DOI] [PubMed] [Google Scholar]
- Petersen RC. Mild cognitive impairment as a diagnostic entity. J Intern Med. 2004;256:183–194. doi: 10.1111/j.1365-2796.2004.01388.x. [DOI] [PubMed] [Google Scholar]
- Petersen RC, et al. Current concepts in mild cognitive impairment. Arch Neurol. 2001;58:1985–1992. doi: 10.1001/archneur.58.12.1985. [DOI] [PubMed] [Google Scholar]
- R Development Core Team. R: A language and environment for statistical computing. Vienna, Austria: R Foundation for Statistical Computing; 2008. [Google Scholar]
- Reisberg B. Global measures: utility in defining and measuring treatment response in dementia. Int Psychogeriatr. 2007;19:421–456. doi: 10.1017/S1041610207005261. [DOI] [PubMed] [Google Scholar]
- Reitan R, Wolfson D. The Halstead-Reitan Neuropsychological Test Battery: Theory and Clinical Interpretation. Tucson, AZ: Neuropsychology Press; 1993. [Google Scholar]
- Rubin DB, Schenker N. Multiple imputation in health-care databases: an overview and some applications. Stat Med. 1991;10:585–598. doi: 10.1002/sim.4780100410. [DOI] [PubMed] [Google Scholar]
- Storandt M, Grant EA, Miller JP, Morris JC. Rates of progression in mild cognitive impairment and early Alzheimer’s disease. Neurology. 2002;59:1034–1041. doi: 10.1212/wnl.59.7.1034. [DOI] [PubMed] [Google Scholar]
- van Buuren S. Multiple imputation of discrete and continuous data by fully conditional specification. Stat Methods Med Res. 2007;16:219–242. doi: 10.1177/0962280206074463. [DOI] [PubMed] [Google Scholar]
- Wechsler A. Wechsler Adult Intelligence Scale-Revised. San Antonio, TX: Psychological Corporation; 1981. [Google Scholar]
- Wechsler D. Wechsler Memory Scale-Revised Manual. San Antonio, TX: Psychological Corporation; 1987. [Google Scholar]
- Weintraub S, et al. The Alzheimer’s Disease Centers’ Uniform Data Set (UDS): the neuropsychologic test battery. Alzheimer Dis Assoc Disord. 2009;23:91–101. doi: 10.1097/WAD.0b013e318191c7dd. [DOI] [PMC free article] [PubMed] [Google Scholar]
- Whitehair DC, et al. Influence of apolipoprotein E varepsilon4 on rates of cognitive and functional decline in mild cognitive impairment. Alzheimers Dement. 2010;6:412–419. doi: 10.1016/j.jalz.2009.12.003. [DOI] [PMC free article] [PubMed] [Google Scholar]
- Wilkosz PA, et al. Trajectories of cognitive decline in Alzheimer’s disease. Int Psychogeriatr. 2010;22:281–290. doi: 10.1017/S1041610209991001. [DOI] [PMC free article] [PubMed] [Google Scholar]
- Wilson RS, Leurgans SE, Boyle PA, Bennett DA. Cognitive decline in prodromal Alzheimer disease and mild cognitive impairment. Arch Neurol. 2011;68:351–356. doi: 10.1001/archneurol.2011.31. [DOI] [PMC free article] [PubMed] [Google Scholar]
- Wilson RS, Leurgans SE, Boyle PA, Schneider JA, Bennett DA. Neurodegenerative basis of age-related cognitive decline. Neurology. 2010;75:1070–1078. doi: 10.1212/WNL.0b013e3181f39adc. [DOI] [PMC free article] [PubMed] [Google Scholar]