Distinguishing Amyloid Fibril Structures in AlzheimerâĂŹs Disease (AD) by Two-Dimensional Ultraviolet (2DUV) Spectroscopy
Biochemistry , 2011, 50(45), 9809–9816.
A. R. Lam , J. Jiang and S. Mukamel
In the original manuscript, the Tyrosine (Y) residue was labeled as Y9. The correct label is Y10.
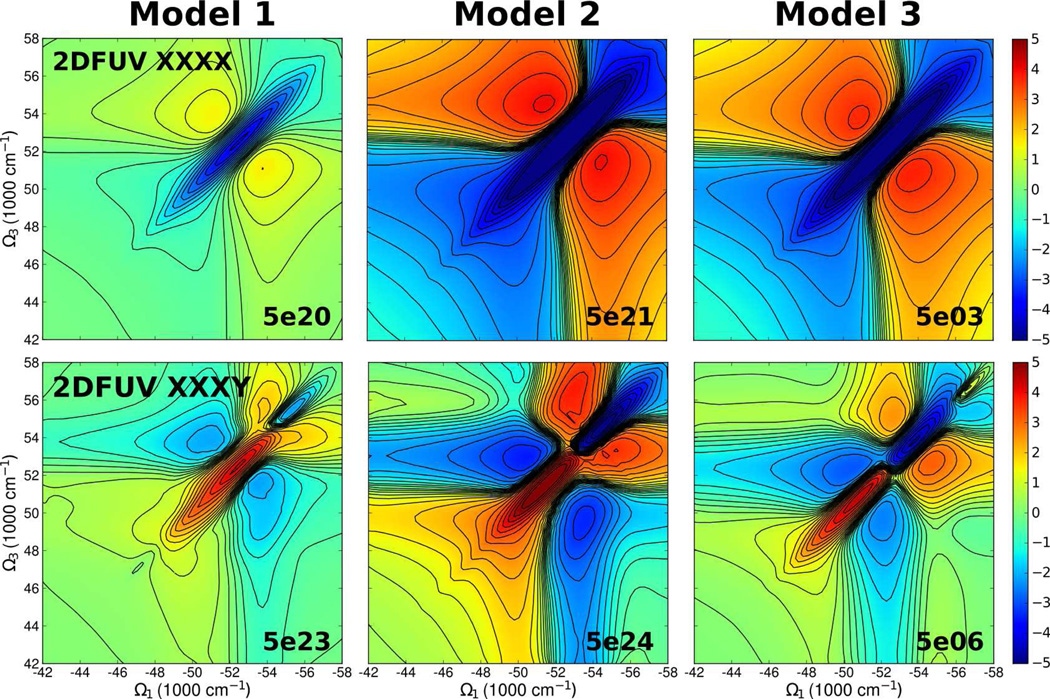
Page 9814. In Fig. 8, the 2DFUV signals of Model 1 only included the contributions from the backbone (1) whereas Models 2 and 3 included the side chains. To make a fair comparison, we have recalculated the 2DFUV signals of Model 1 with the contributions from the backbone and side chains. These are shown in revised Fig. Figure 1. Major features of the (xxxx) and (xxxy) spectra remain unaltered. Its chiral-induced (xxxy) spectrum now shows a symmetric shape with two peaks along the diagonal: a peak in 52000 cm−1 which is characteristic of a β-sheet content structure. An additional peak appears at 56000 cm−1 that makes a buttefly-shape for the signal similar to Model 2 but with the 52000 cm−1 and 56000 cm−1 peaks elongated along the diagonal, respectively.
Figure 1.
2DFUV non-chiral (xxxx) (top) and chiral-induced (xxxy) (bottom) spectra of amyloid fibril models used in our study.
References
- 1.Jiang J, Abramavicius D, Falvo C, Bulheller BM, Hirst JD, Mukamel S. J. Phys. Chem. B. 2010;114(37):12150–12156. doi: 10.1021/jp1046968. [DOI] [PMC free article] [PubMed] [Google Scholar]


